 17
17peptides
spectra
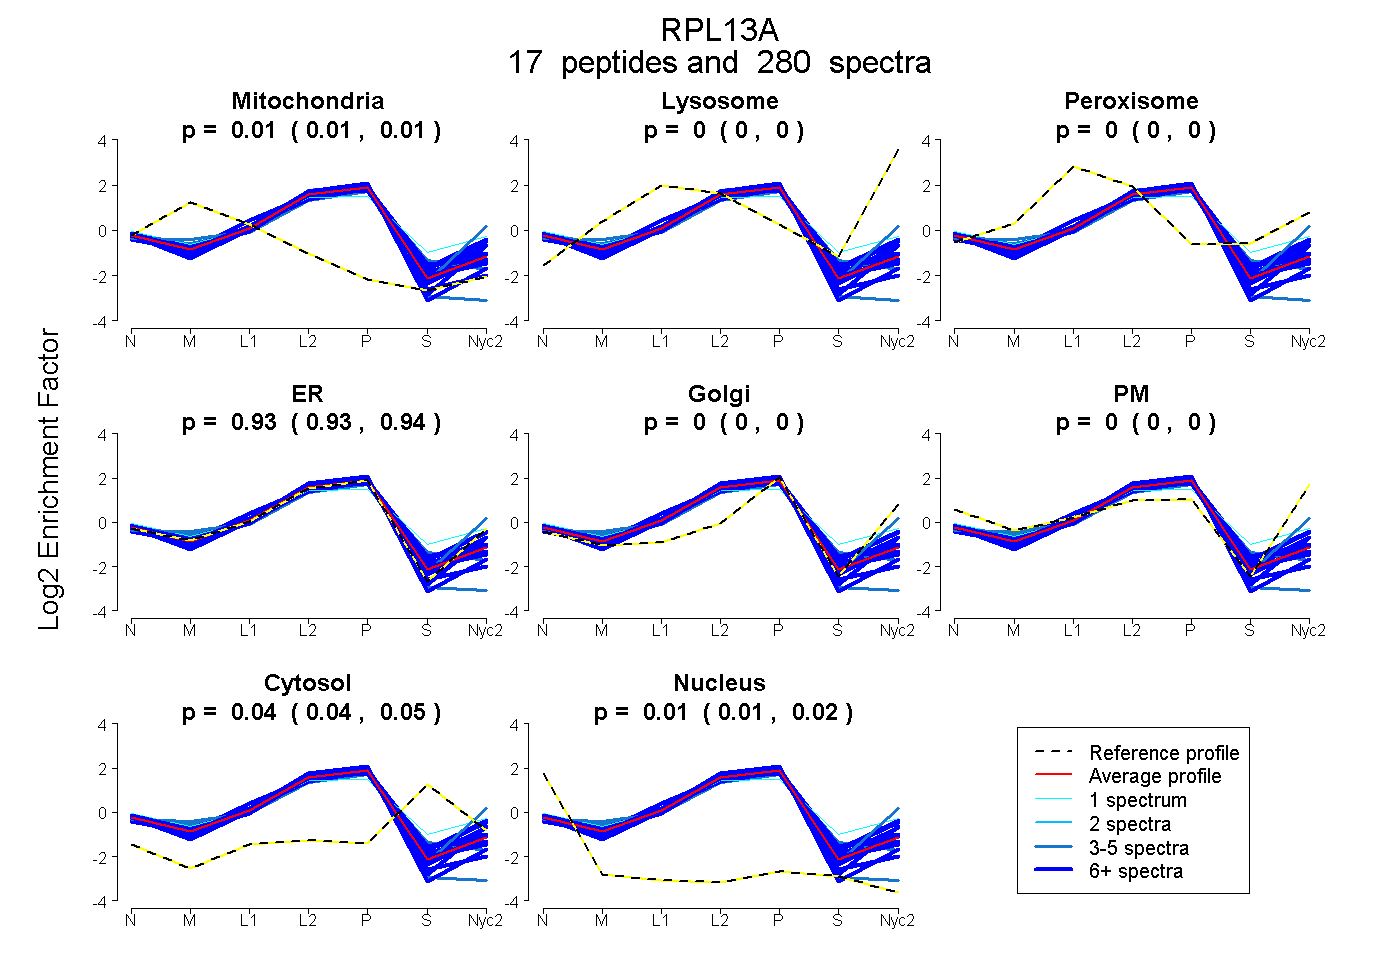
0.006 | 0.008
0.000 | 0.000
0.000 | 0.000
0.933 | 0.936
0.000 | 0.000
0.000 | 0.000
0.042 | 0.047
0.012 | 0.016
16peptides
spectra
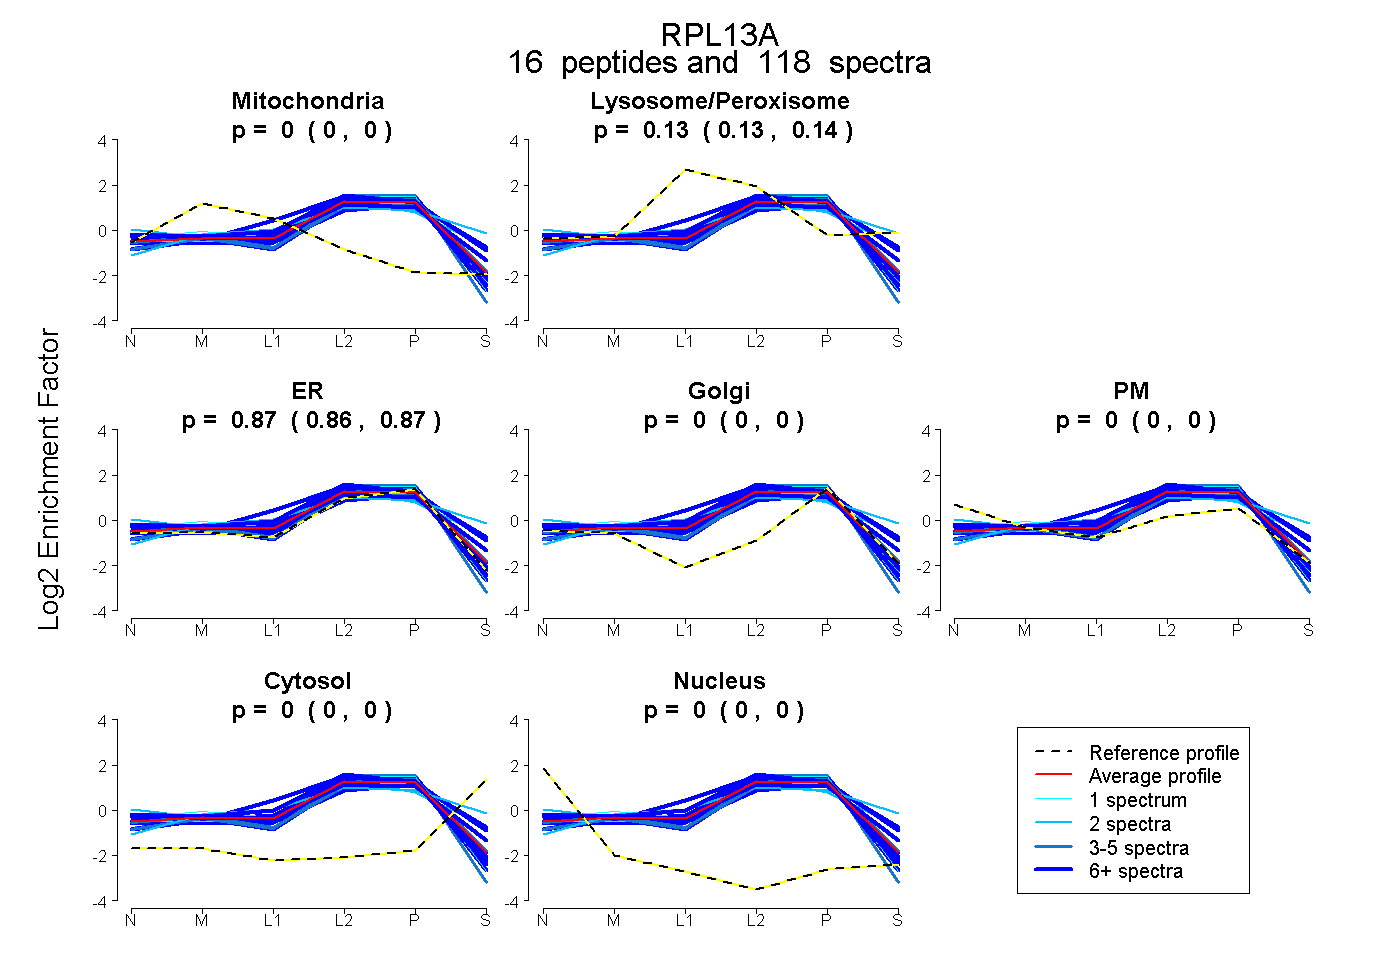
0.000 | 0.000
0.128 | 0.136
0.863 | 0.872
0.000 | 0.000
0.000 | 0.000
0.000 | 0.000
0.000 | 0.000
15peptides
spectra
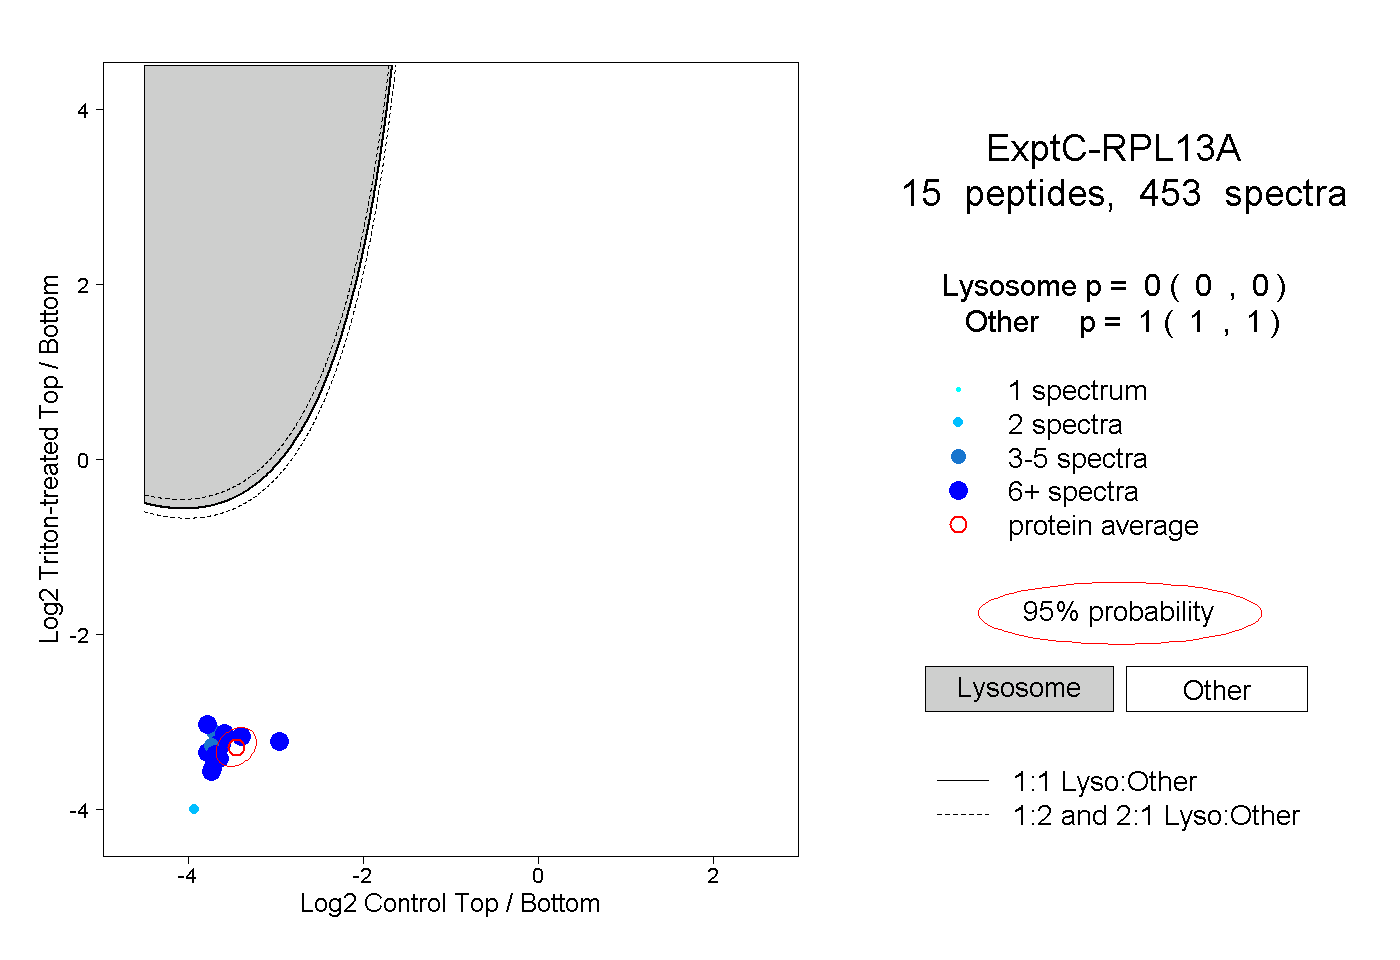
0.000 | 0.000
1.000 | 1.000
13peptides
spectra
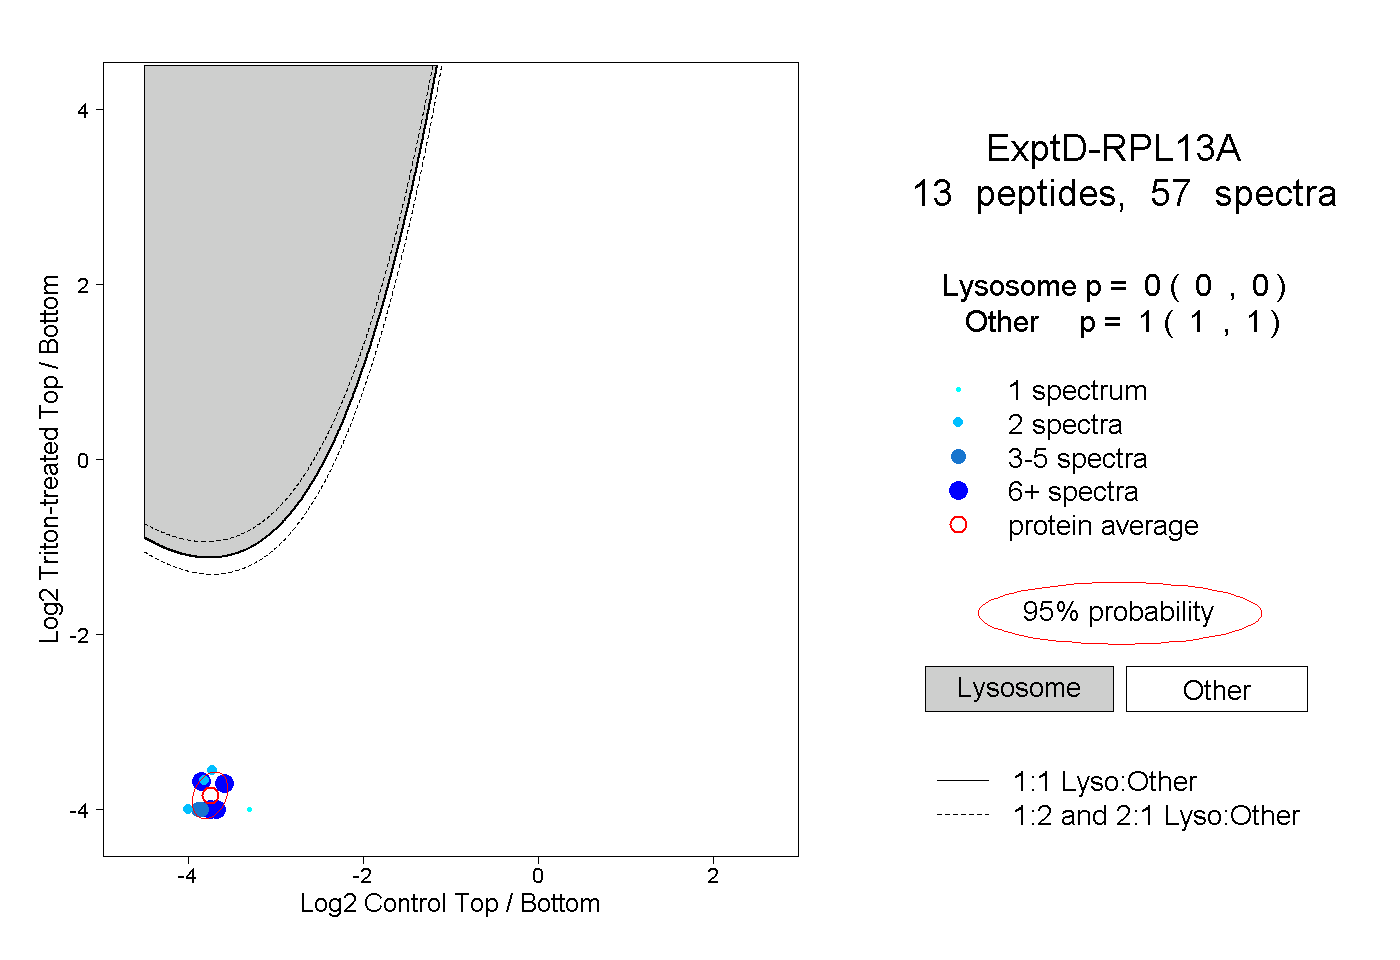
0.000 | 0.000
1.000 | 1.000