RPL13A
[ENSRNOP00000027976]
Main page
| | | Plot |
Mito |
Lyso |
|
Perox |
ER |
Golgi |
PM |
Cytosol |
Nucleus |
|
| Expt A |
 17
17
peptides |
280
spectra |
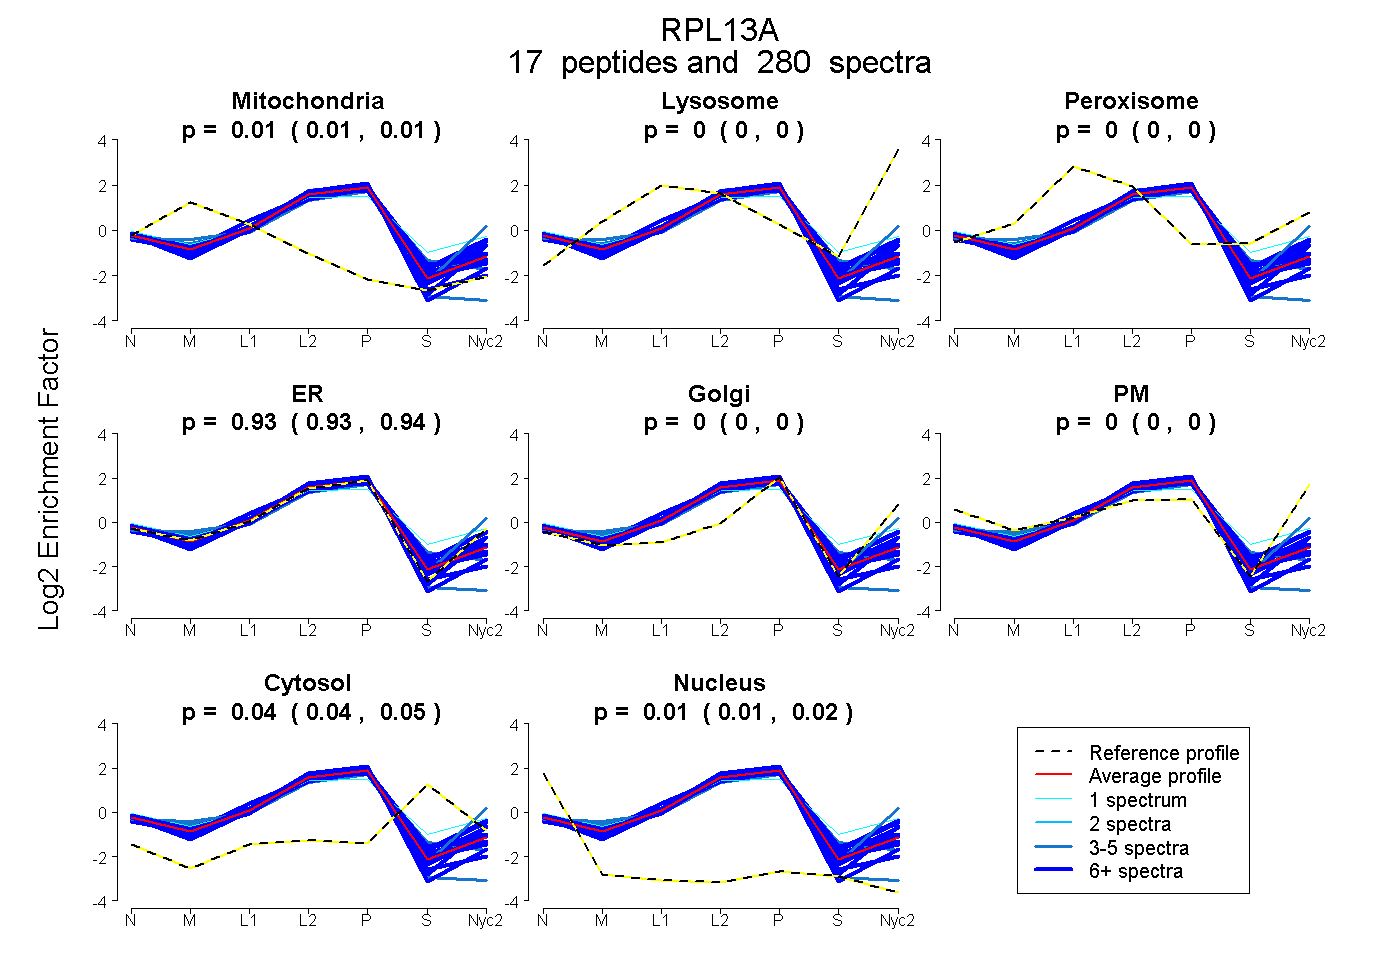 |
0.007
0.006 | 0.008 |
0.000
0.000 | 0.000 |
|
0.000
0.000 | 0.000 |
0.935
0.933 | 0.936 |
0.000
0.000 | 0.000 |
0.000
0.000 | 0.000 |
0.045
0.042 | 0.047 |
0.014
0.012 | 0.016 |
|
| | | Plot |
Mito |
|
Lyso or Perox |
|
ER |
Golgi |
PM |
Cytosol |
Nucleus |
|
| Expt B |
16
peptides |
118
spectra |
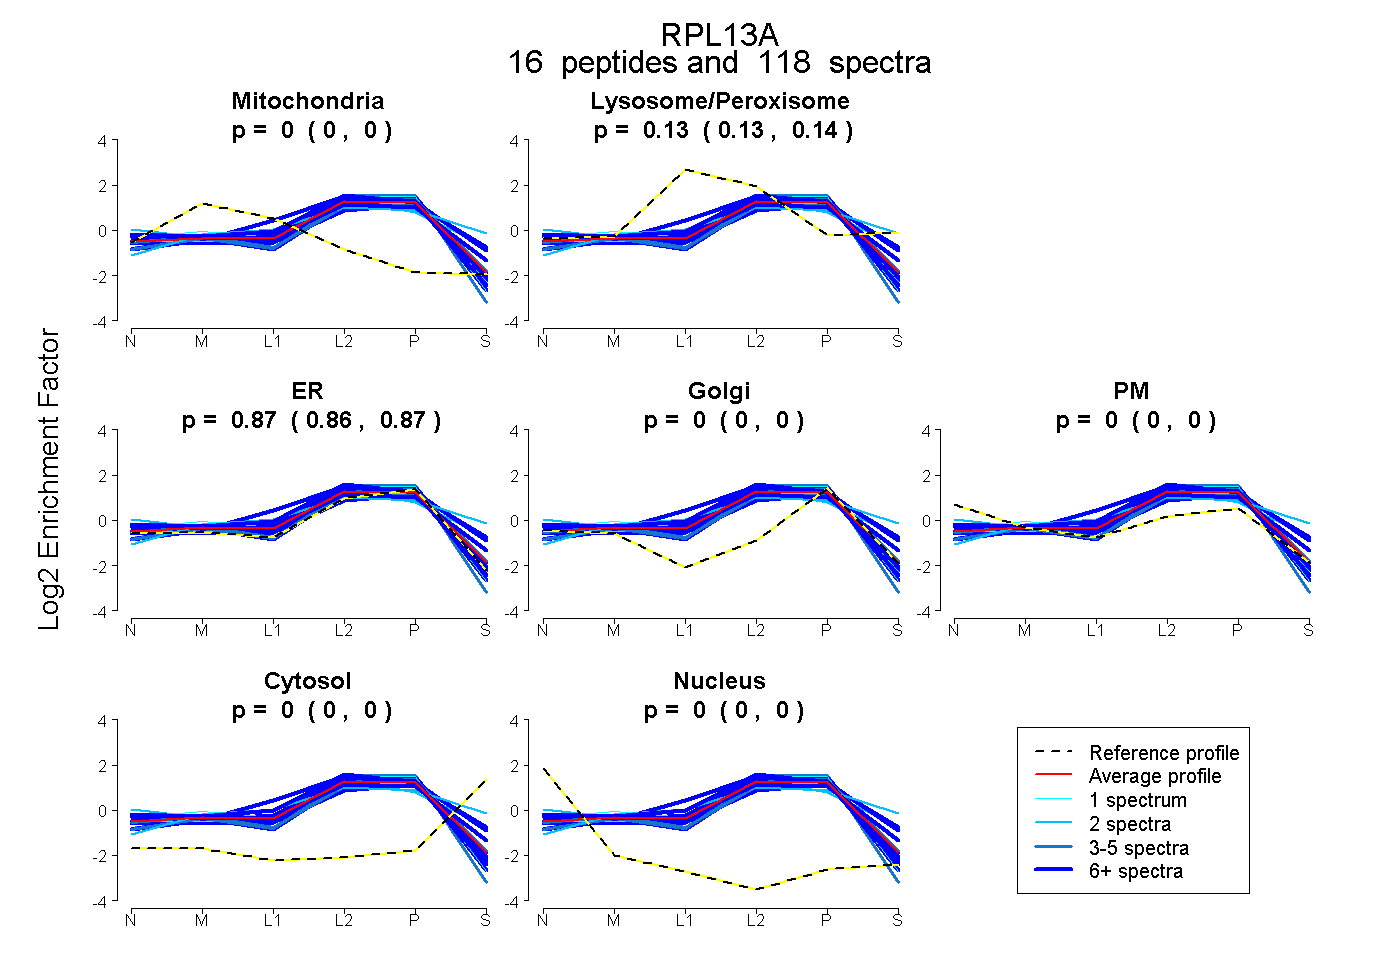 |
0.000
0.000 | 0.000 |
|
0.133
0.128 | 0.136 |
|
0.867
0.863 | 0.872 |
0.000
0.000 | 0.000 |
0.000
0.000 | 0.000 |
0.000
0.000 | 0.000 |
0.000
0.000 | 0.000 |
|
| | | Plot |
|
Lyso |
|
|
|
|
|
|
|
Other |
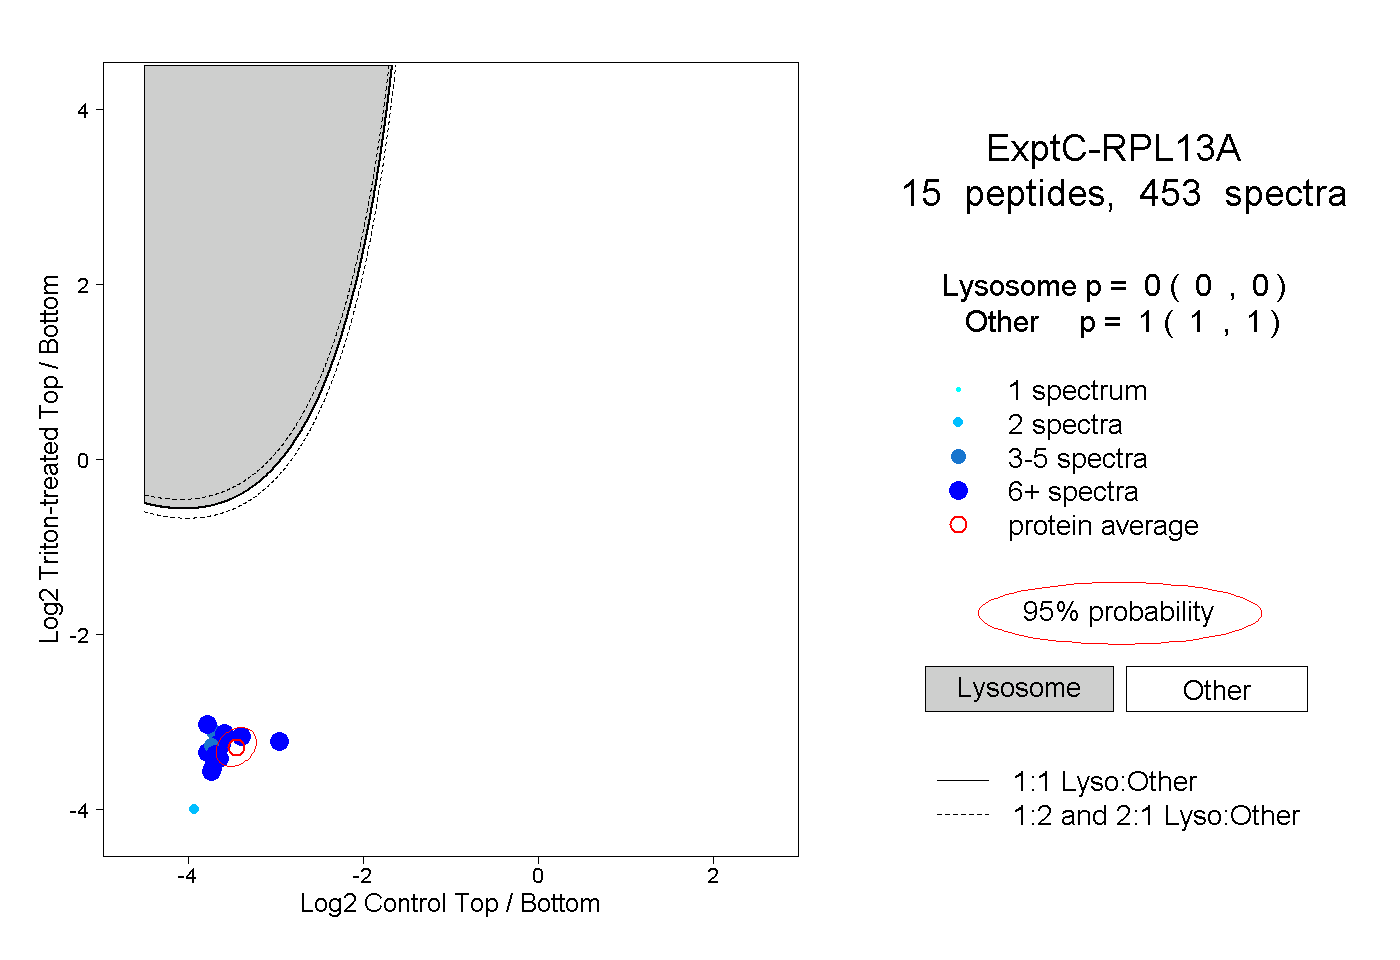
| Expt C |
15
peptides |
453
spectra |
 |
|
0.000
0.000 | 0.000 |
|
|
|
|
|
|
|
1.000
1.000 | 1.000 |
| 19 spectra, GQAALER |
|
0.000 |
|
|
|
|
|
|
|
1.000 |
| 148 spectra, GMLPHK |
|
0.000 |
|
|
|
|
|
|
|
1.000 |
| 5 spectra, CEGINISGNFYR |
|
0.000 |
|
|
|
|
|
|
|
1.000 |
| 45 spectra, LAAIVAK |
|
0.000 |
|
|
|
|
|
|
|
1.000 |
| 67 spectra, MVVPAALK |
|
0.000 |
|
|
|
|
|
|
|
1.000 |
| 35 spectra, YLAFLR |
|
0.000 |
|
|
|
|
|
|
|
1.000 |
| 10 spectra, VLDGIPPPYDK |
|
0.000 |
|
|
|
|
|
|
|
1.000 |
| 7 spectra, GHLLGR |
|
0.000 |
|
|
|
|
|
|
|
1.000 |
| 23 spectra, FAYLGR |
|
0.000 |
|
|
|
|
|
|
|
1.000 |
| 2 spectra, MNTNPSR |
|
0.000 |
|
|
|
|
|
|
|
1.000 |
| 36 spectra, GPYHFR |
|
0.000 |
|
|
|
|
|
|
|
1.000 |
| 8 spectra, LAHEVGWK |
|
0.000 |
|
|
|
|
|
|
|
1.000 |
| 5 spectra, QVLLGR |
|
0.000 |
|
|
|
|
|
|
|
1.000 |
| 34 spectra, FTEVLK |
|
0.000 |
|
|
|
|
|
|
|
1.000 |
| 9 spectra, AEGQVLVLDGR |
|
0.000 |
|
|
|
|
|
|
|
1.000 |
| | | Plot |
|
Lyso |
|
|
|
|
|
|
|
Other |
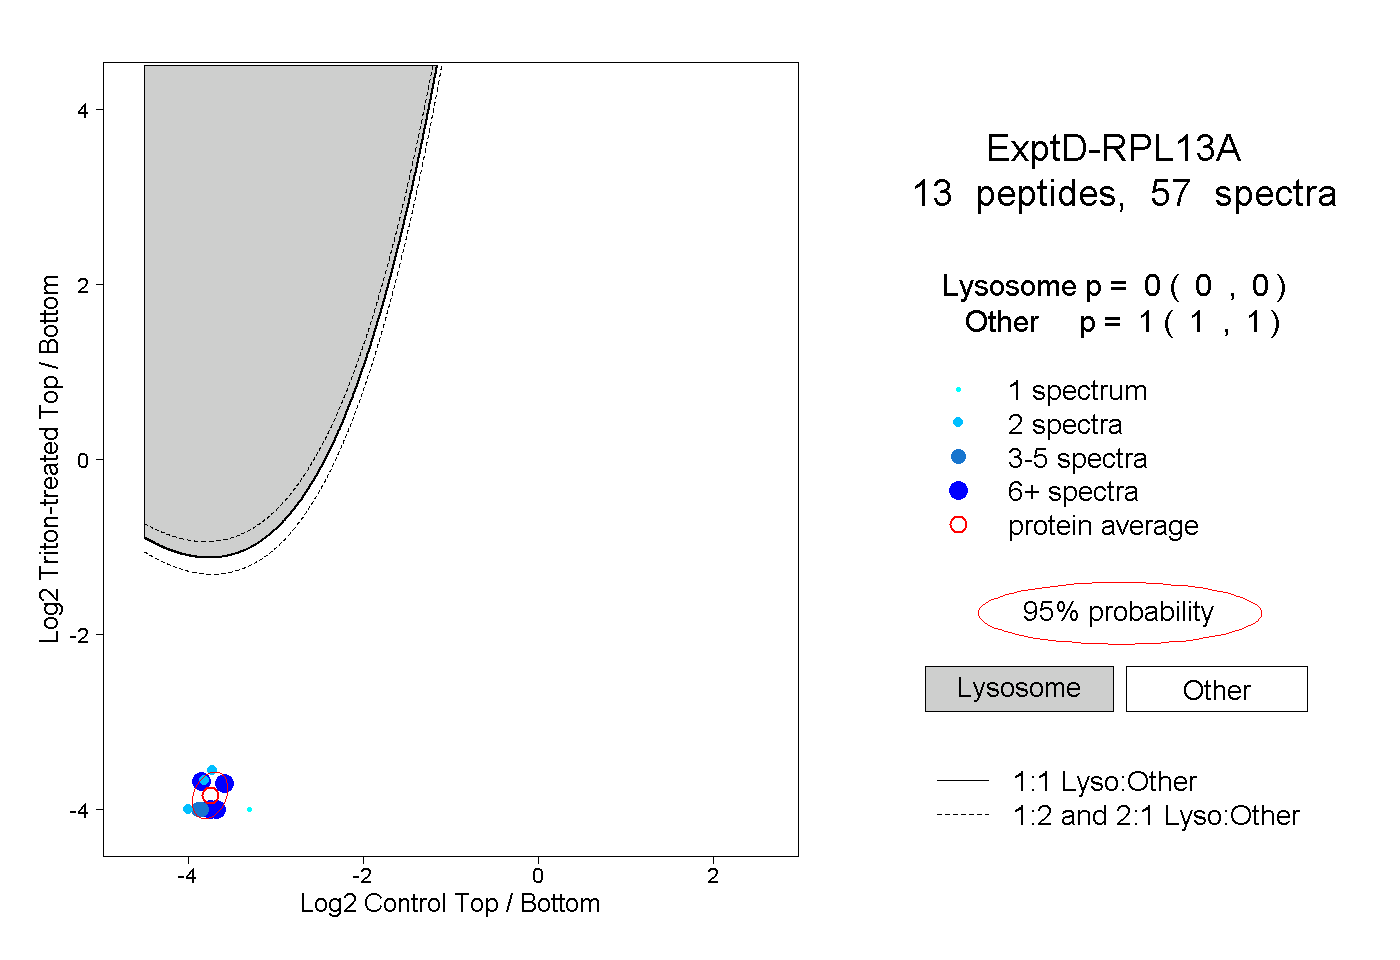
| Expt D |
13
peptides |
57
spectra |
 |
|
0.000
0.000 | 0.000 |
|
|
|
|
|
|
|
1.000
1.000 | 1.000 |