RPL13A
[ENSRNOP00000027976]
Main page
| | | Plot |
Mito |
Lyso |
|
Perox |
ER |
Golgi |
PM |
Cytosol |
Nucleus |
|
| Expt A |
 17
17
peptides |
280
spectra |
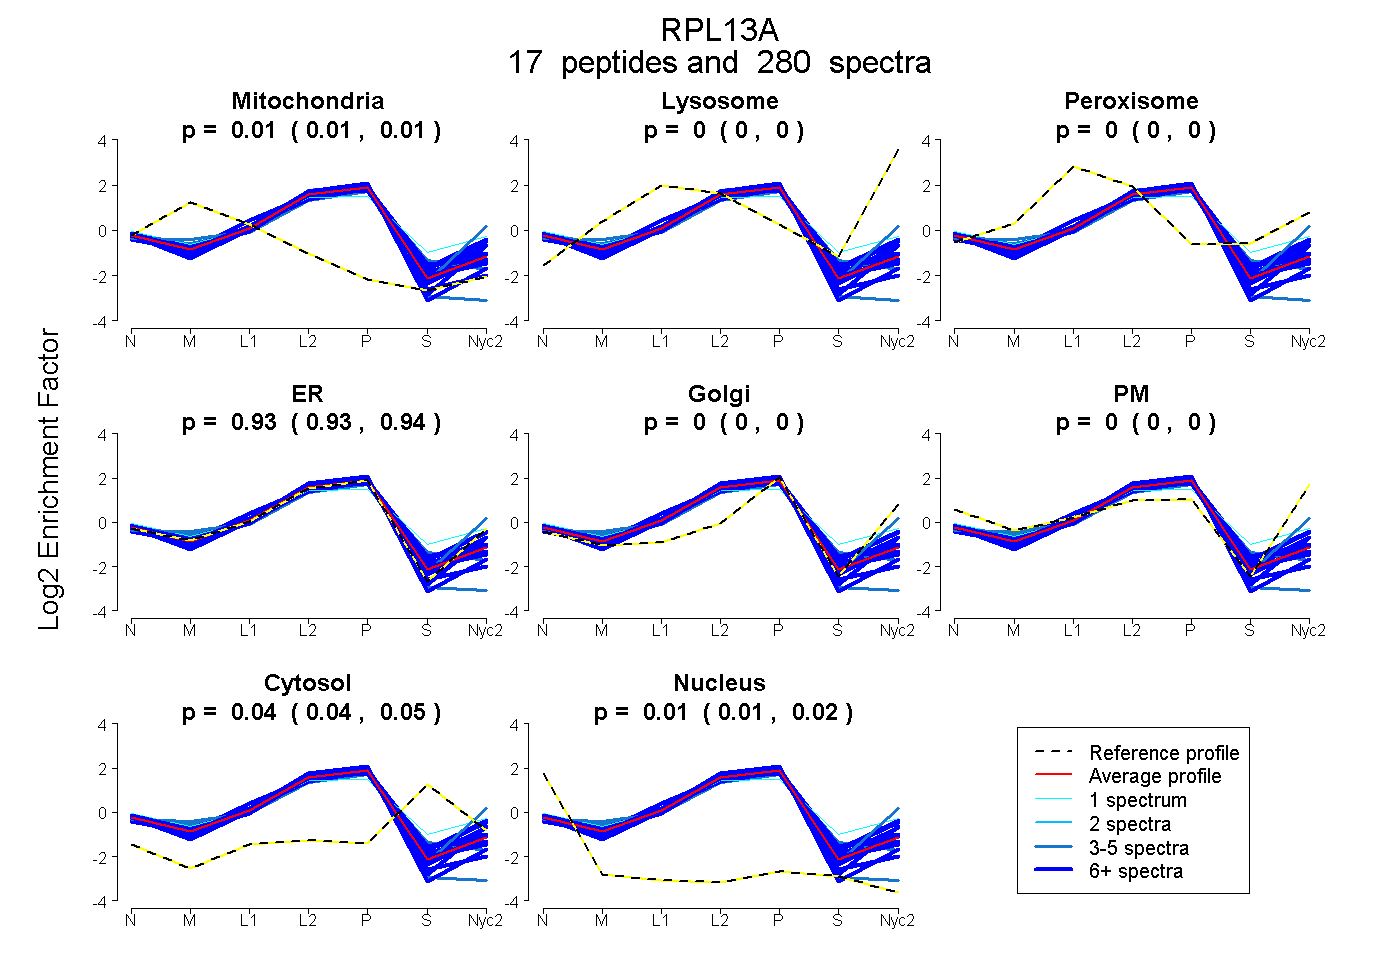 |
0.007
0.006 | 0.008 |
0.000
0.000 | 0.000 |
|
0.000
0.000 | 0.000 |
0.935
0.933 | 0.936 |
0.000
0.000 | 0.000 |
0.000
0.000 | 0.000 |
0.045
0.042 | 0.047 |
0.014
0.012 | 0.016 |
|
| | | Plot |
Mito |
|
Lyso or Perox |
|
ER |
Golgi |
PM |
Cytosol |
Nucleus |
|
| Expt B |
16
peptides |
118
spectra |
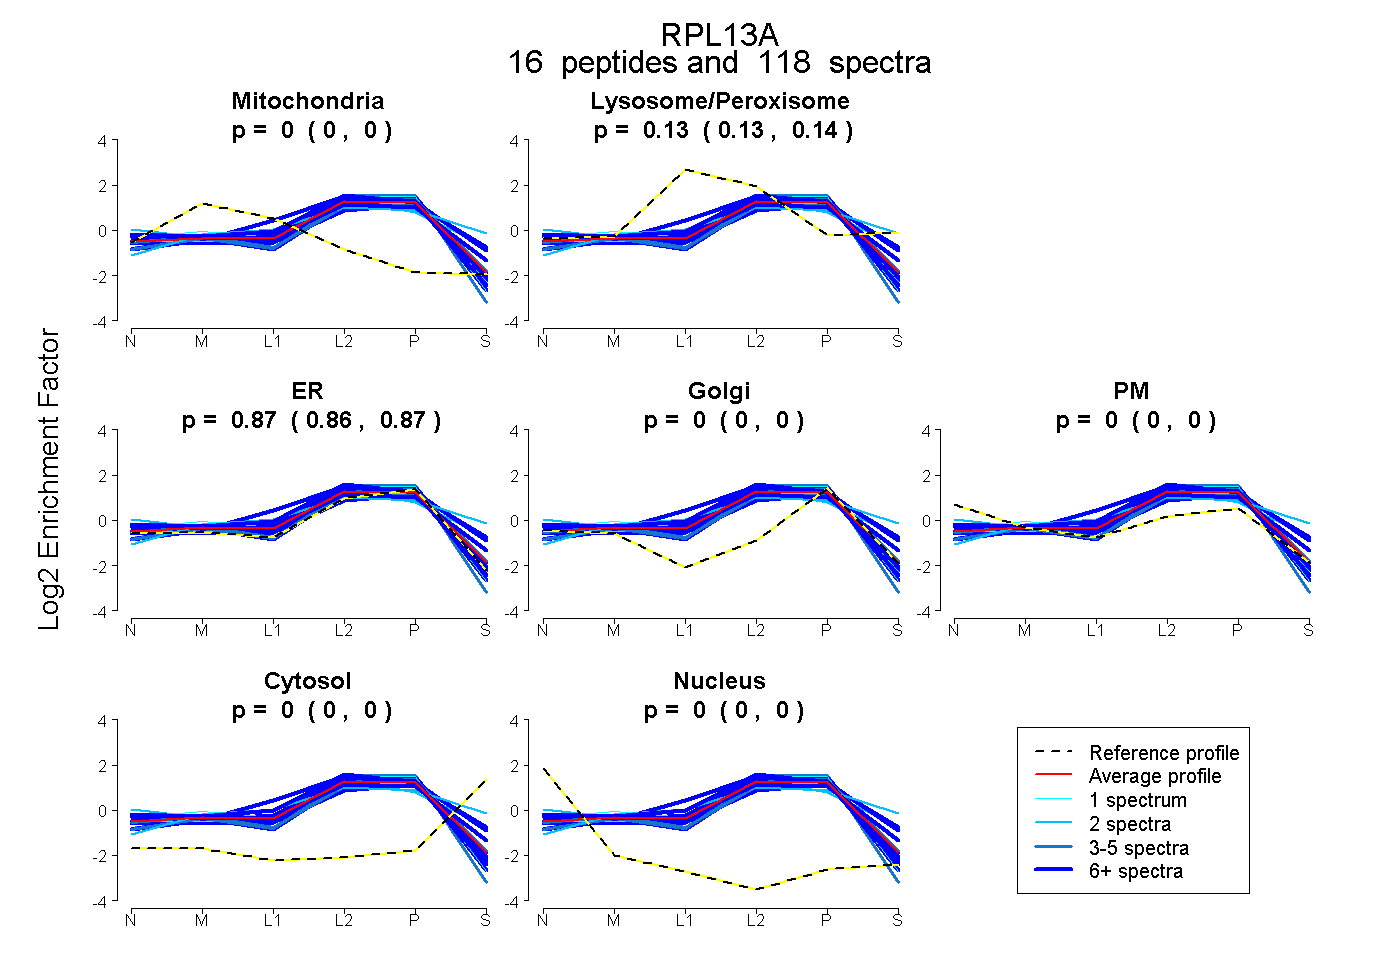 |
0.000
0.000 | 0.000 |
|
0.133
0.128 | 0.136 |
|
0.867
0.863 | 0.872 |
0.000
0.000 | 0.000 |
0.000
0.000 | 0.000 |
0.000
0.000 | 0.000 |
0.000
0.000 | 0.000 |
|
| 6 spectra, GQAALER |
0.000 |
|
0.218 |
|
0.552 |
0.118 |
0.000 |
0.111 |
0.000 |
|
| 7 spectra, GMLPHK |
0.000 |
|
0.000 |
|
1.000 |
0.000 |
0.000 |
0.000 |
0.000 |
|
| 5 spectra, MVVPAALK |
0.049 |
|
0.000 |
|
0.951 |
0.000 |
0.000 |
0.000 |
0.000 |
|
| 16 spectra, FAYLGR |
0.000 |
|
0.093 |
|
0.907 |
0.000 |
0.000 |
0.000 |
0.000 |
|
| 5 spectra, MNTNPSR |
0.000 |
|
0.040 |
|
0.941 |
0.000 |
0.000 |
0.020 |
0.000 |
|
| 17 spectra, GPYHFR |
0.016 |
|
0.098 |
|
0.851 |
0.021 |
0.014 |
0.000 |
0.000 |
|
| 7 spectra, LAHEVGWK |
0.000 |
|
0.374 |
|
0.612 |
0.000 |
0.000 |
0.014 |
0.000 |
|
| 6 spectra, YQAVTATLEEK |
0.000 |
|
0.180 |
|
0.628 |
0.000 |
0.164 |
0.027 |
0.000 |
|
| 1 spectrum, LKPTR |
0.000 |
|
0.031 |
|
0.969 |
0.000 |
0.000 |
0.000 |
0.000 |
|
| 5 spectra, GHILGR |
0.000 |
|
0.000 |
|
1.000 |
0.000 |
0.000 |
0.000 |
0.000 |
|
| 2 spectra, CEGINISGNFYR |
0.000 |
|
0.265 |
|
0.416 |
0.000 |
0.253 |
0.065 |
0.000 |
|
| 7 spectra, LAAIVAK |
0.000 |
|
0.071 |
|
0.929 |
0.000 |
0.000 |
0.000 |
0.000 |
|
| 1 spectrum, VLDGIPPPYDK |
0.039 |
|
0.083 |
|
0.839 |
0.000 |
0.039 |
0.000 |
0.000 |
|
| 25 spectra, YLAFLR |
0.000 |
|
0.153 |
|
0.847 |
0.000 |
0.000 |
0.000 |
0.000 |
|
| 2 spectra, TNGLLV |
0.000 |
|
0.359 |
|
0.465 |
0.000 |
0.000 |
0.176 |
0.000 |
|
| 6 spectra, QVLLGR |
0.000 |
|
0.116 |
|
0.865 |
0.000 |
0.019 |
0.000 |
0.000 |
|
| | | Plot |
|
Lyso |
|
|
|
|
|
|
|
Other |
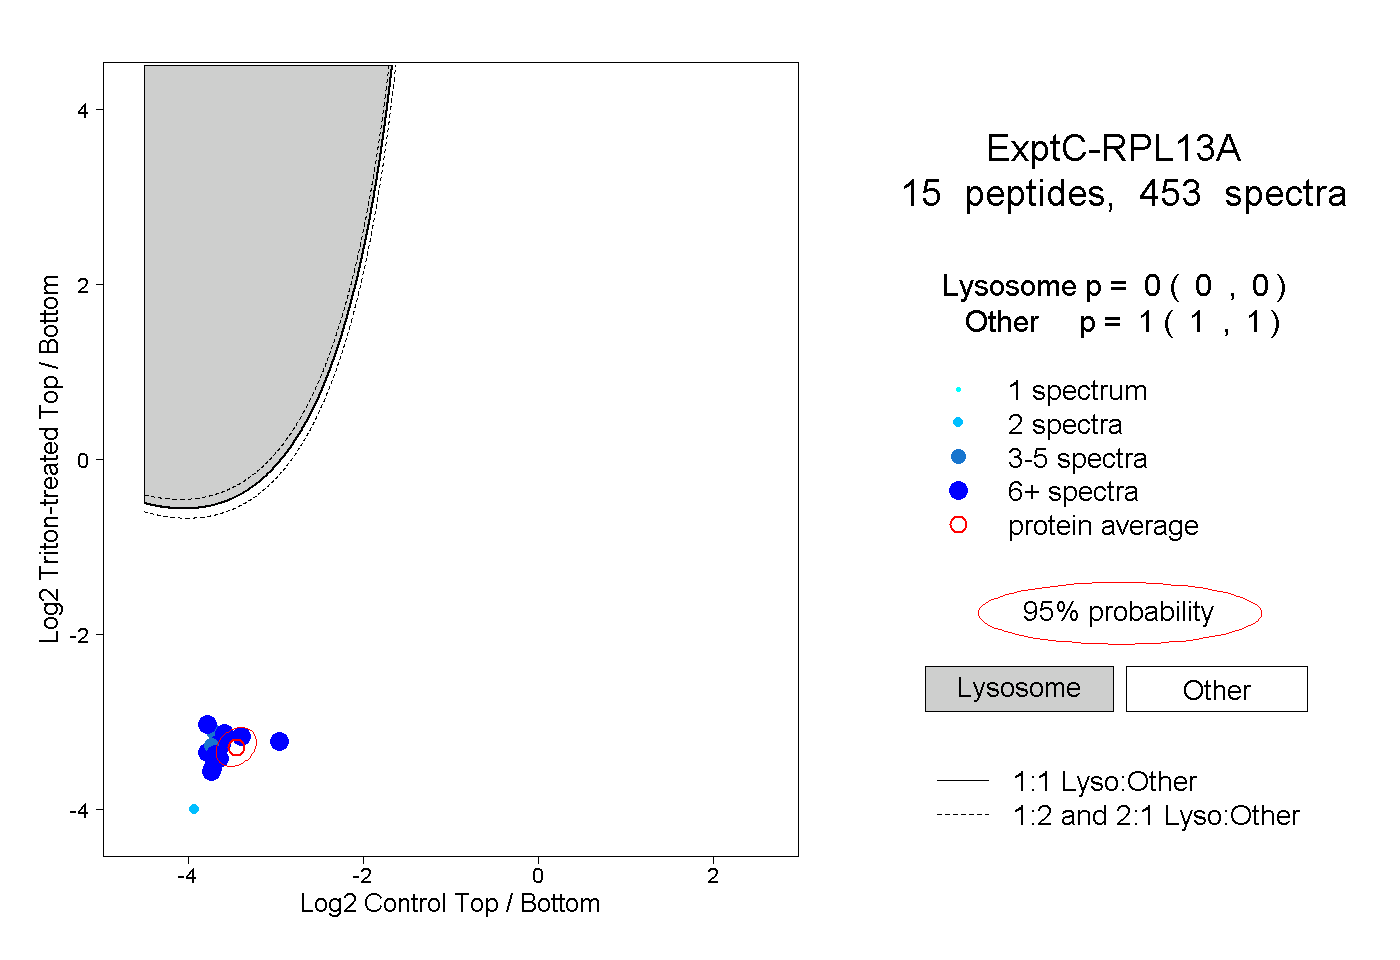
| Expt C |
15
peptides |
453
spectra |
 |
|
0.000
0.000 | 0.000 |
|
|
|
|
|
|
|
1.000
1.000 | 1.000 |
| | | Plot |
|
Lyso |
|
|
|
|
|
|
|
Other |
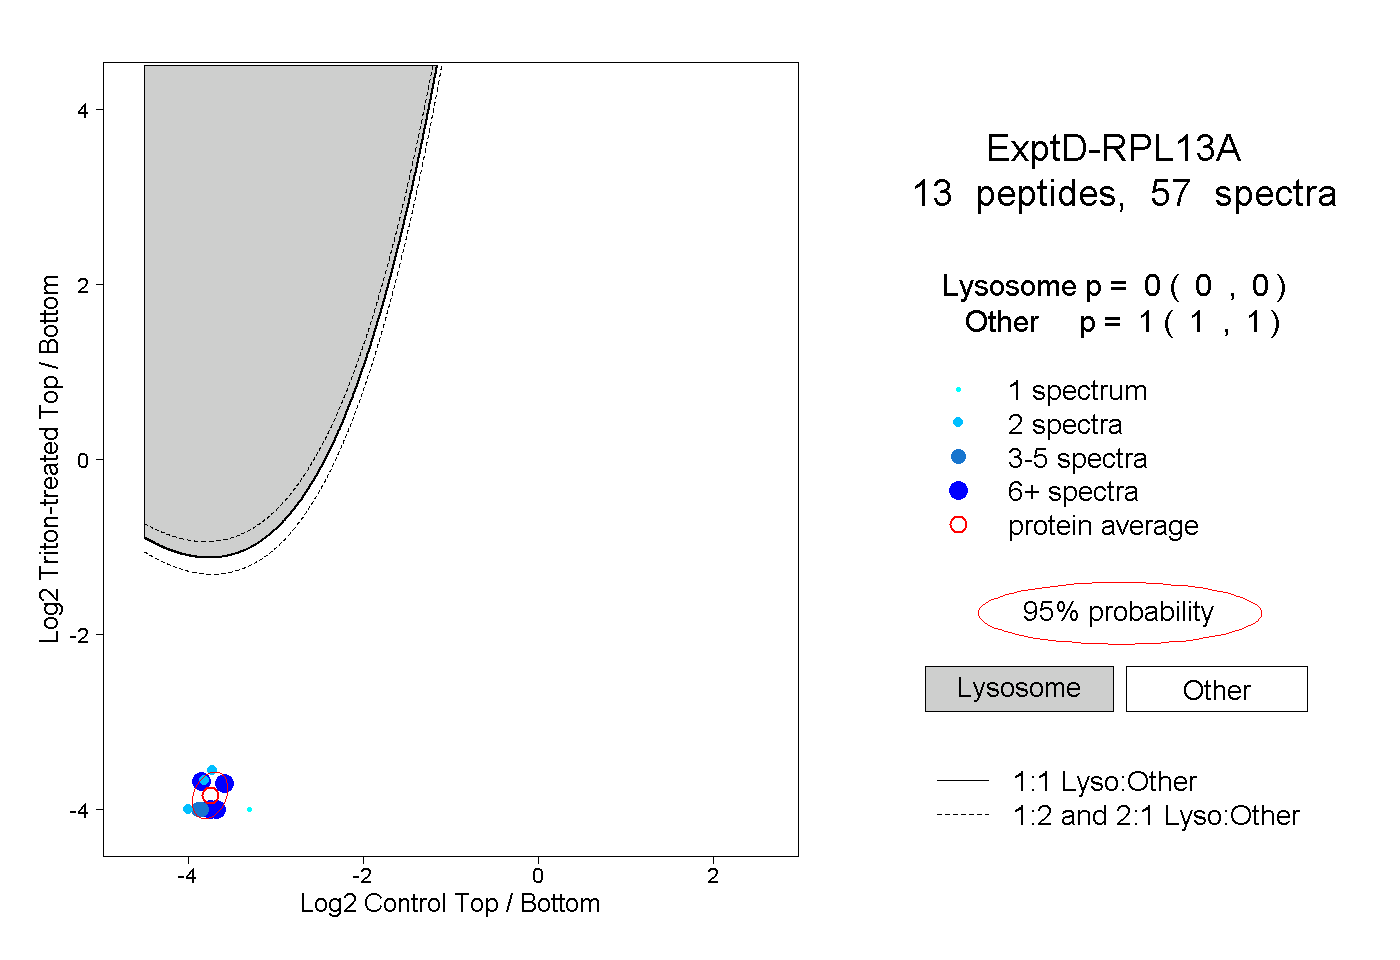
| Expt D |
13
peptides |
57
spectra |
 |
|
0.000
0.000 | 0.000 |
|
|
|
|
|
|
|
1.000
1.000 | 1.000 |