 17
17peptides
spectra
0.006 | 0.008
0.000 | 0.000
0.000 | 0.000
0.933 | 0.936
0.000 | 0.000
0.000 | 0.000
0.042 | 0.047
0.012 | 0.016
| Plot | Mito | Lyso | Perox | ER | Golgi | PM | Cytosol | Nucleus | |||||
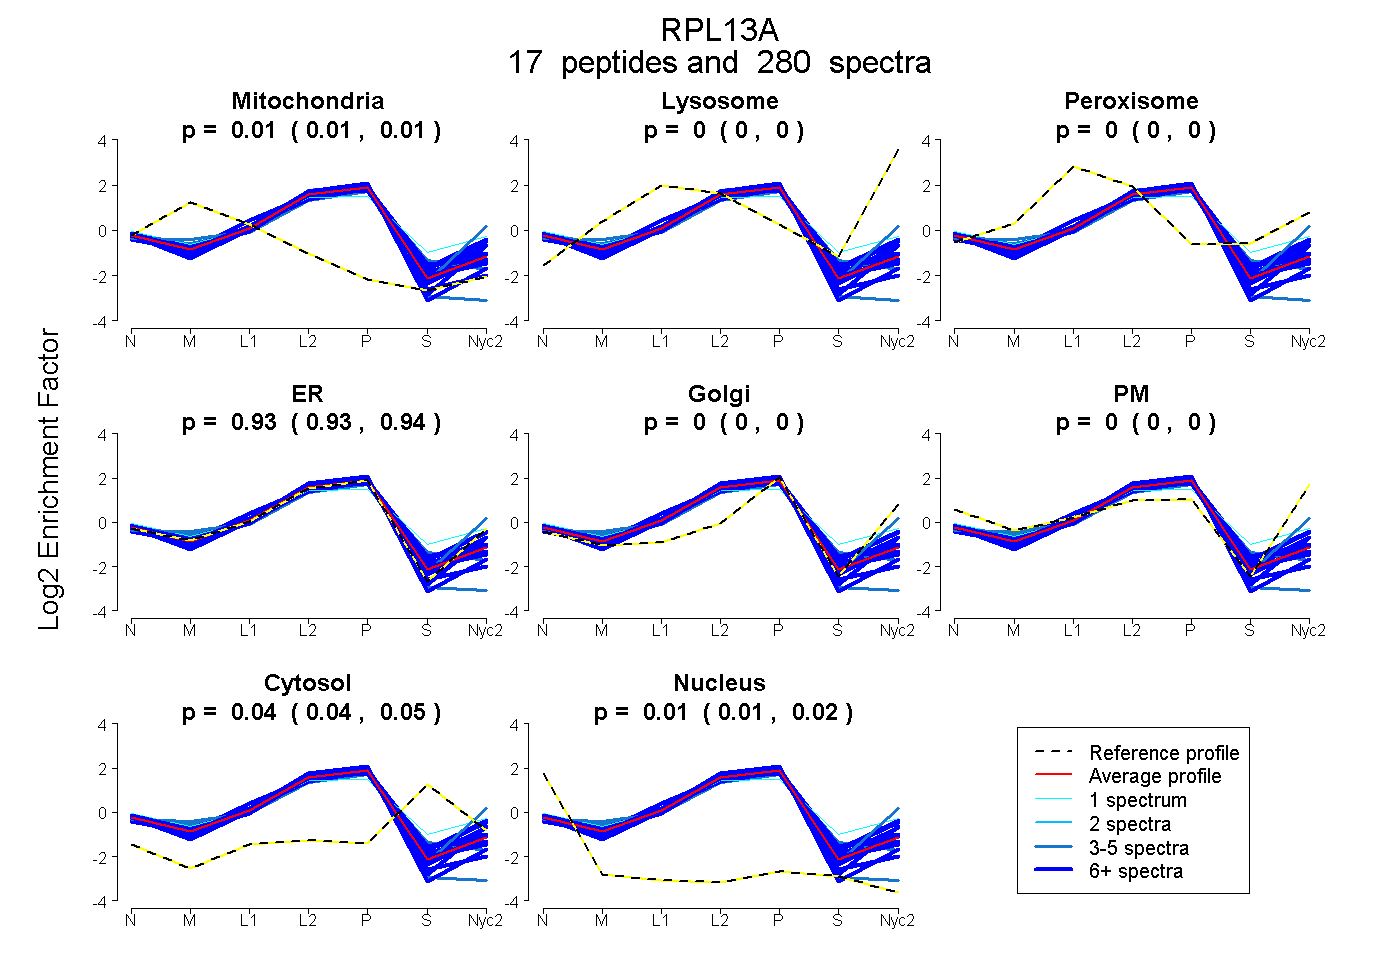
| Expt A |
17 peptides |
280 spectra |
|
0.007 0.006 | 0.008 |
0.000 0.000 | 0.000 |
0.000 0.000 | 0.000 |
0.935 0.933 | 0.936 |
0.000 0.000 | 0.000 |
0.000 0.000 | 0.000 |
0.045 0.042 | 0.047 |
0.014 0.012 | 0.016 |
| 9 spectra, GQAALER | 0.000 | 0.000 | 0.000 | 0.854 | 0.000 | 0.000 | 0.146 | 0.000 | ||
| 48 spectra, GMLPHK | 0.000 | 0.000 | 0.089 | 0.815 | 0.000 | 0.000 | 0.096 | 0.000 | ||
| 5 spectra, MVVPAALK | 0.000 | 0.090 | 0.000 | 0.811 | 0.059 | 0.035 | 0.006 | 0.000 | ||
| 3 spectra, GHLLGR | 0.059 | 0.000 | 0.000 | 0.795 | 0.000 | 0.000 | 0.147 | 0.000 | ||
| 33 spectra, FAYLGR | 0.034 | 0.000 | 0.000 | 0.940 | 0.000 | 0.000 | 0.008 | 0.018 | ||
| 45 spectra, MNTNPSR | 0.000 | 0.000 | 0.000 | 0.961 | 0.000 | 0.000 | 0.000 | 0.039 | ||
| 31 spectra, GPYHFR | 0.000 | 0.000 | 0.043 | 0.856 | 0.000 | 0.000 | 0.101 | 0.000 | ||
| 9 spectra, LAHEVGWK | 0.000 | 0.000 | 0.042 | 0.894 | 0.000 | 0.000 | 0.065 | 0.000 | ||
| 8 spectra, FTEVLK | 0.000 | 0.000 | 0.000 | 0.913 | 0.000 | 0.000 | 0.087 | 0.000 | ||
| 11 spectra, YQAVTATLEEK | 0.021 | 0.000 | 0.000 | 0.901 | 0.000 | 0.000 | 0.039 | 0.039 | ||
| 1 spectrum, LKPTR | 0.000 | 0.000 | 0.159 | 0.693 | 0.000 | 0.000 | 0.148 | 0.000 | ||
| 7 spectra, AEGQVLVLDGR | 0.000 | 0.000 | 0.066 | 0.846 | 0.000 | 0.000 | 0.088 | 0.000 | ||
| 5 spectra, CEGINISGNFYR | 0.000 | 0.000 | 0.000 | 0.881 | 0.000 | 0.000 | 0.000 | 0.119 | ||
| 18 spectra, LAAIVAK | 0.047 | 0.000 | 0.000 | 0.907 | 0.000 | 0.000 | 0.000 | 0.046 | ||
| 6 spectra, VLDGIPPPYDK | 0.000 | 0.000 | 0.000 | 0.954 | 0.000 | 0.000 | 0.028 | 0.017 | ||
| 24 spectra, YLAFLR | 0.000 | 0.000 | 0.000 | 0.999 | 0.000 | 0.000 | 0.000 | 0.001 | ||
| 17 spectra, QVLLGR | 0.000 | 0.000 | 0.000 | 0.929 | 0.000 | 0.000 | 0.049 | 0.022 |
| Plot | Mito | Lyso or Perox | ER | Golgi | PM | Cytosol | Nucleus | ||||||
| Expt B |
16 peptides |
118 spectra |
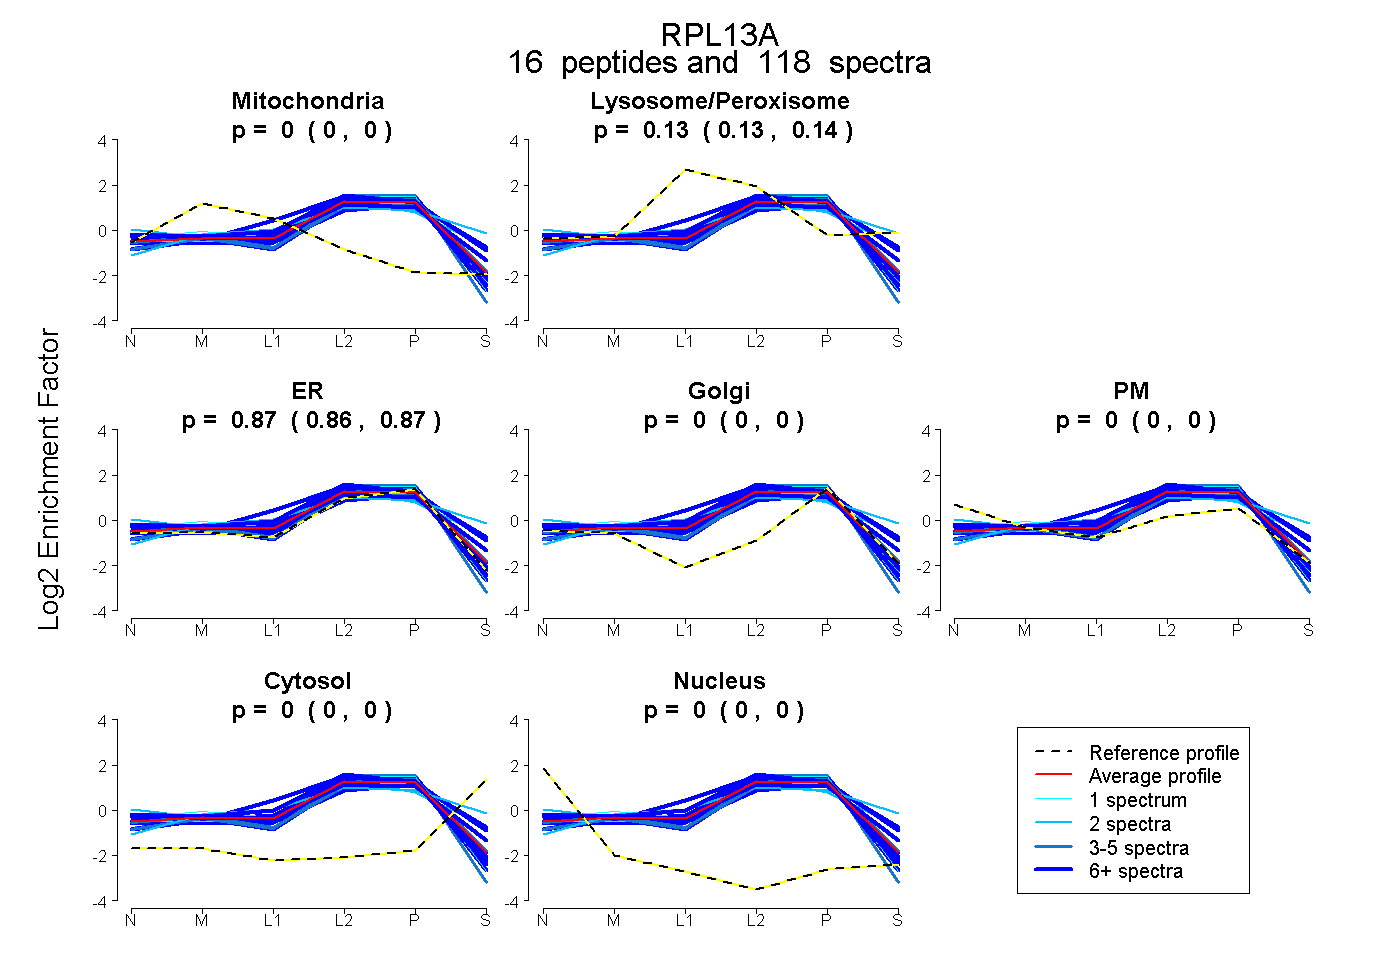 |
0.000 0.000 | 0.000 |
0.133 0.128 | 0.136 |
0.867 0.863 | 0.872 |
0.000 0.000 | 0.000 |
0.000 0.000 | 0.000 |
0.000 0.000 | 0.000 |
0.000 0.000 | 0.000 |
|||
| Plot | Lyso | Other | |||||||||||
| Expt C |
15 peptides |
453 spectra |
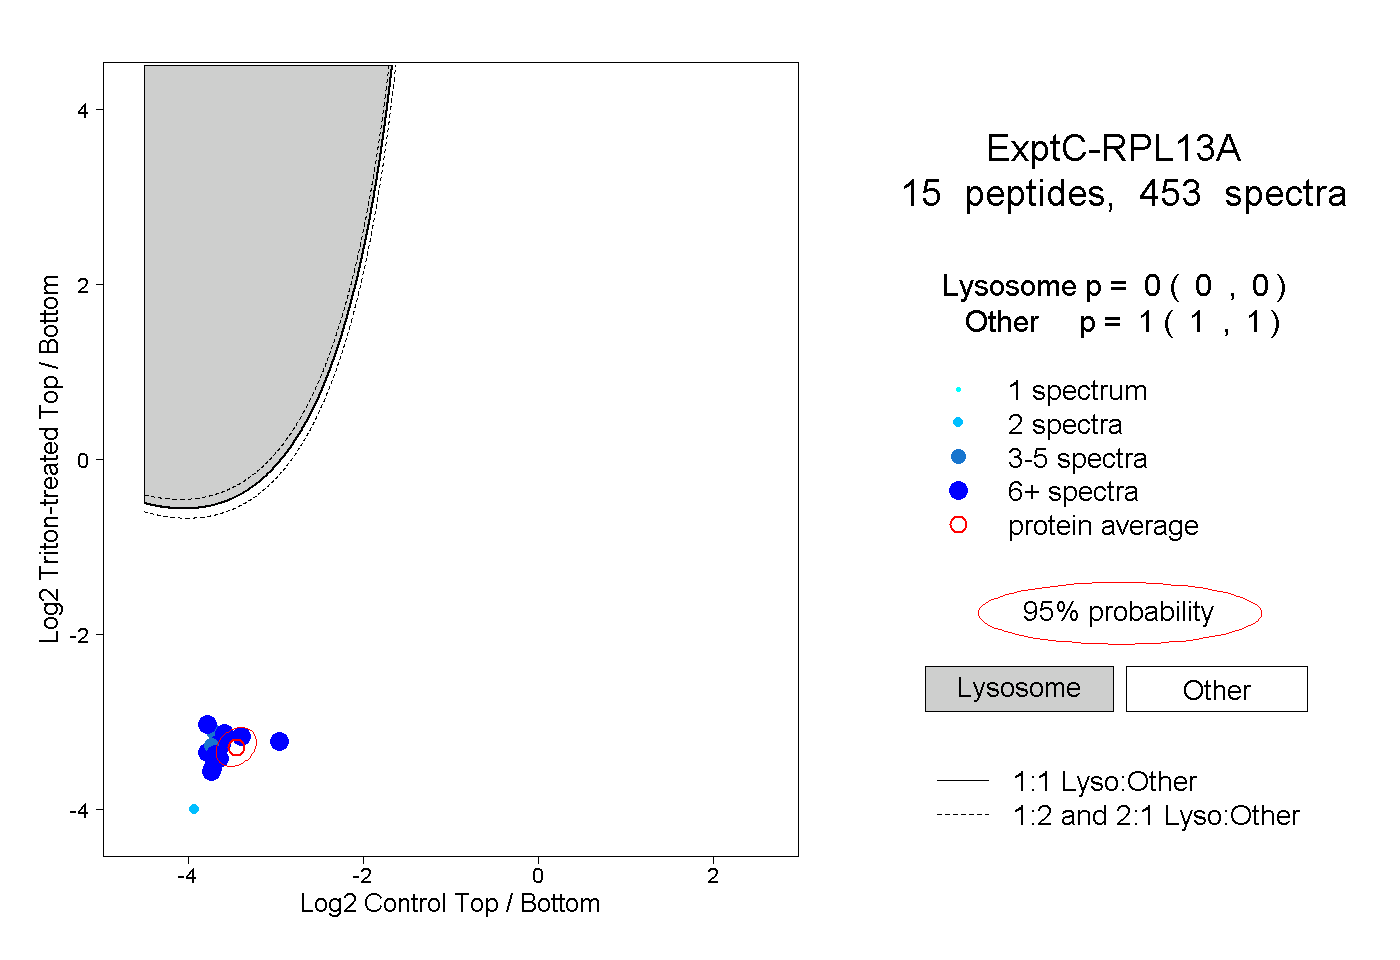 |
0.000 0.000 | 0.000 |
1.000 1.000 | 1.000 |
||||||||
| Plot | Lyso | Other | |||||||||||
| Expt D |
13 peptides |
57 spectra |
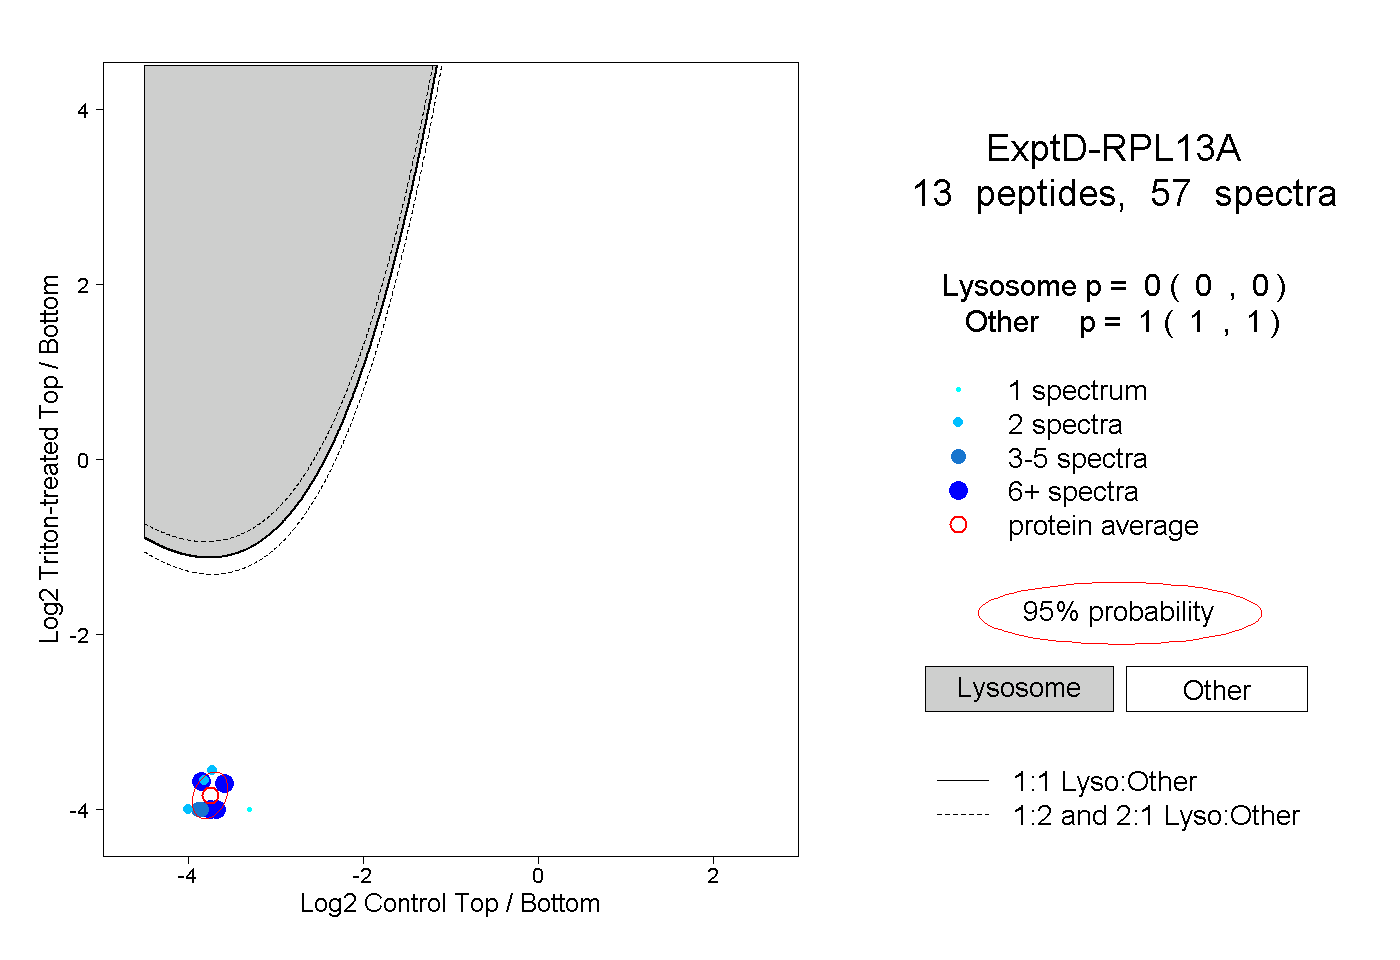 |
0.000 0.000 | 0.000 |
1.000 1.000 | 1.000 |