 25
25peptides
spectra
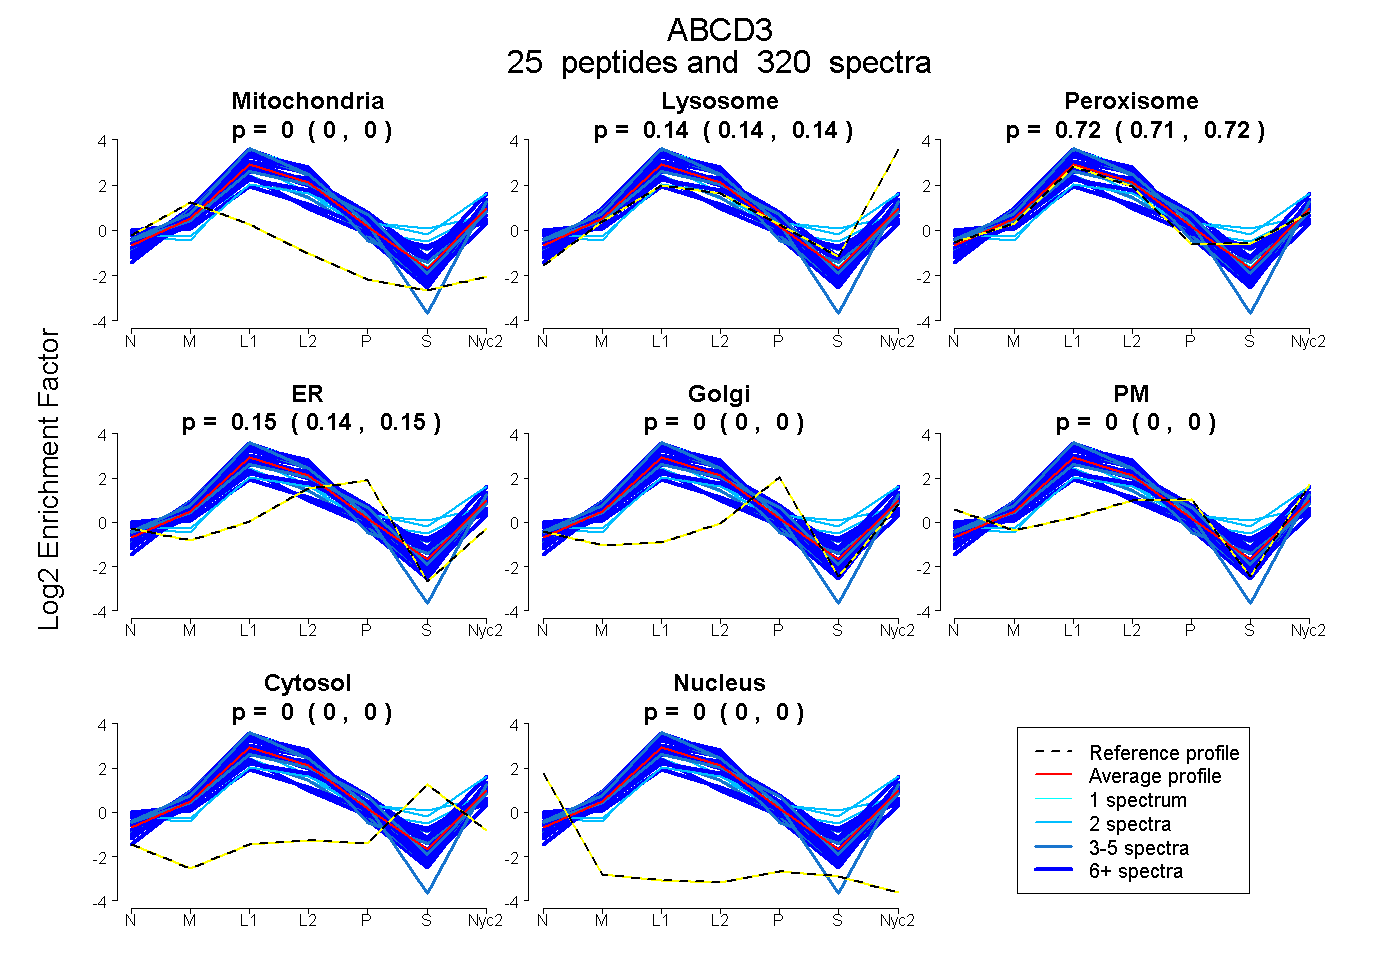
0.000 | 0.000
0.135 | 0.140
0.712 | 0.718
0.145 | 0.149
0.000 | 0.000
0.000 | 0.000
0.000 | 0.000
0.000 | 0.000
28peptides
spectra
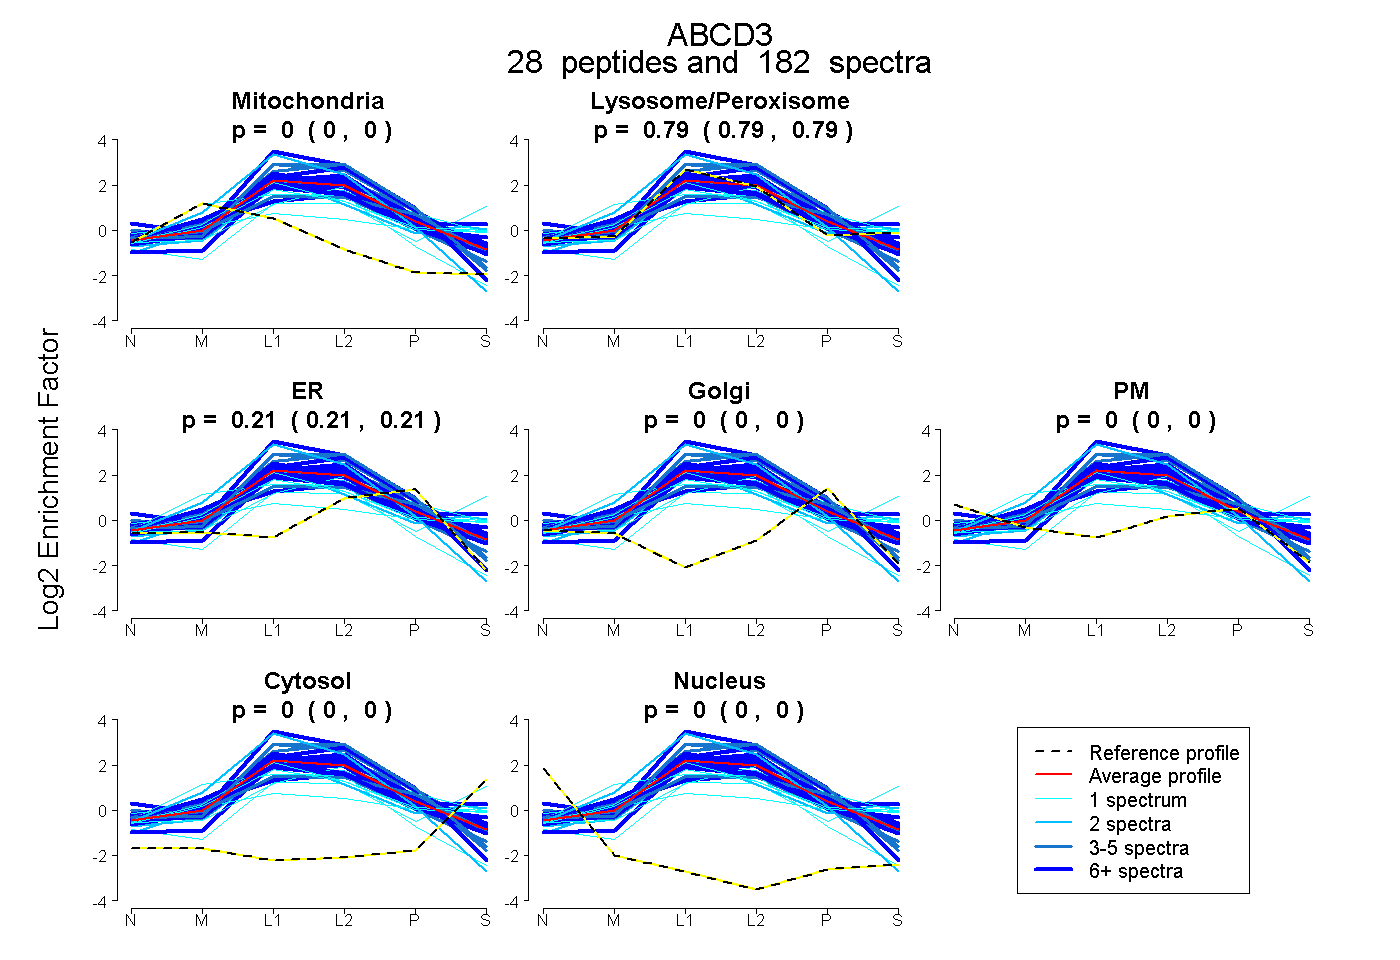
0.000 | 0.000
0.787 | 0.794
0.205 | 0.212
0.000 | 0.000
0.000 | 0.000
0.000 | 0.000
0.000 | 0.000
30peptides
spectra
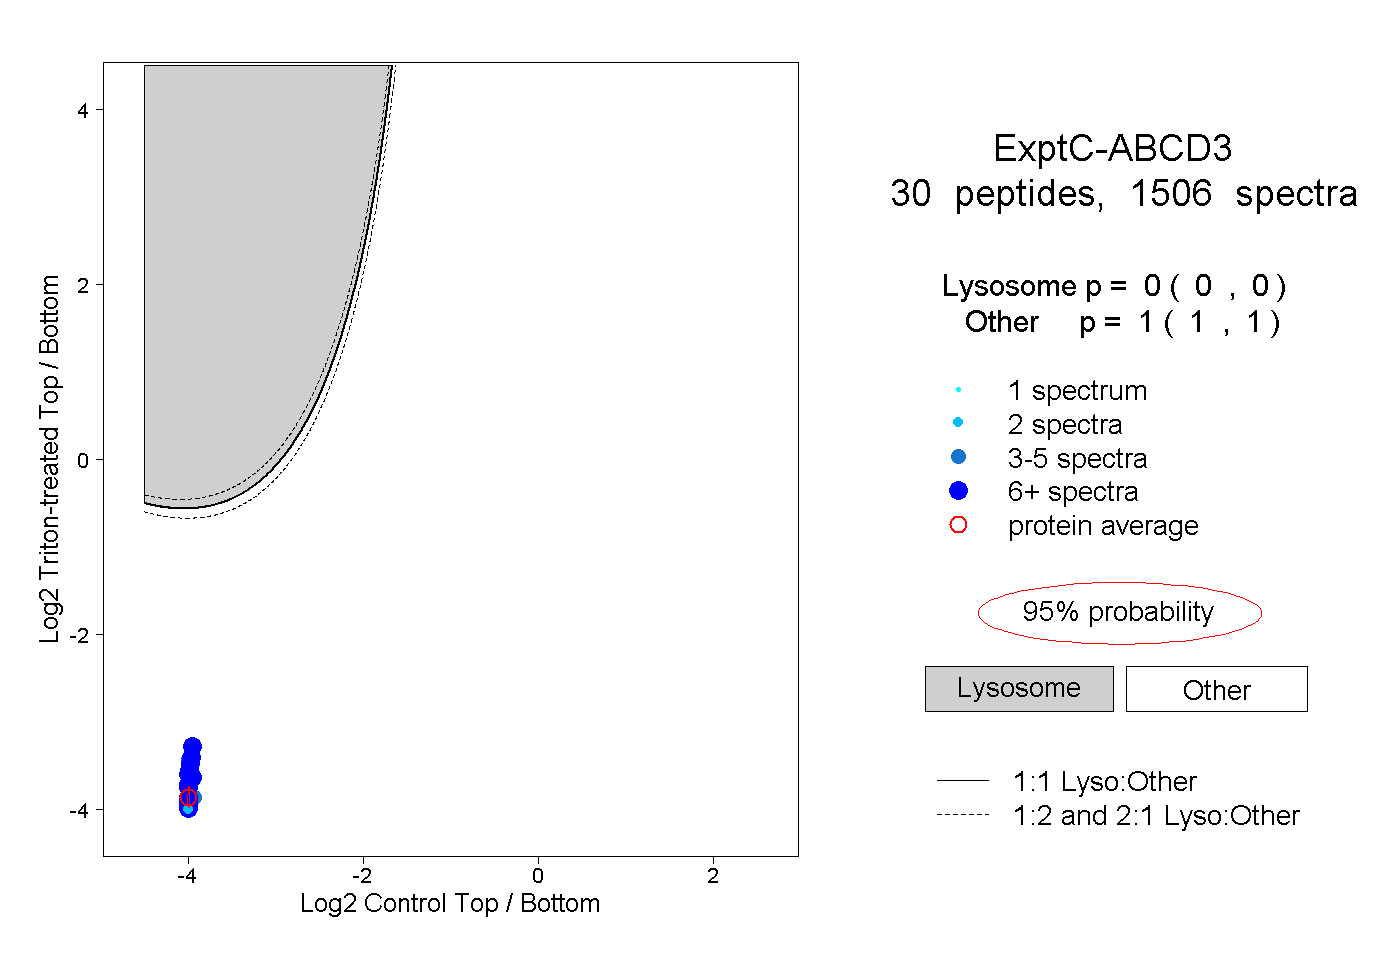
0.000 | 0.000
1.000 | 1.000
23peptides
spectra
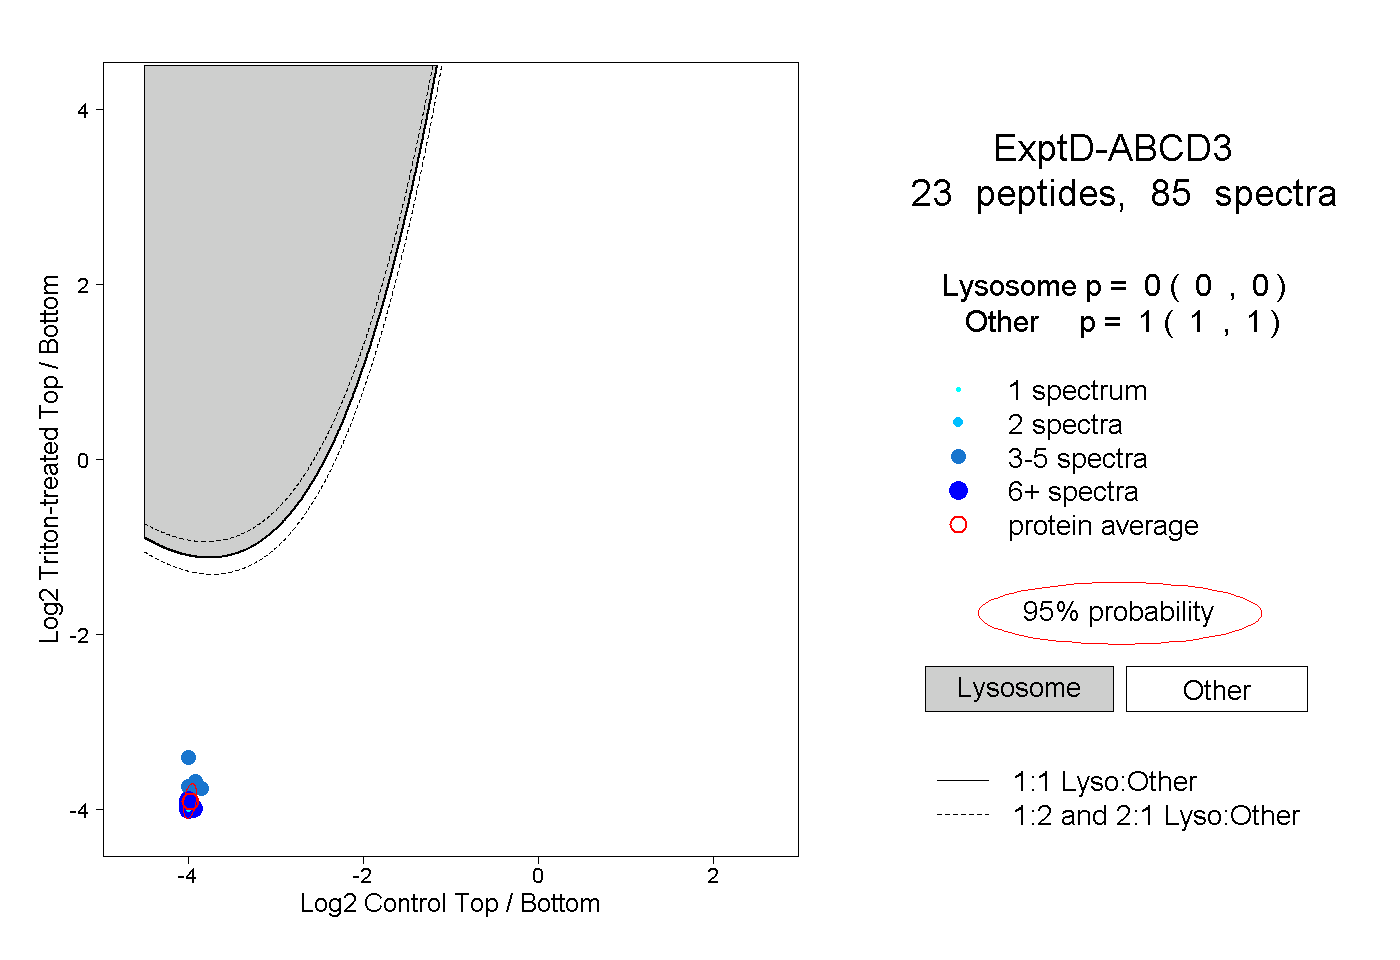
0.000 | 0.000
1.000 | 1.000