 20
20peptides
spectra
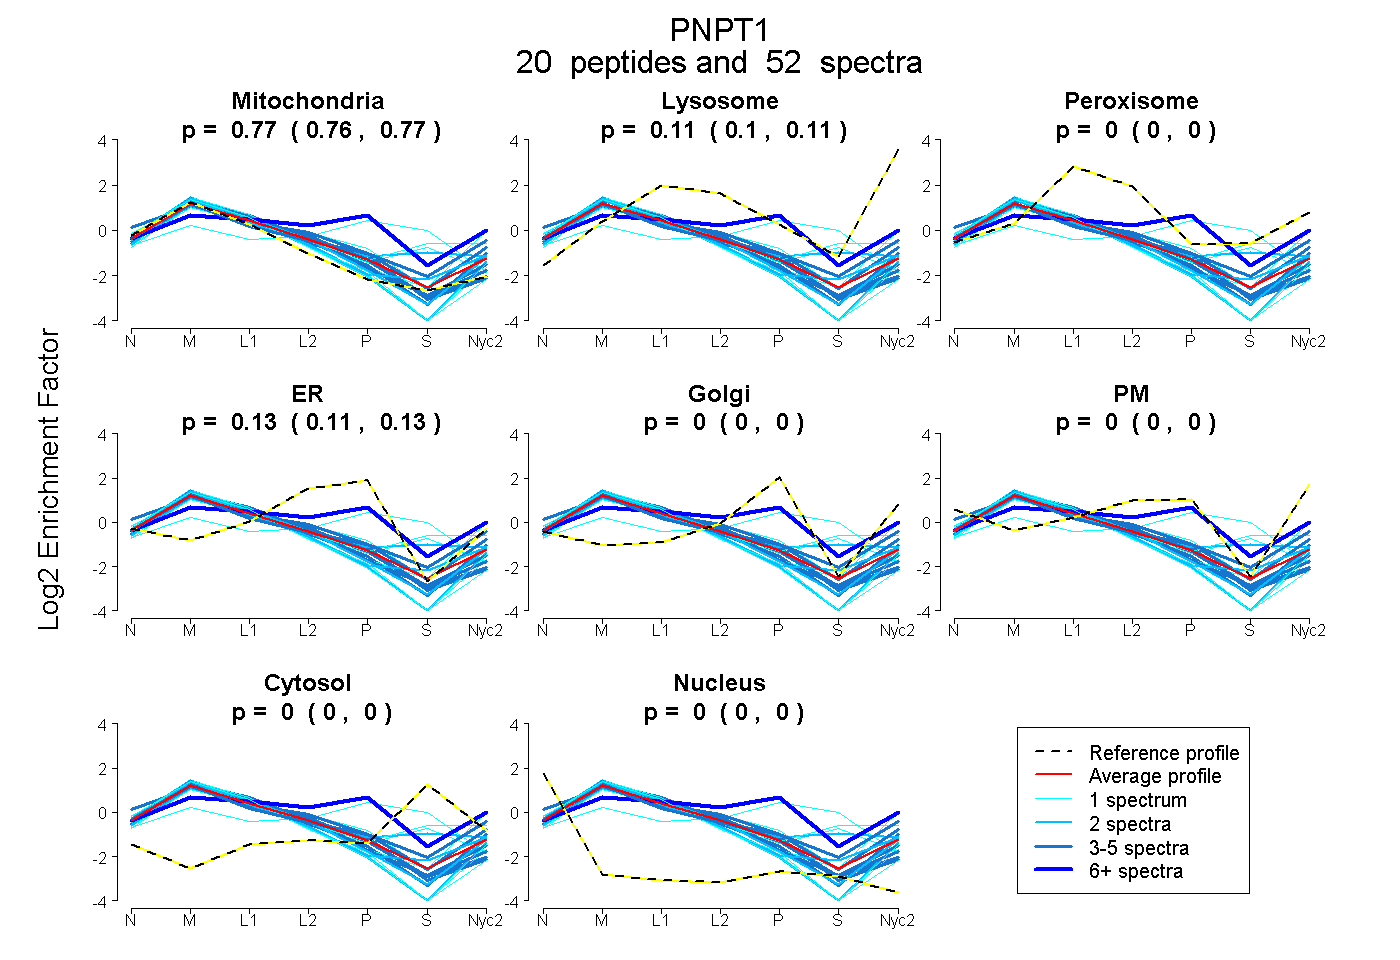
0.761 | 0.775
0.097 | 0.112
0.000 | 0.000
0.115 | 0.134
0.000 | 0.000
0.000 | 0.003
0.000 | 0.000
0.000 | 0.000
10peptides
spectra
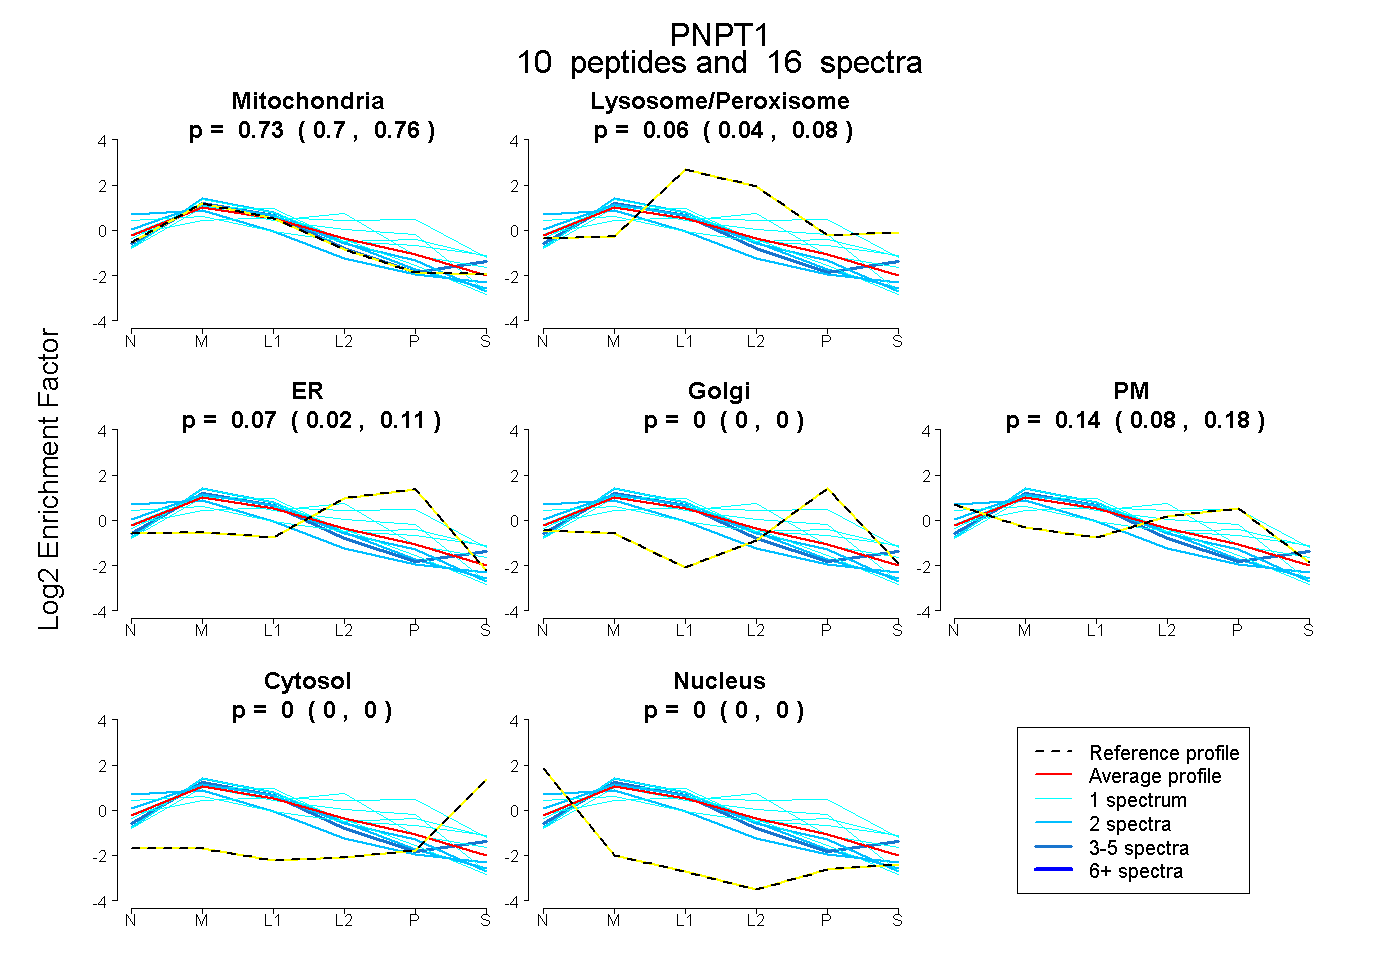
0.705 | 0.762
0.038 | 0.077
0.017 | 0.113
0.000 | 0.000
0.078 | 0.184
0.000 | 0.000
0.000 | 0.000
32peptides
spectra
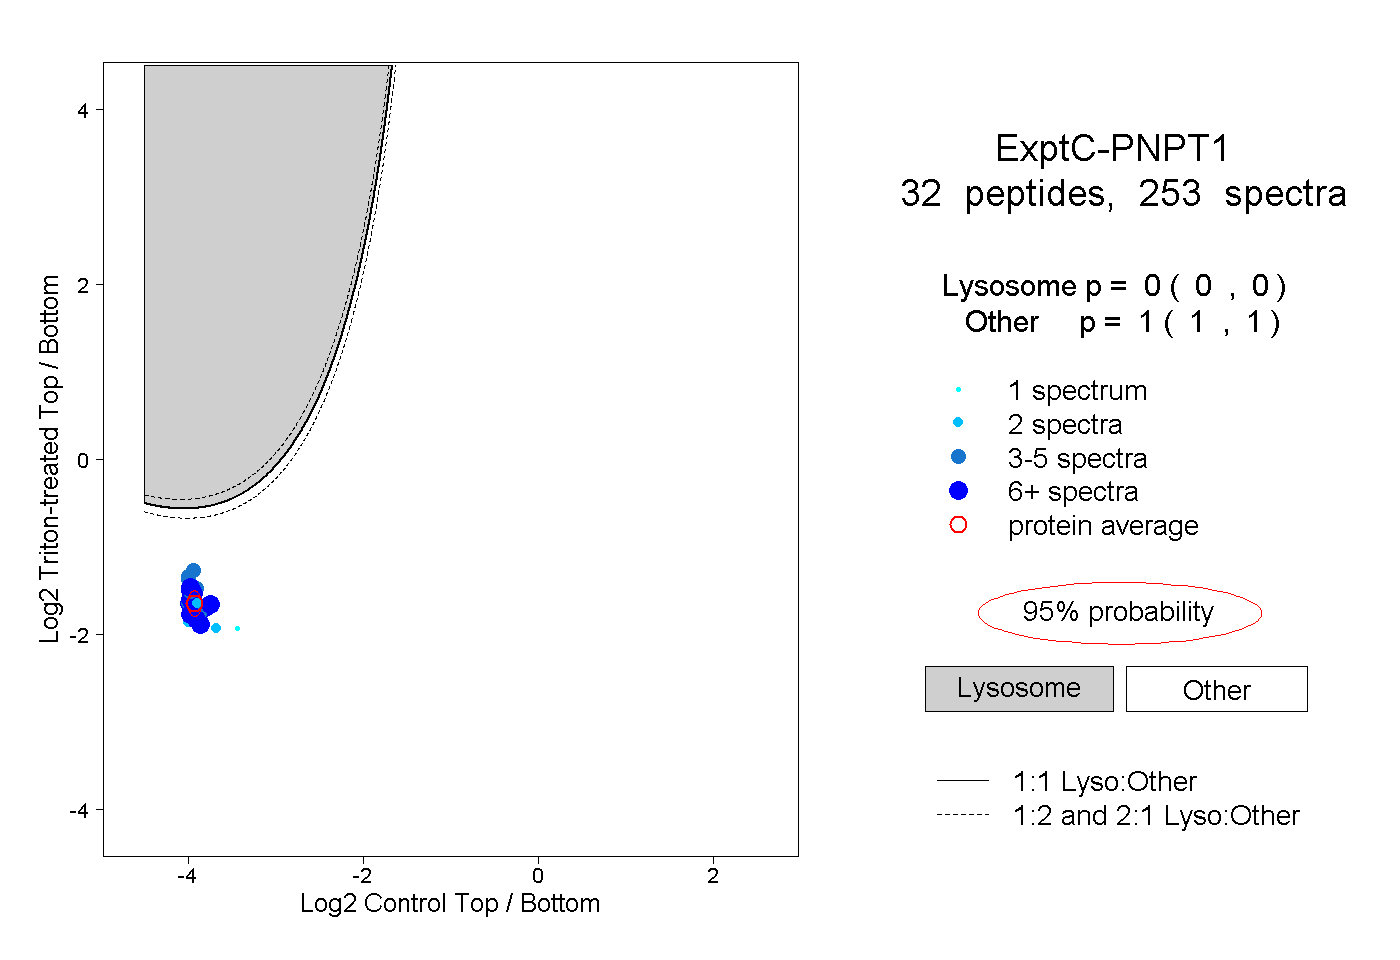
0.000 | 0.000
1.000 | 1.000
9peptides
spectra
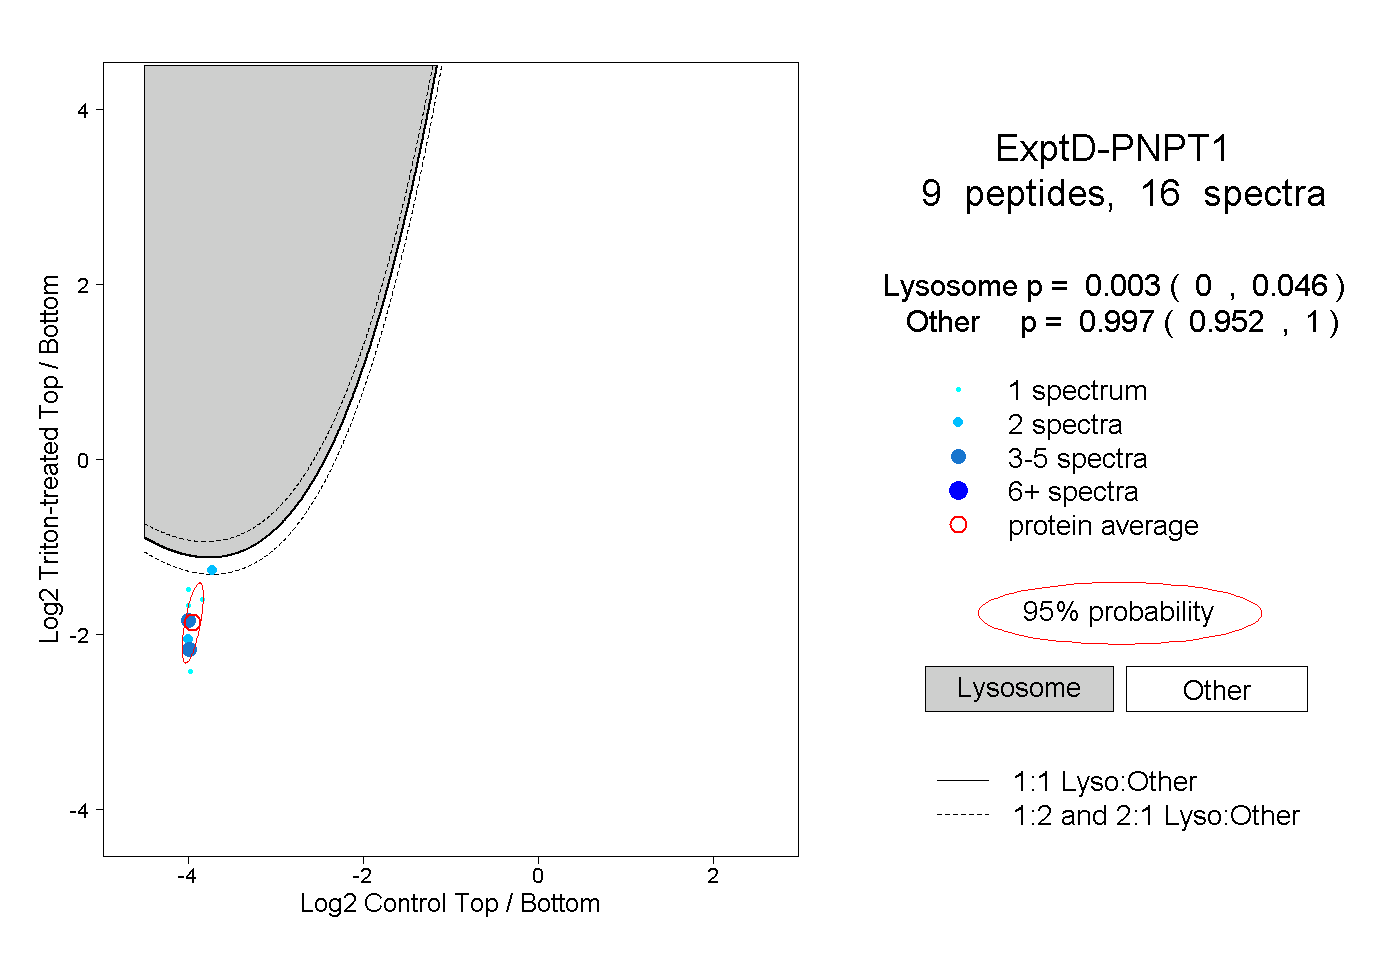
0.000 | 0.046
0.952 | 1.000