PNPT1
[ENSRNOP00000004919]
Main page
| | | Plot |
Mito |
Lyso |
|
Perox |
ER |
Golgi |
PM |
Cytosol |
Nucleus |
|
| Expt A |
 20
20
peptides |
52
spectra |
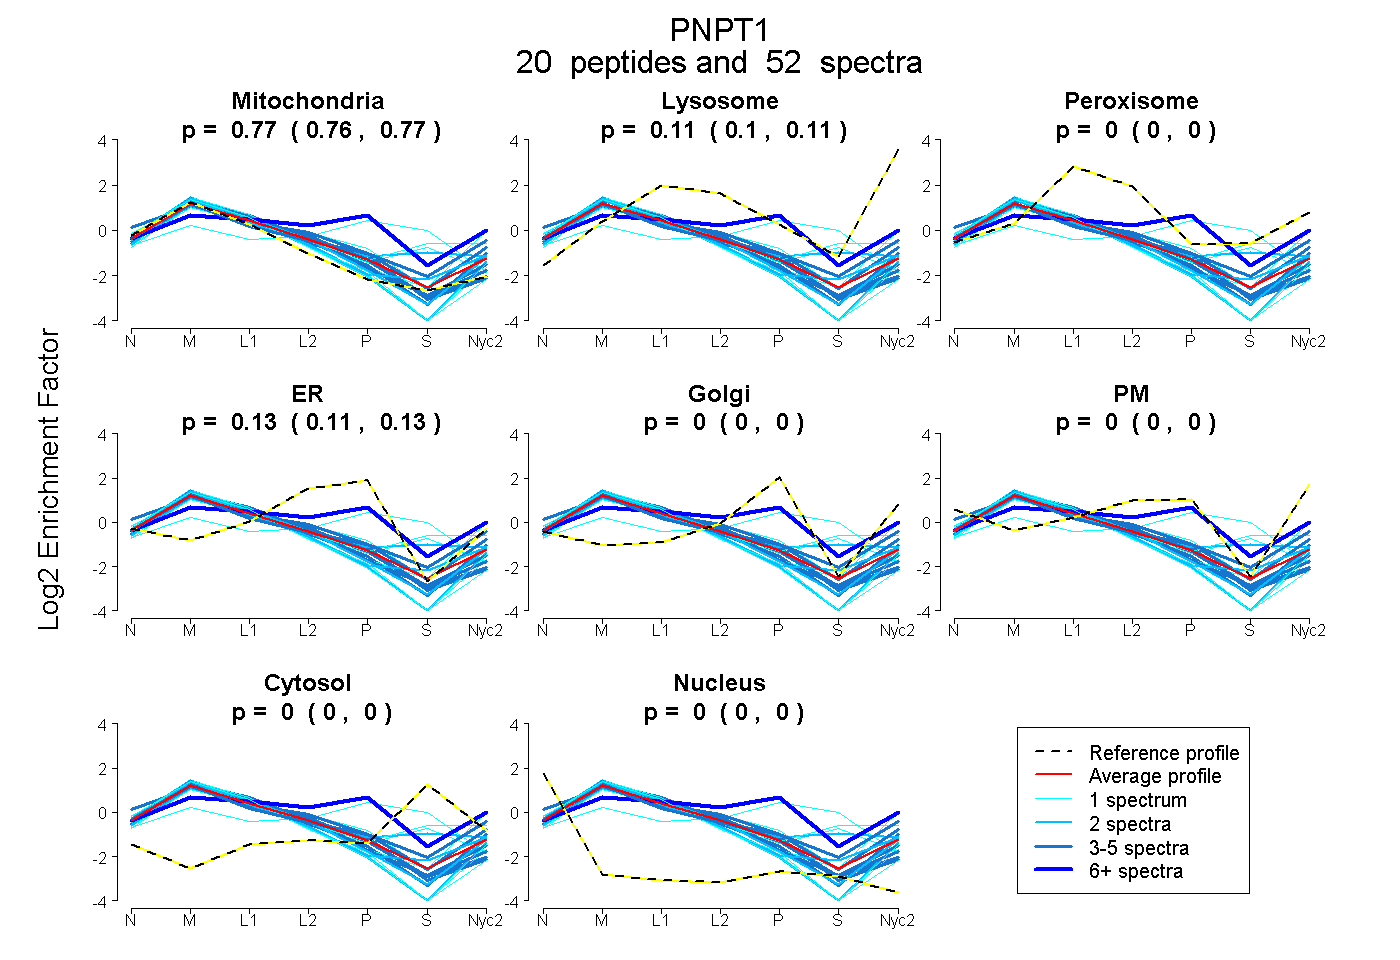 |
0.769
0.761 | 0.775 |
0.106
0.097 | 0.112 |
|
0.000
0.000 | 0.000 |
0.125
0.115 | 0.134 |
0.000
0.000 | 0.000 |
0.000
0.000 | 0.003 |
0.000
0.000 | 0.000 |
0.000
0.000 | 0.000 |
|
| | | Plot |
Mito |
|
Lyso or Perox |
|
ER |
Golgi |
PM |
Cytosol |
Nucleus |
|
| Expt B |
10
peptides |
16
spectra |
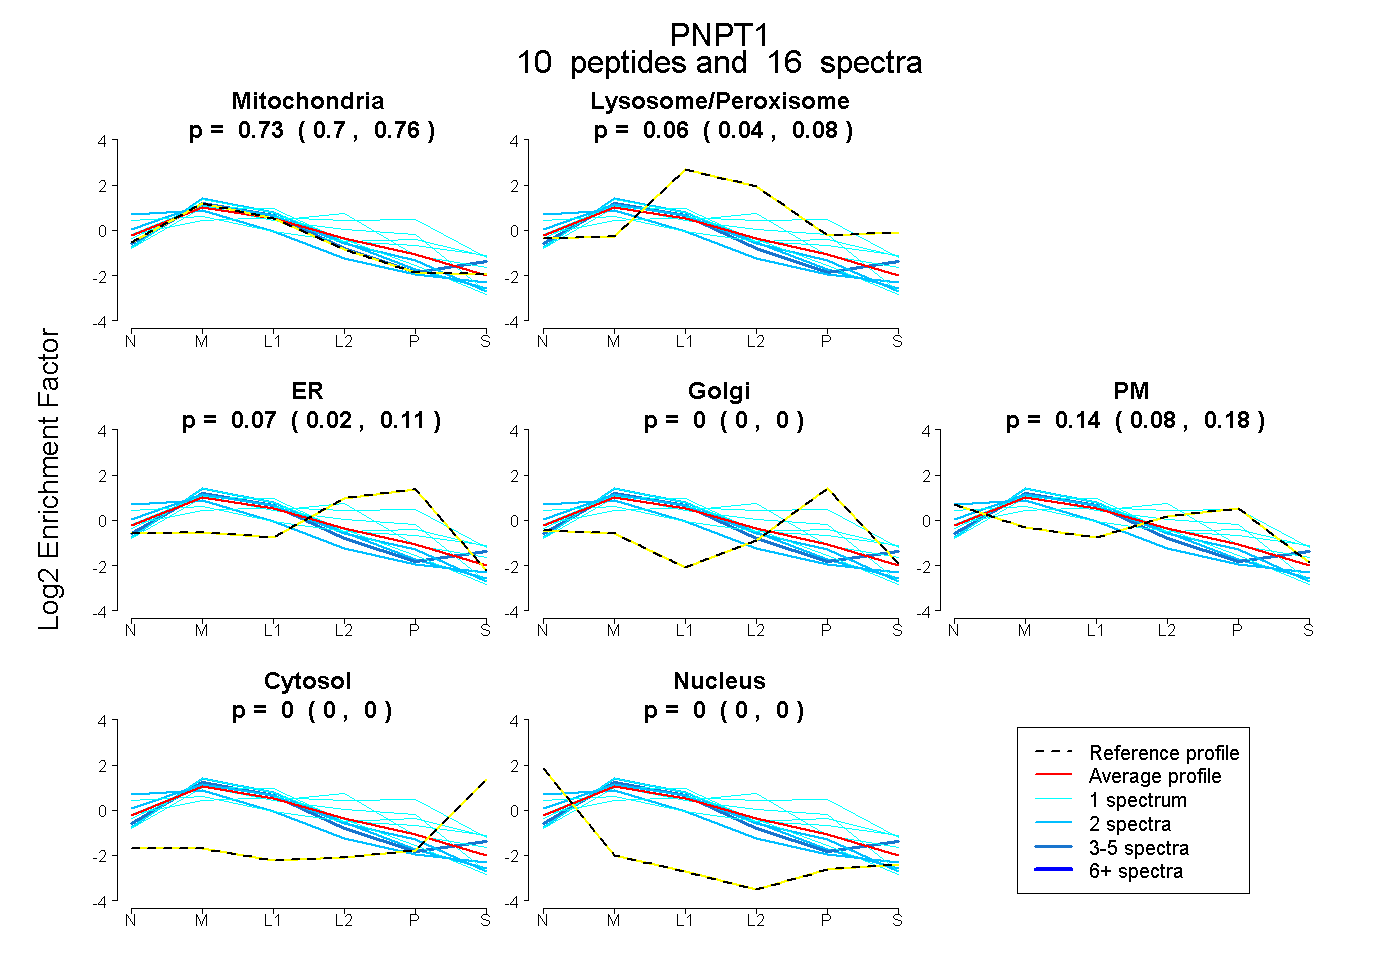 |
0.734
0.705 | 0.762 |
|
0.059
0.038 | 0.077 |
|
0.070
0.017 | 0.113 |
0.000
0.000 | 0.000 |
0.137
0.078 | 0.184 |
0.000
0.000 | 0.000 |
0.000
0.000 | 0.000 |
|
| | | Plot |
|
Lyso |
|
|
|
|
|
|
|
Other |
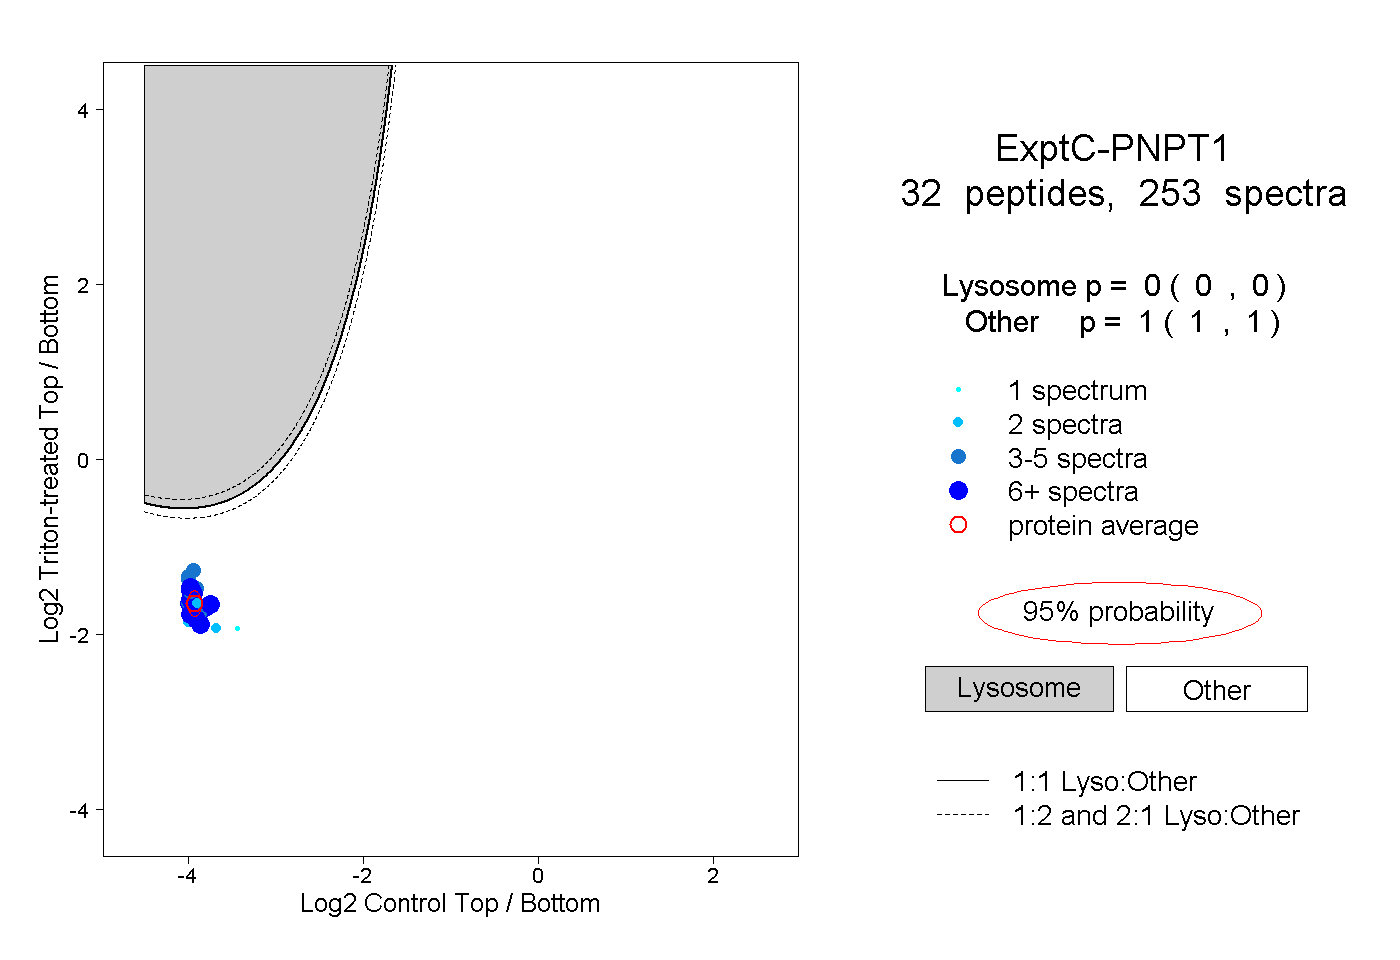
| Expt C |
32
peptides |
253
spectra |
 |
|
0.000
0.000 | 0.000 |
|
|
|
|
|
|
|
1.000
1.000 | 1.000 |
| | | Plot |
|
Lyso |
|
|
|
|
|
|
|
Other |
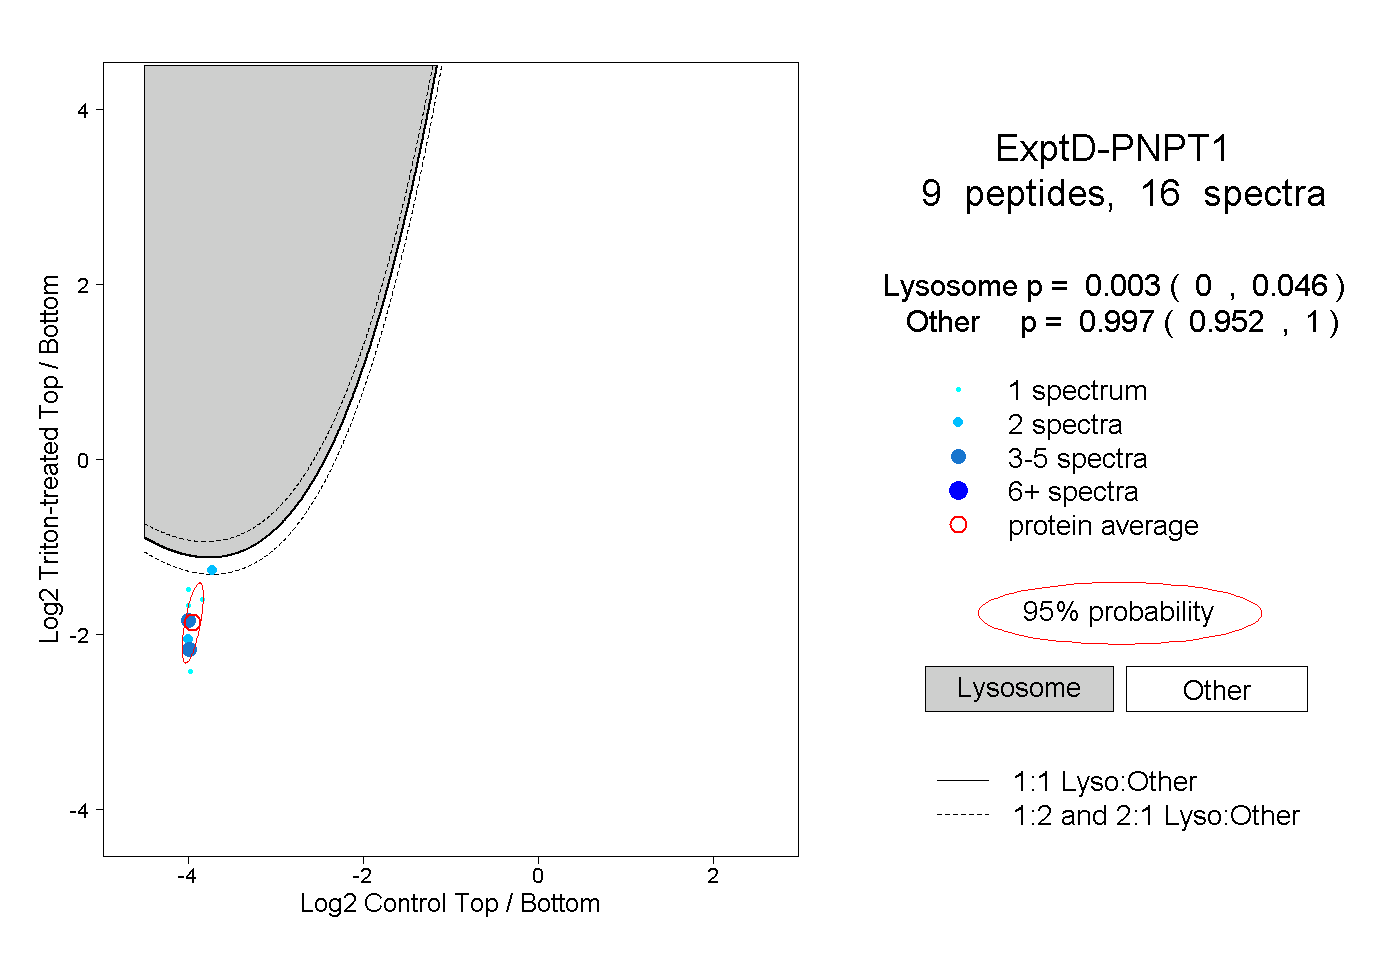
| Expt D |
9
peptides |
16
spectra |
 |
|
0.003
0.000 | 0.046 |
|
|
|
|
|
|
|
0.997
0.952 | 1.000 |
| 1 spectrum, DTGVMVK |
|
0.000 |
|
|
|
|
|
|
|
1.000 |
| 2 spectra, ALCPVIPK |
|
0.001 |
|
|
|
|
|
|
|
0.999 |
| 4 spectra, DEAVNK |
|
0.000 |
|
|
|
|
|
|
|
1.000 |
| 1 spectrum, ELGHGALAEK |
|
0.003 |
|
|
|
|
|
|
|
0.997 |
| 1 spectrum, EILQTMSK |
|
0.027 |
|
|
|
|
|
|
|
0.973 |
| 1 spectrum, LPGVPVK |
|
0.046 |
|
|
|
|
|
|
|
0.954 |
| 3 spectra, IPTNYLR |
|
0.003 |
|
|
|
|
|
|
|
0.997 |
| 1 spectrum, GITALQADIK |
|
0.012 |
|
|
|
|
|
|
|
0.988 |
| 2 spectra, GEIEDYR |
|
0.254 |
|
|
|
|
|
|
|
0.746 |