PNPT1
[ENSRNOP00000004919]
Main page
| | | Plot |
Mito |
Lyso |
|
Perox |
ER |
Golgi |
PM |
Cytosol |
Nucleus |
|
| Expt A |
 20
20
peptides |
52
spectra |
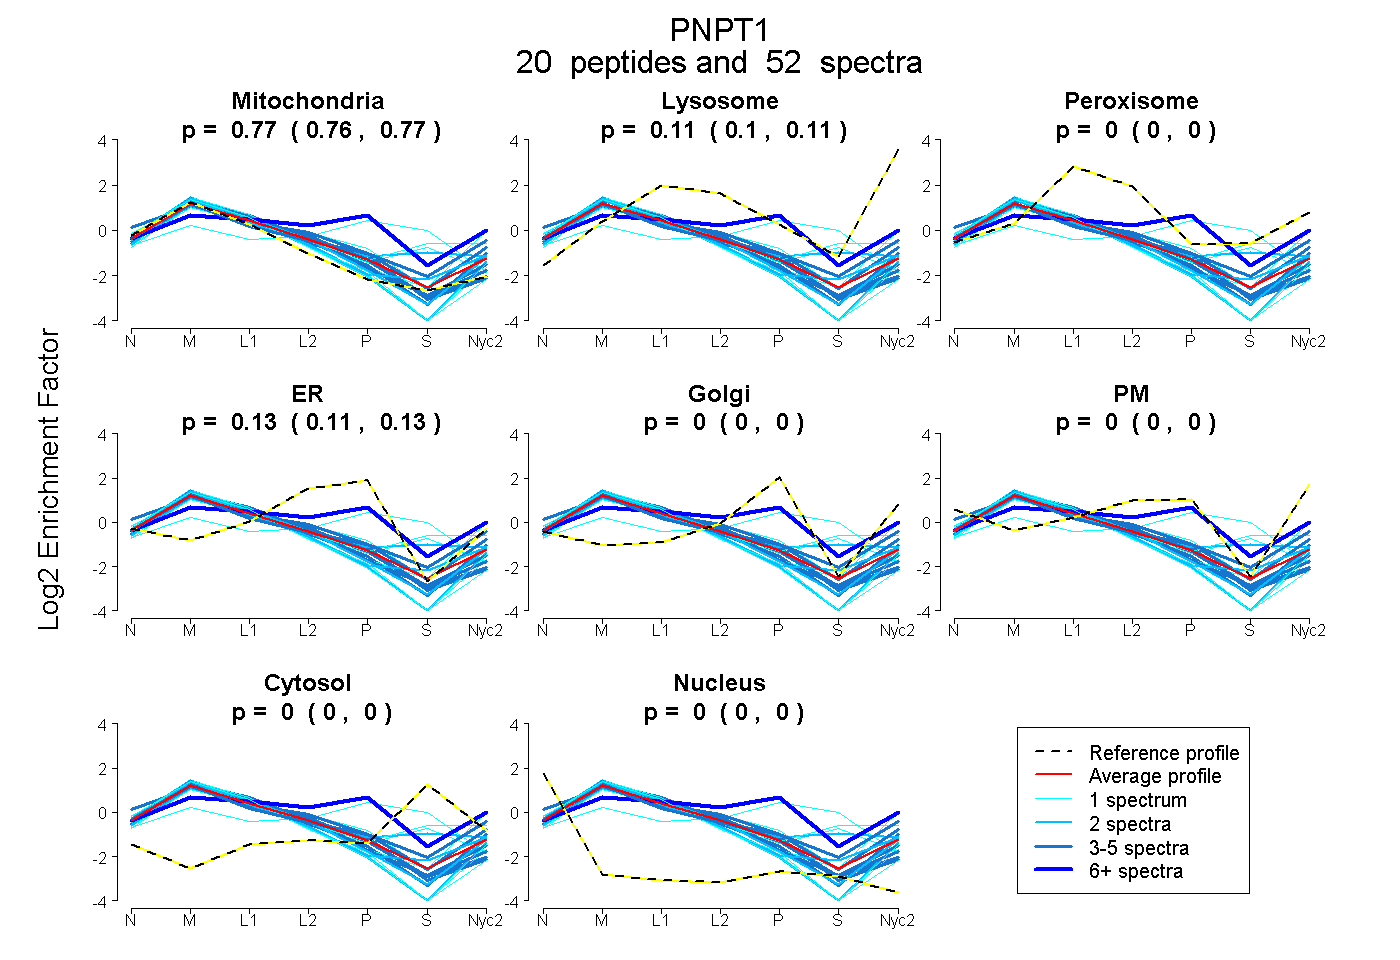 |
0.769
0.761 | 0.775 |
0.106
0.097 | 0.112 |
|
0.000
0.000 | 0.000 |
0.125
0.115 | 0.134 |
0.000
0.000 | 0.000 |
0.000
0.000 | 0.003 |
0.000
0.000 | 0.000 |
0.000
0.000 | 0.000 |
|
| | | Plot |
Mito |
|
Lyso or Perox |
|
ER |
Golgi |
PM |
Cytosol |
Nucleus |
|
| Expt B |
10
peptides |
16
spectra |
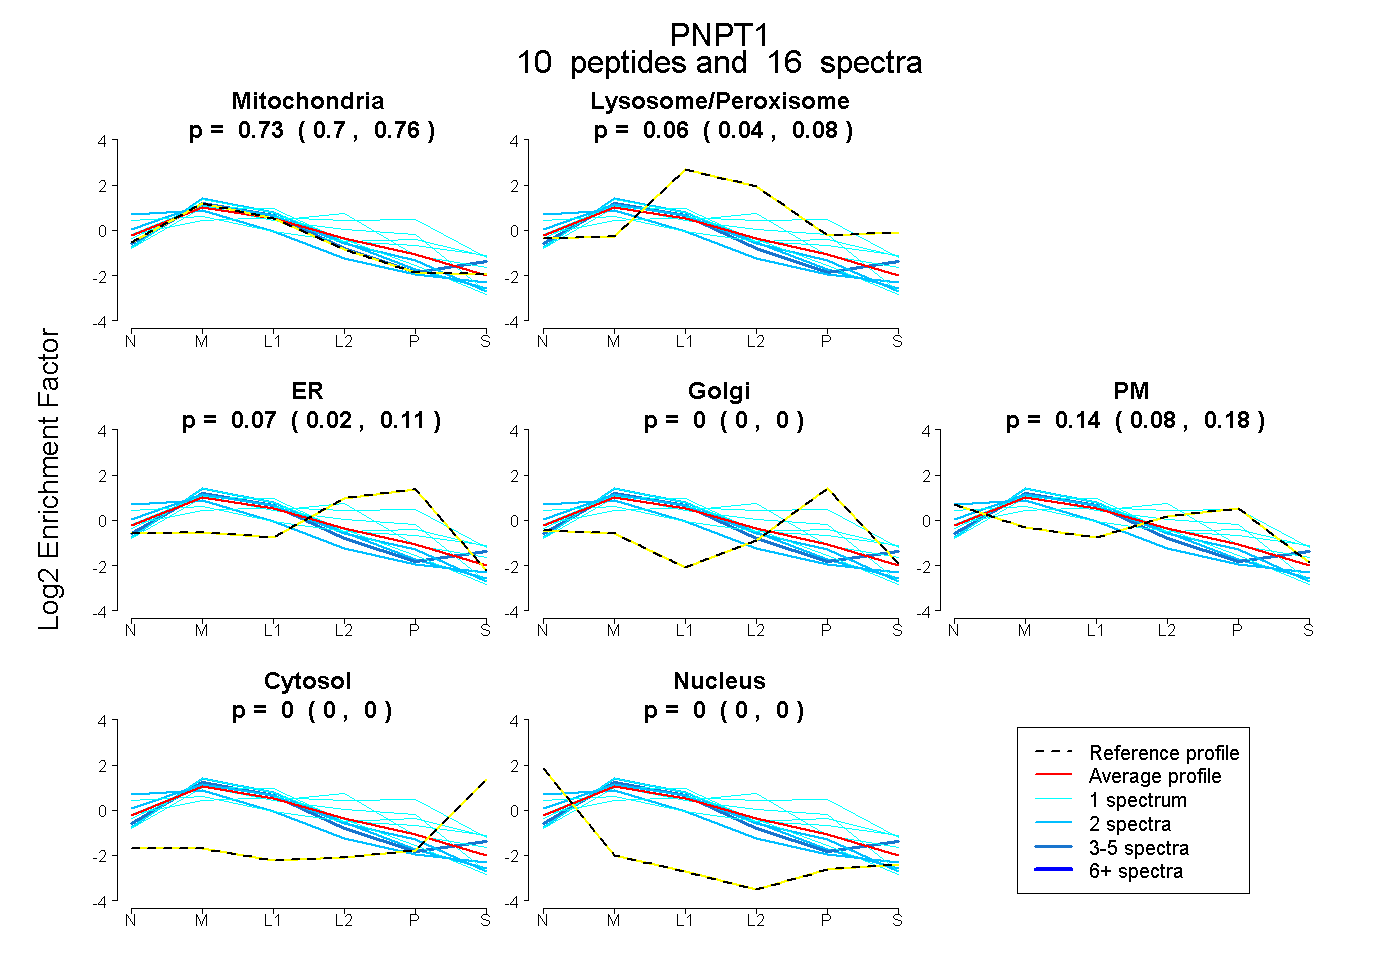 |
0.734
0.705 | 0.762 |
|
0.059
0.038 | 0.077 |
|
0.070
0.017 | 0.113 |
0.000
0.000 | 0.000 |
0.137
0.078 | 0.184 |
0.000
0.000 | 0.000 |
0.000
0.000 | 0.000 |
|
| 2 spectra, IFTPSAEIVK |
0.744 |
|
0.000 |
|
0.000 |
0.000 |
0.055 |
0.000 |
0.200 |
|
| 1 spectrum, ELGHGALAEK |
0.573 |
|
0.215 |
|
0.126 |
0.000 |
0.086 |
0.000 |
0.000 |
|
| 1 spectrum, TLHGSALFQR |
0.420 |
|
0.084 |
|
0.000 |
0.000 |
0.413 |
0.064 |
0.019 |
|
| 1 spectrum, FIGPGGYHLK |
0.566 |
|
0.268 |
|
0.000 |
0.166 |
0.000 |
0.000 |
0.000 |
|
| 4 spectra, DFPFTIR |
0.887 |
|
0.066 |
|
0.000 |
0.000 |
0.000 |
0.047 |
0.000 |
|
| 1 spectrum, IPTNYLR |
0.593 |
|
0.000 |
|
0.407 |
0.000 |
0.000 |
0.000 |
0.000 |
|
| 1 spectrum, GITALQADIK |
0.924 |
|
0.000 |
|
0.076 |
0.000 |
0.000 |
0.000 |
0.000 |
|
| 2 spectra, GEIEDYR |
0.821 |
|
0.000 |
|
0.000 |
0.000 |
0.179 |
0.000 |
0.000 |
|
| 1 spectrum, TISKPR |
0.179 |
|
0.368 |
|
0.089 |
0.221 |
0.144 |
0.000 |
0.000 |
|
| 2 spectra, AVTVDLGHR |
0.974 |
|
0.000 |
|
0.026 |
0.000 |
0.000 |
0.000 |
0.000 |
|
| | | Plot |
|
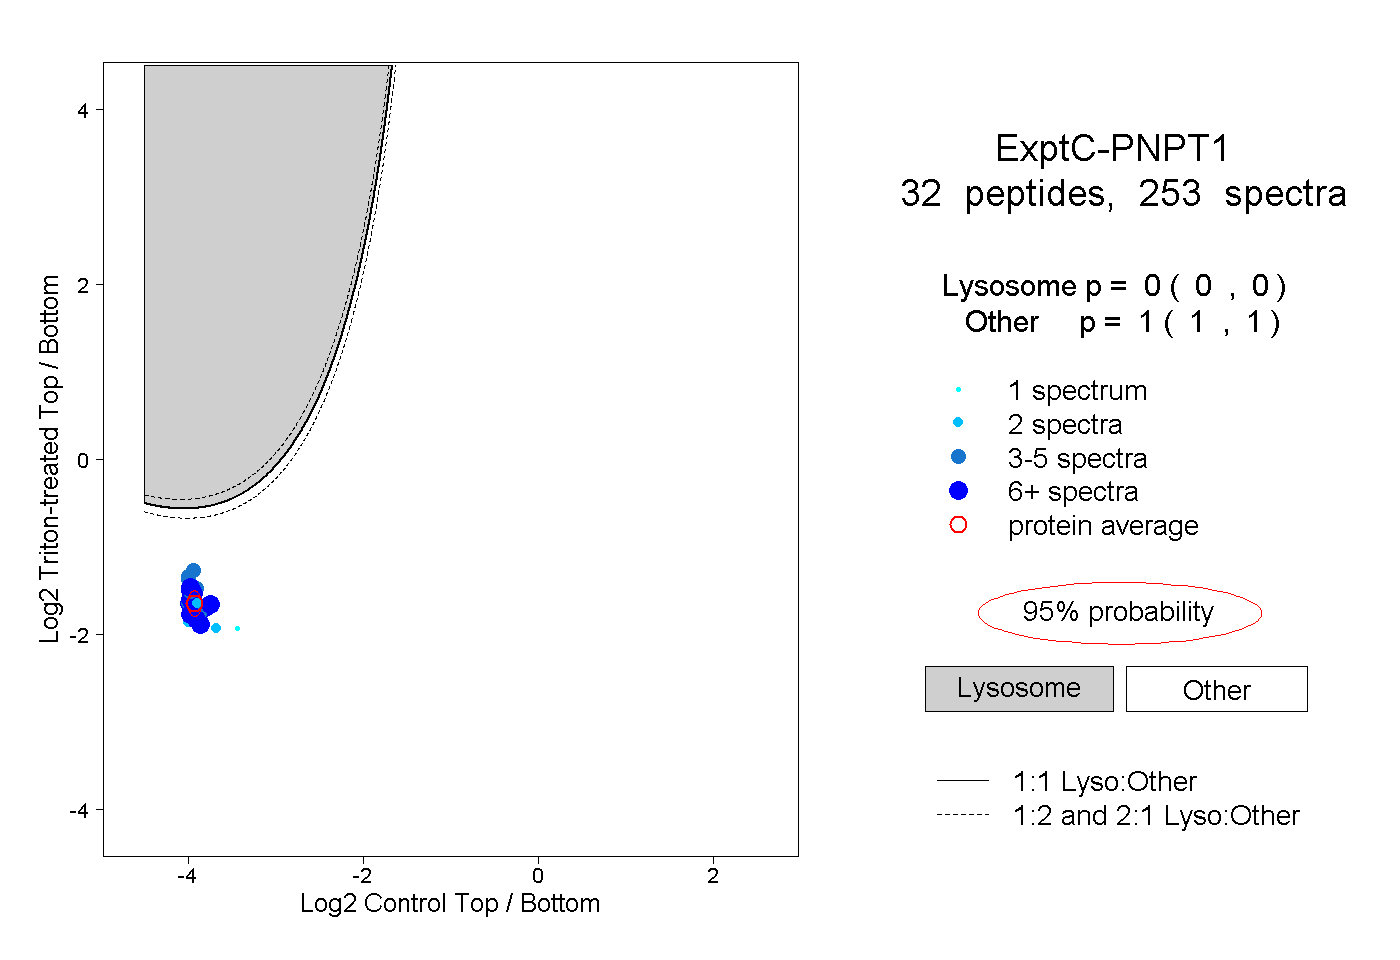
Lyso |
|
|
|
|
|
|
|
Other |
| Expt C |
32
peptides |
253
spectra |
 |
|
0.000
0.000 | 0.000 |
|
|
|
|
|
|
|
1.000
1.000 | 1.000 |
| | | Plot |
|
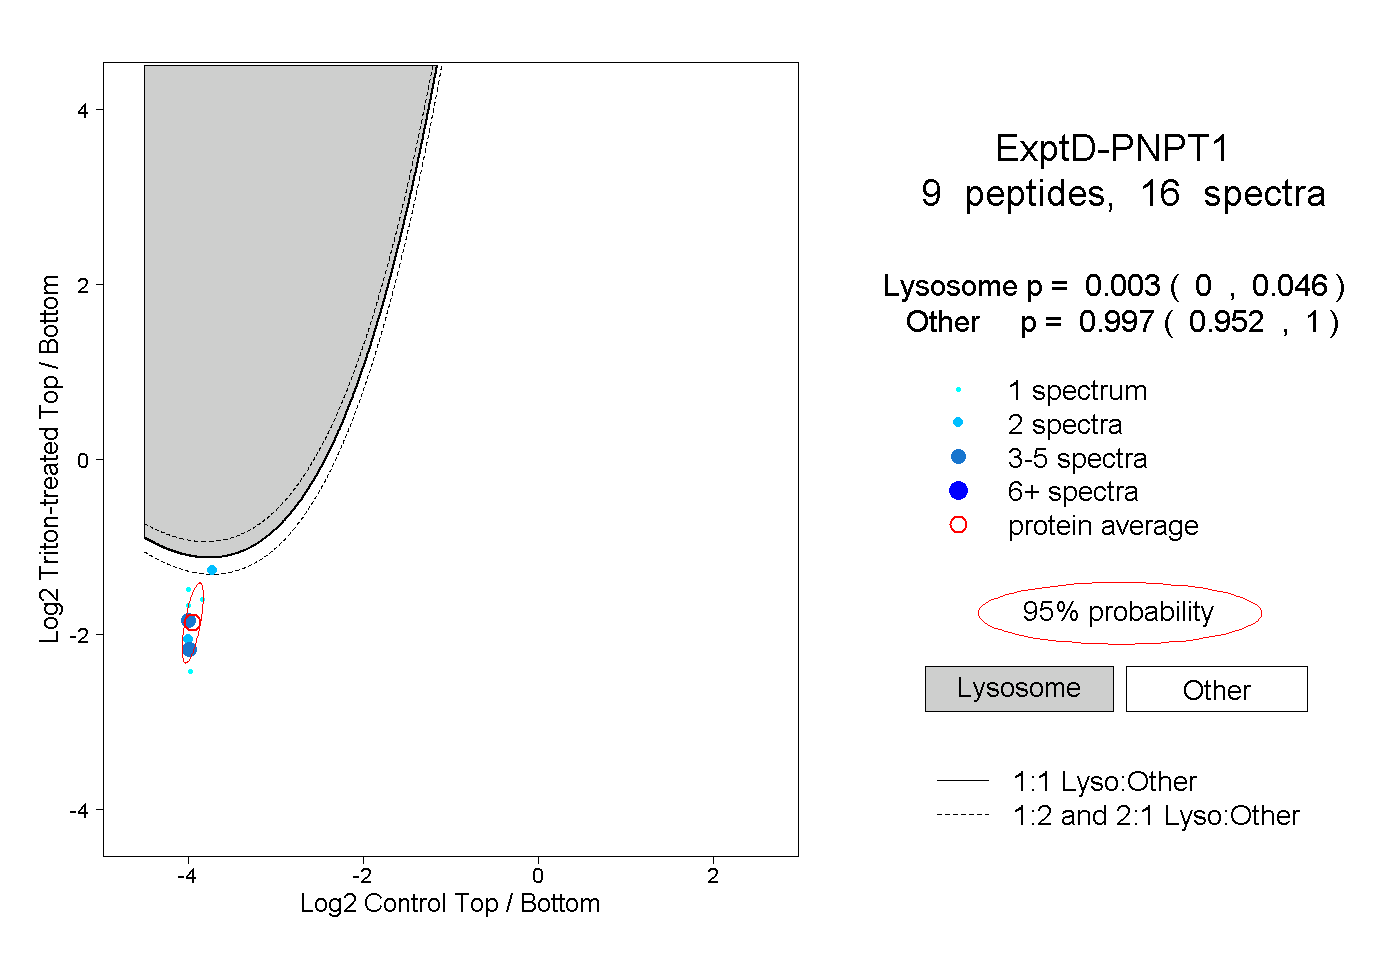
Lyso |
|
|
|
|
|
|
|
Other |
| Expt D |
9
peptides |
16
spectra |
 |
|
0.003
0.000 | 0.046 |
|
|
|
|
|
|
|
0.997
0.952 | 1.000 |