 20
20peptides
spectra
0.761 | 0.775
0.097 | 0.112
0.000 | 0.000
0.115 | 0.134
0.000 | 0.000
0.000 | 0.003
0.000 | 0.000
0.000 | 0.000
| Plot | Mito | Lyso | Perox | ER | Golgi | PM | Cytosol | Nucleus | |||||
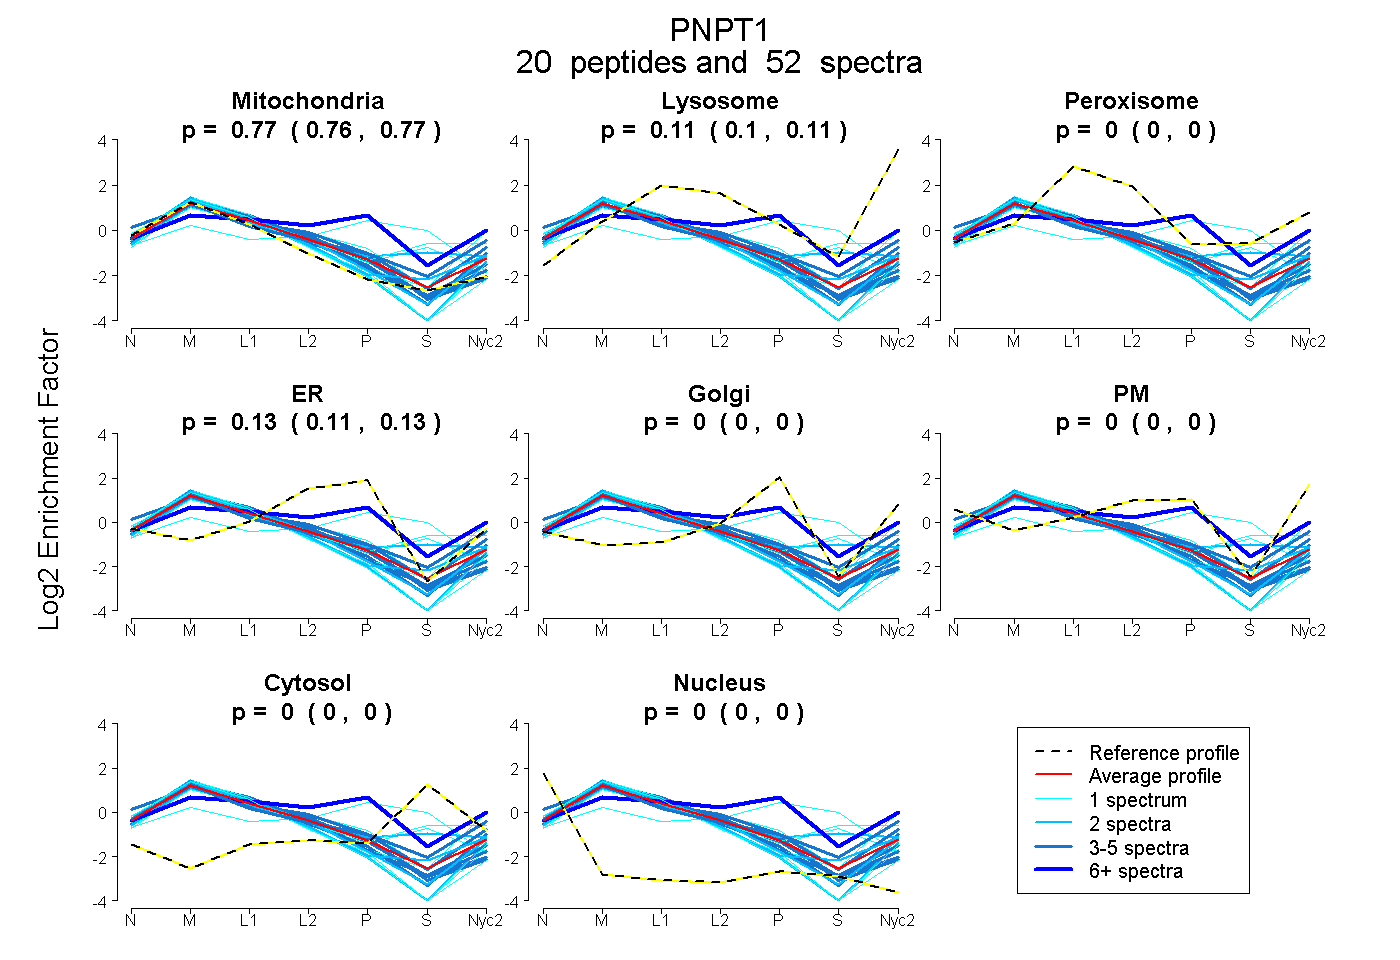
| Expt A |
20 peptides |
52 spectra |
|
0.769 0.761 | 0.775 |
0.106 0.097 | 0.112 |
0.000 0.000 | 0.000 |
0.125 0.115 | 0.134 |
0.000 0.000 | 0.000 |
0.000 0.000 | 0.003 |
0.000 0.000 | 0.000 |
0.000 0.000 | 0.000 |
| 1 spectrum, DPADGR | 0.933 | 0.000 | 0.000 | 0.008 | 0.000 | 0.059 | 0.000 | 0.000 | ||
| 1 spectrum, DEAVNK | 0.643 | 0.084 | 0.000 | 0.109 | 0.000 | 0.164 | 0.000 | 0.000 | ||
| 1 spectrum, SDQIITAINGVK | 0.506 | 0.136 | 0.140 | 0.000 | 0.000 | 0.000 | 0.218 | 0.000 | ||
| 5 spectra, FIGPGGYHLK | 0.814 | 0.000 | 0.000 | 0.186 | 0.000 | 0.000 | 0.000 | 0.000 | ||
| 5 spectra, NISCEVDMFK | 0.804 | 0.014 | 0.019 | 0.164 | 0.000 | 0.000 | 0.000 | 0.000 | ||
| 1 spectrum, IAGTNK | 0.699 | 0.229 | 0.000 | 0.000 | 0.000 | 0.073 | 0.000 | 0.000 | ||
| 1 spectrum, IPTNYLR | 0.983 | 0.000 | 0.000 | 0.017 | 0.000 | 0.000 | 0.000 | 0.000 | ||
| 5 spectra, DFPFTIR | 0.802 | 0.076 | 0.000 | 0.000 | 0.000 | 0.122 | 0.000 | 0.000 | ||
| 2 spectra, IGMIDGECVVNPTR | 0.580 | 0.031 | 0.207 | 0.000 | 0.022 | 0.000 | 0.160 | 0.000 | ||
| 5 spectra, LYAVFTDYEHDK | 0.838 | 0.072 | 0.000 | 0.091 | 0.000 | 0.000 | 0.000 | 0.000 | ||
| 2 spectra, TKPSPSQFMPLVVDYR | 0.844 | 0.096 | 0.000 | 0.021 | 0.000 | 0.039 | 0.000 | 0.000 | ||
| 2 spectra, SIILNEYK | 0.835 | 0.147 | 0.000 | 0.000 | 0.000 | 0.000 | 0.018 | 0.000 | ||
| 1 spectrum, DFITEICR | 0.624 | 0.000 | 0.180 | 0.000 | 0.000 | 0.000 | 0.196 | 0.000 | ||
| 3 spectra, YTHTIAMEK | 0.659 | 0.183 | 0.000 | 0.000 | 0.117 | 0.036 | 0.004 | 0.000 | ||
| 1 spectrum, DTGVMVK | 0.275 | 0.000 | 0.030 | 0.320 | 0.000 | 0.000 | 0.375 | 0.000 | ||
| 3 spectra, IIMEAIQQATVAK | 0.673 | 0.134 | 0.000 | 0.120 | 0.000 | 0.073 | 0.000 | 0.000 | ||
| 6 spectra, TLHGSALFQR | 0.242 | 0.000 | 0.309 | 0.000 | 0.449 | 0.000 | 0.000 | 0.000 | ||
| 1 spectrum, VLQSPATTVLK | 0.892 | 0.000 | 0.000 | 0.000 | 0.000 | 0.108 | 0.000 | 0.000 | ||
| 2 spectra, GEIEDYR | 0.909 | 0.002 | 0.000 | 0.000 | 0.000 | 0.089 | 0.000 | 0.000 | ||
| 4 spectra, AVTVDLGHR | 0.828 | 0.000 | 0.023 | 0.148 | 0.000 | 0.000 | 0.000 | 0.000 |
| Plot | Mito | Lyso or Perox | ER | Golgi | PM | Cytosol | Nucleus | ||||||
| Expt B |
10 peptides |
16 spectra |
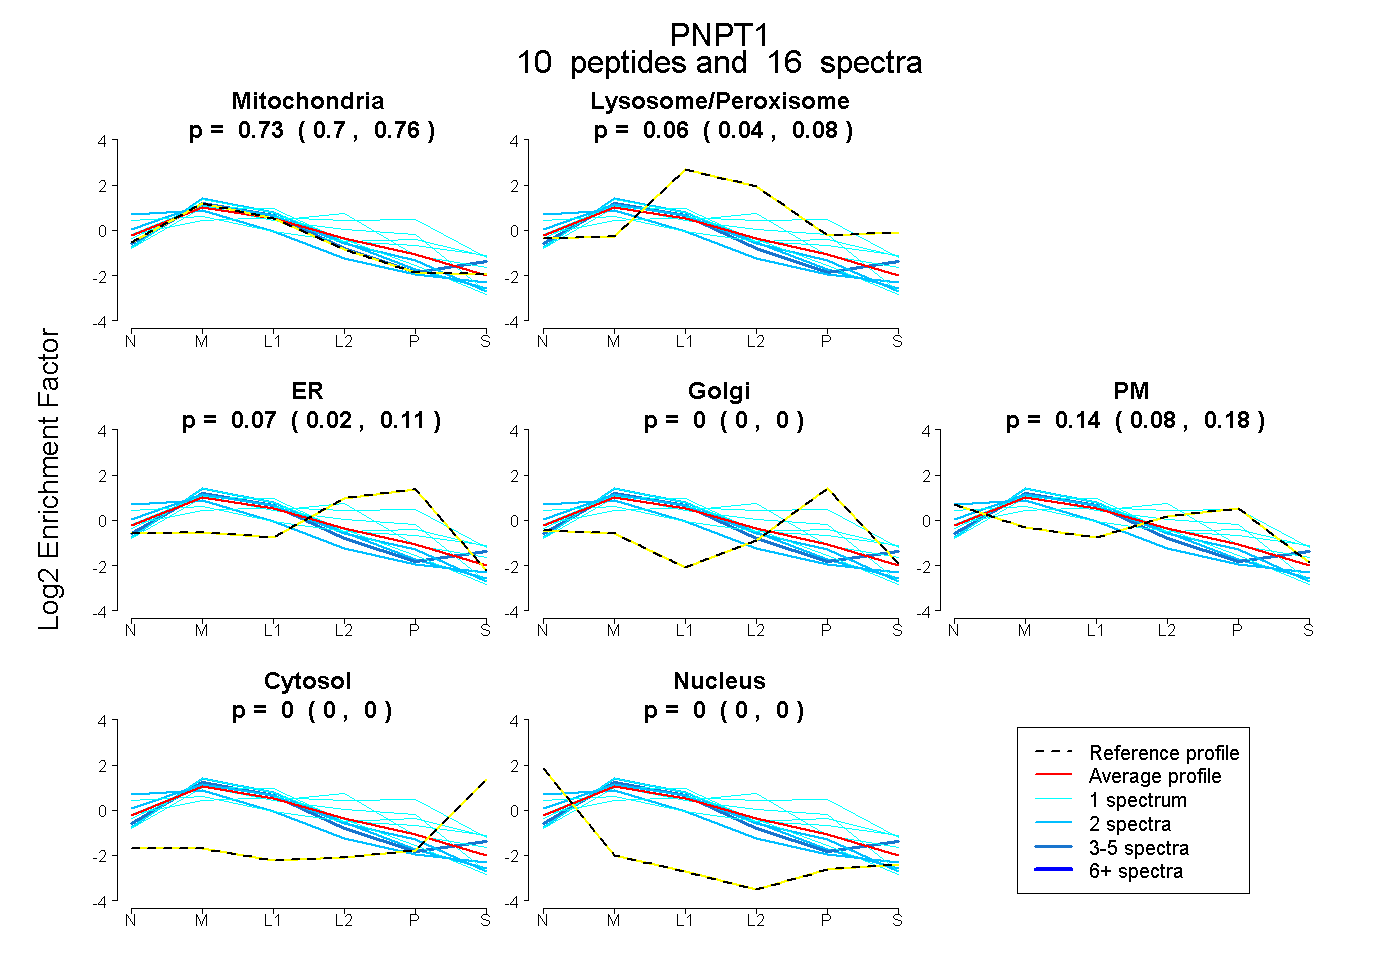 |
0.734 0.705 | 0.762 |
0.059 0.038 | 0.077 |
0.070 0.017 | 0.113 |
0.000 0.000 | 0.000 |
0.137 0.078 | 0.184 |
0.000 0.000 | 0.000 |
0.000 0.000 | 0.000 |
|||
| Plot | Lyso | Other | |||||||||||
| Expt C |
32 peptides |
253 spectra |
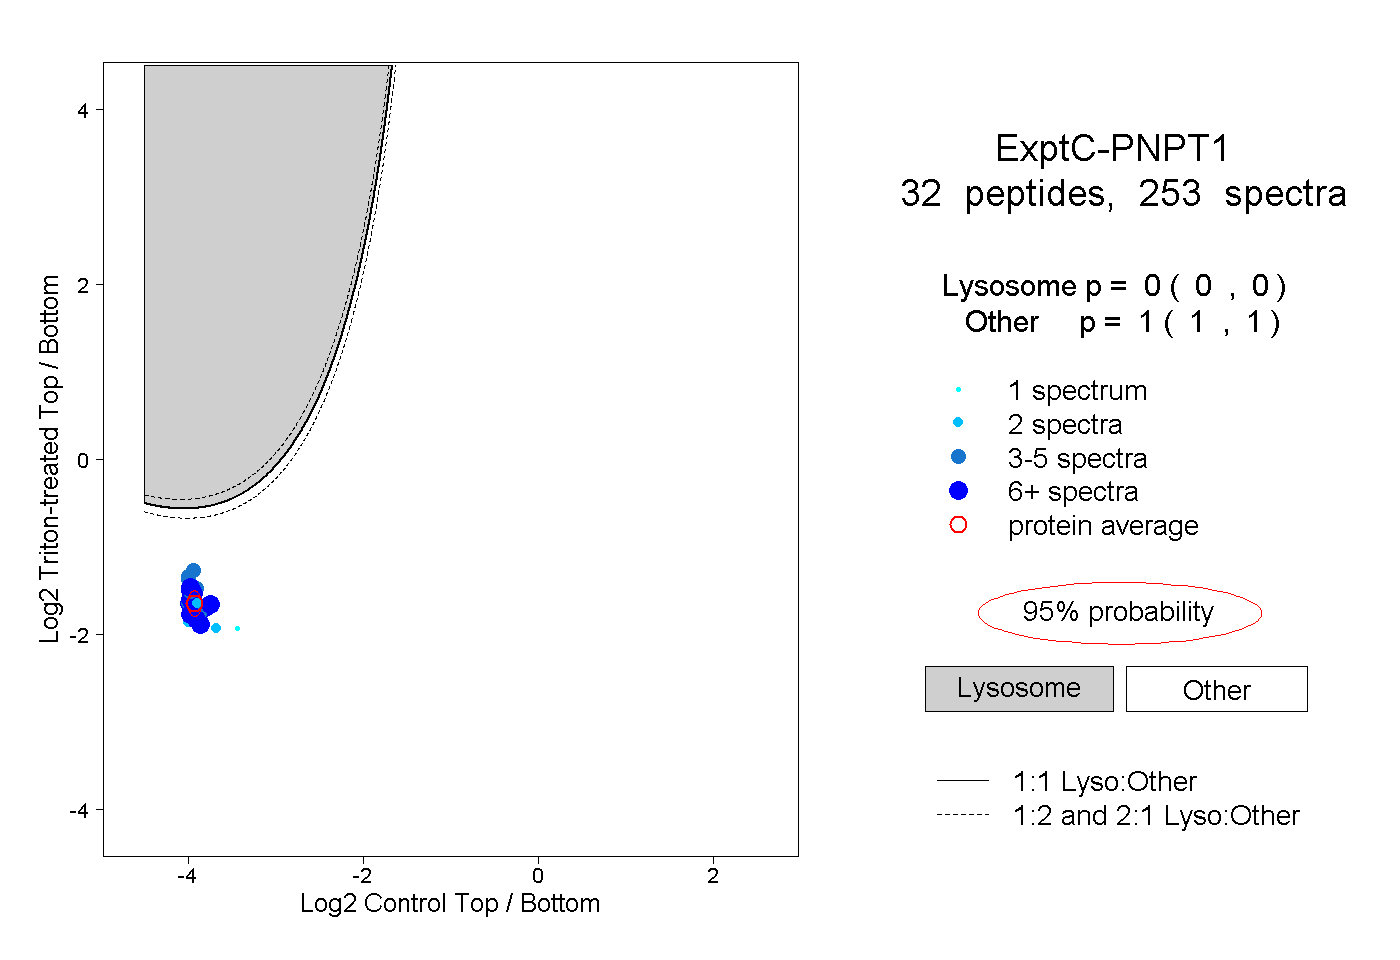 |
0.000 0.000 | 0.000 |
1.000 1.000 | 1.000 |
||||||||
| Plot | Lyso | Other | |||||||||||
| Expt D |
9 peptides |
16 spectra |
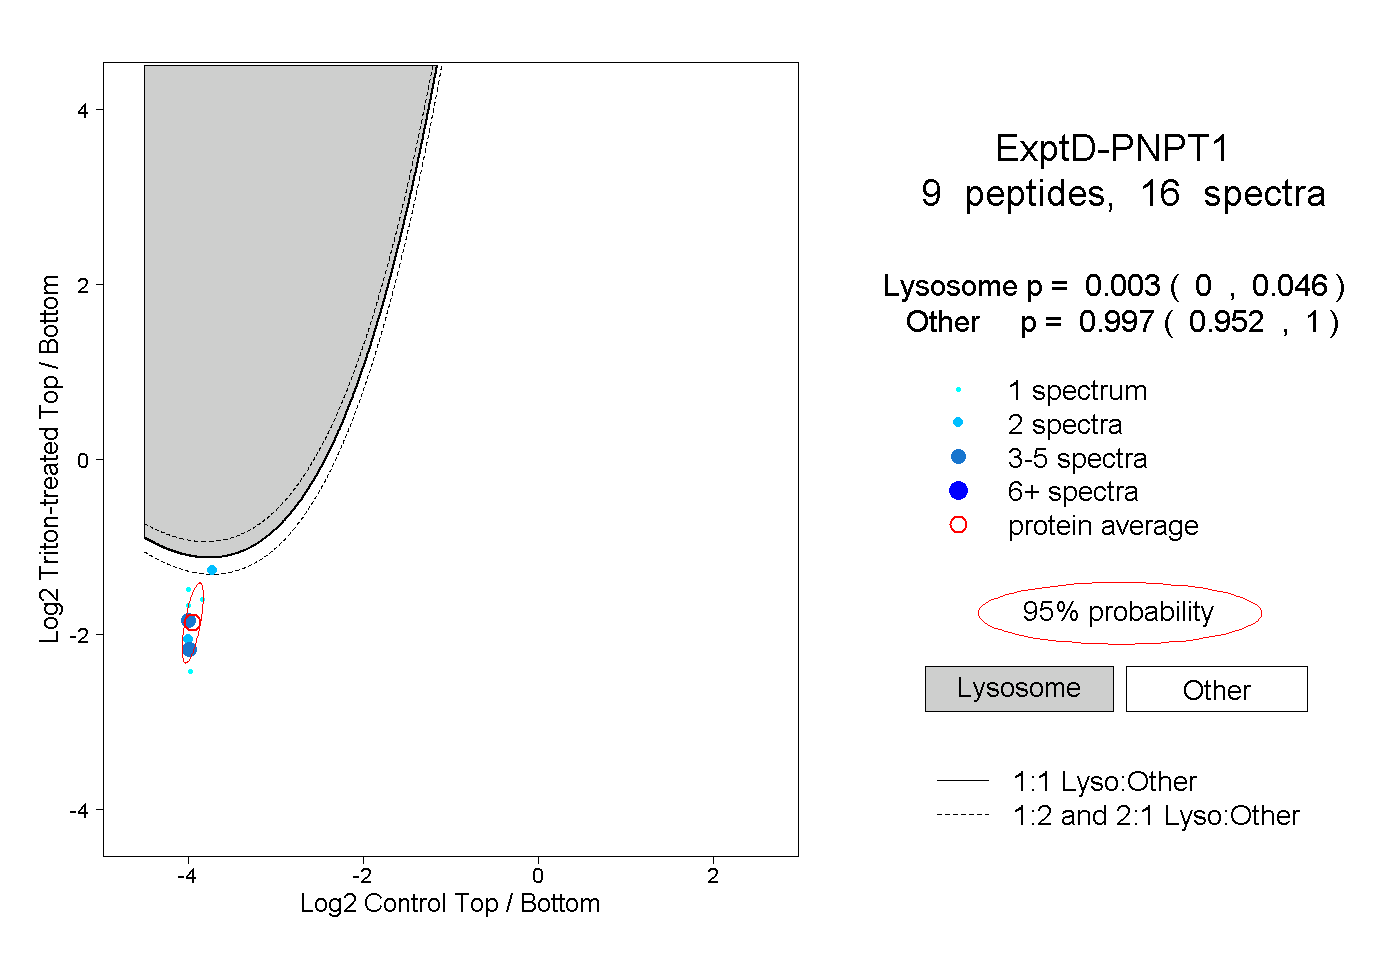 |
0.003 0.000 | 0.046 |
0.997 0.952 | 1.000 |