 15
15peptides
spectra
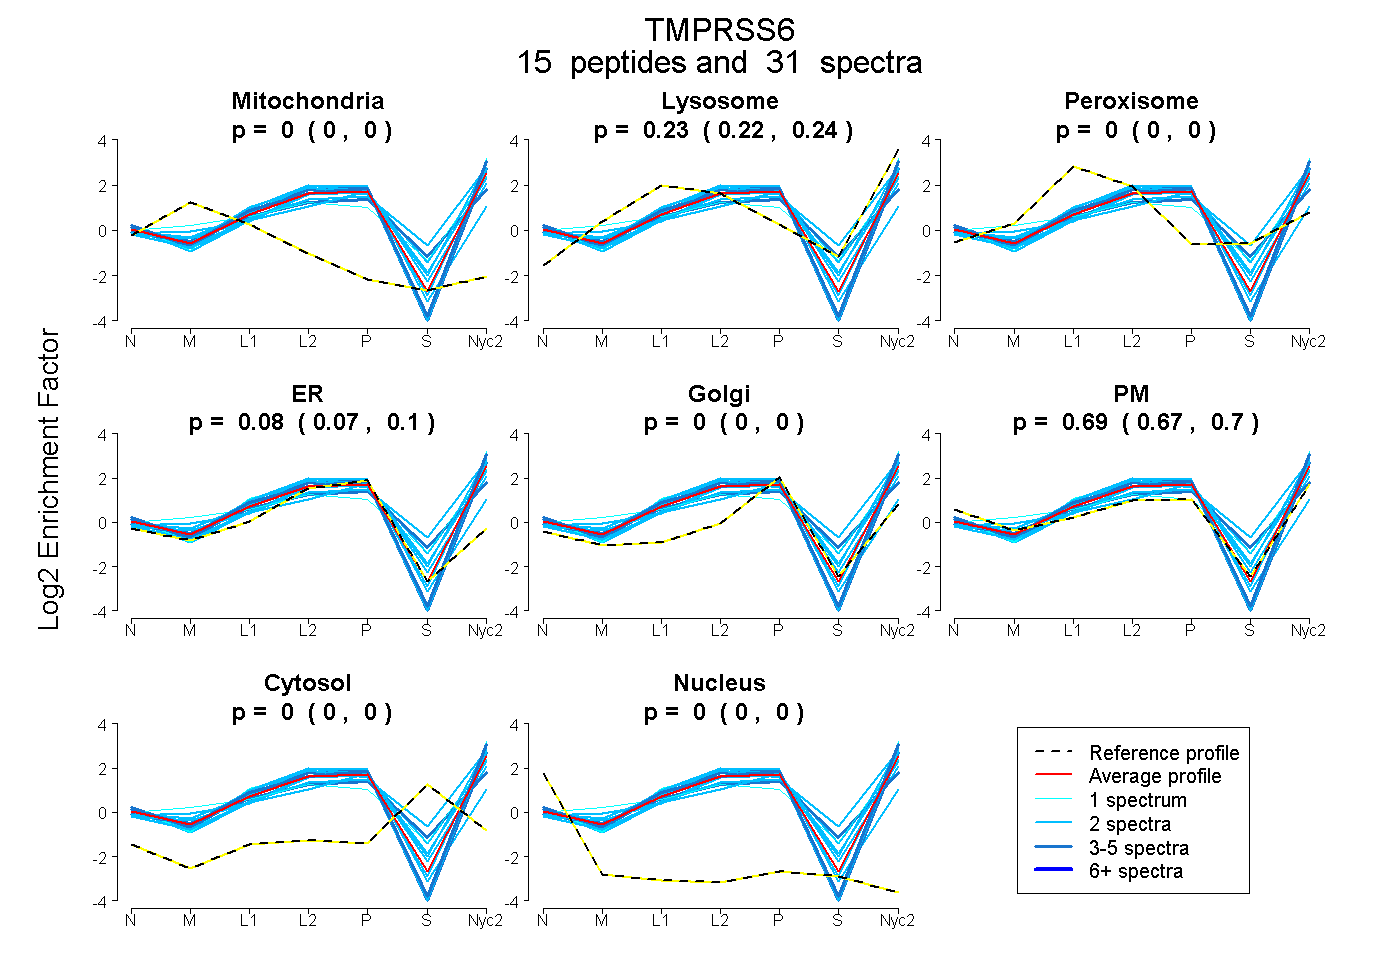
0.000 | 0.000
0.217 | 0.240
0.000 | 0.000
0.068 | 0.098
0.000 | 0.000
0.666 | 0.702
0.000 | 0.000
0.000 | 0.000
5peptides
spectra
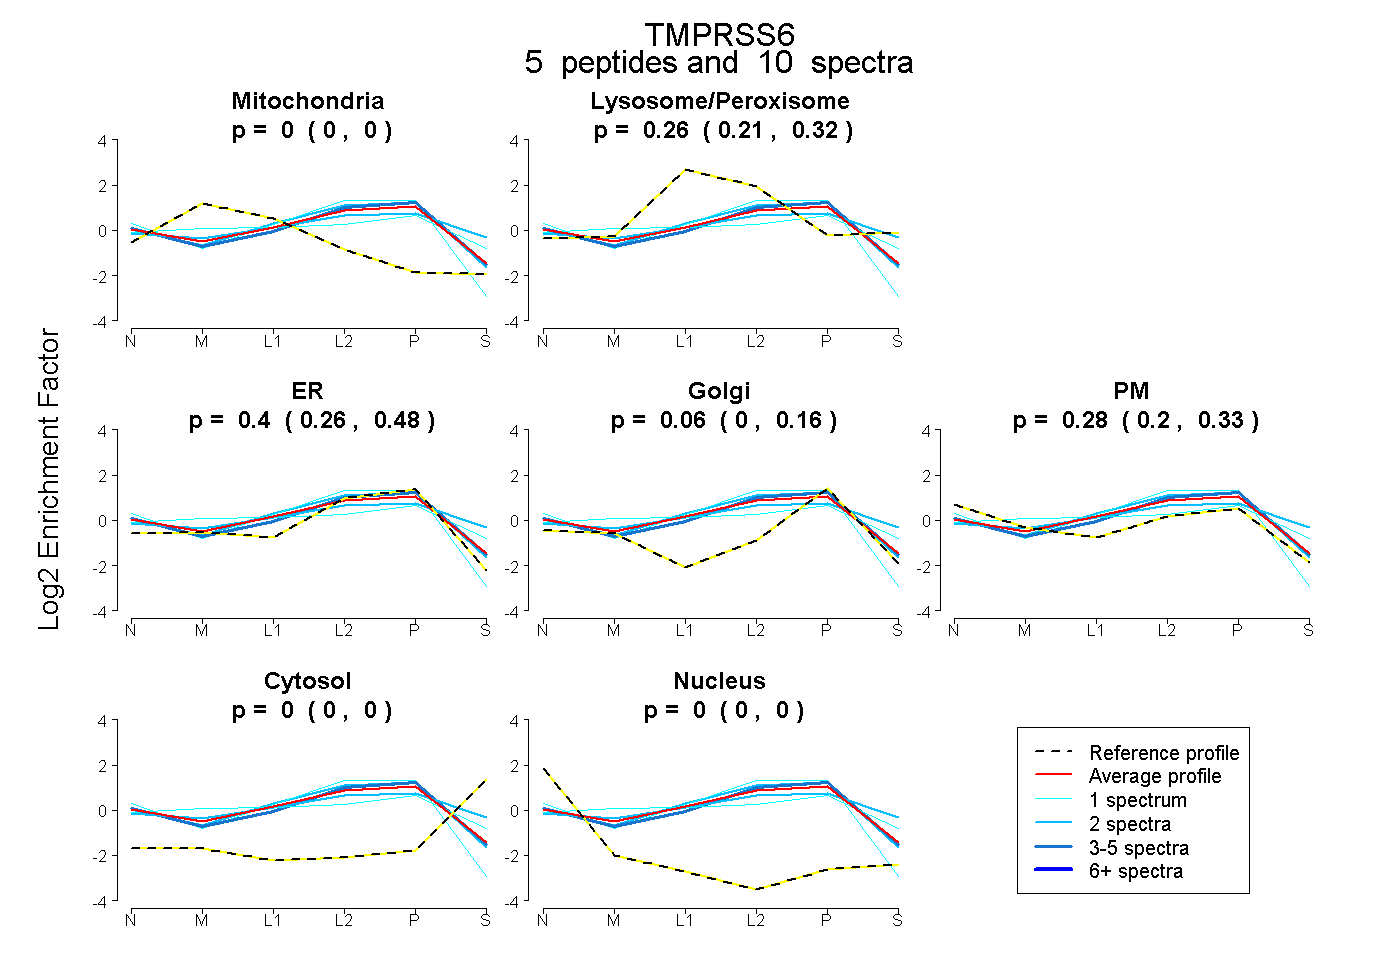
0.000 | 0.000
0.214 | 0.322
0.263 | 0.484
0.000 | 0.164
0.199 | 0.325
0.000 | 0.000
0.000 | 0.000
20peptides
spectra
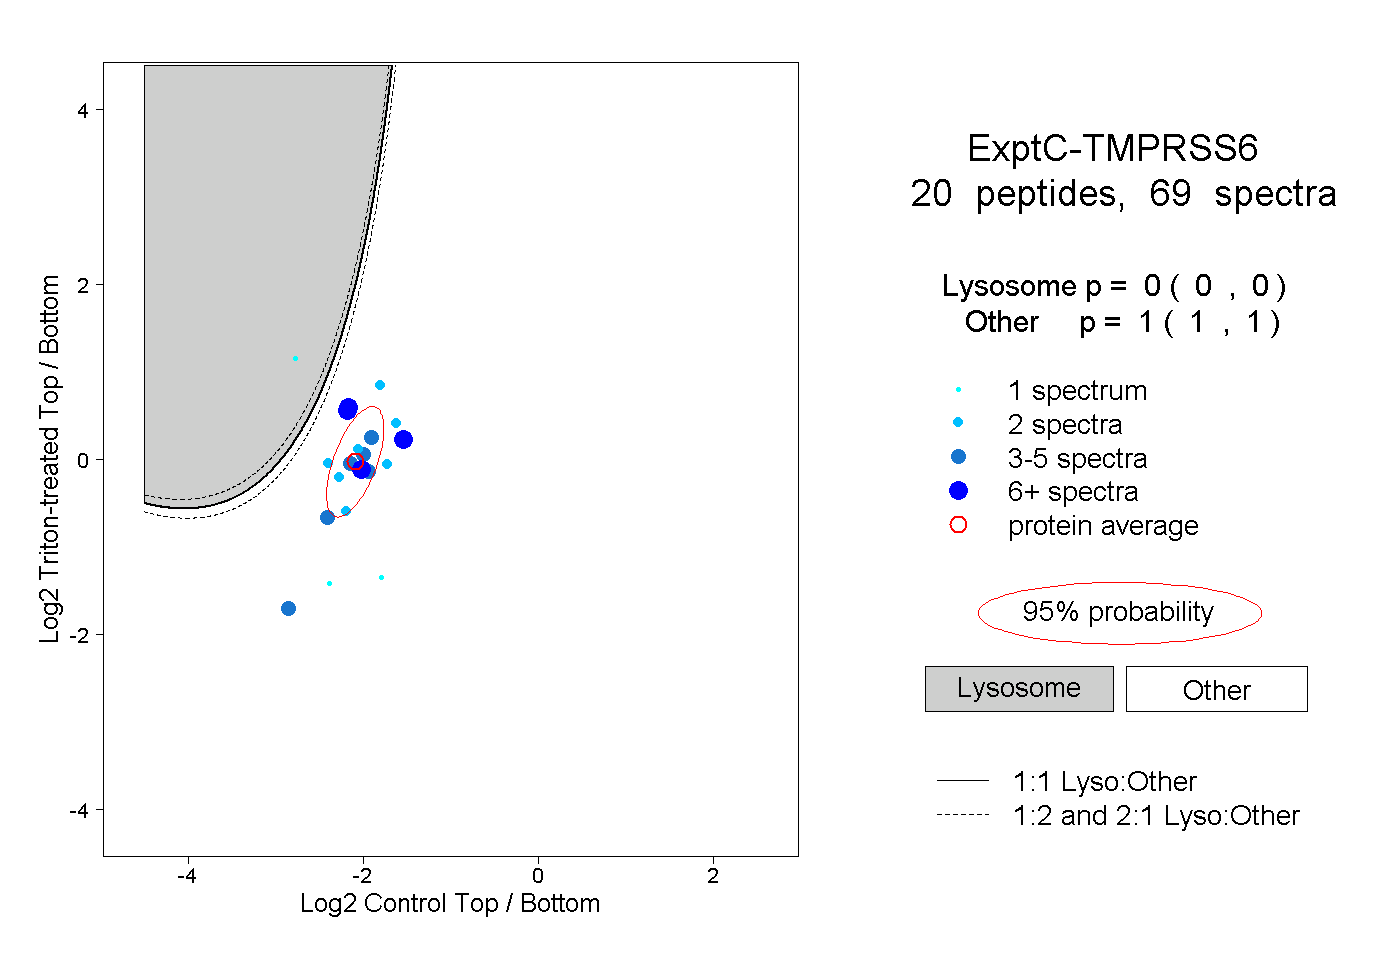
0.000 | 0.000
1.000 | 1.000
3peptides
spectra
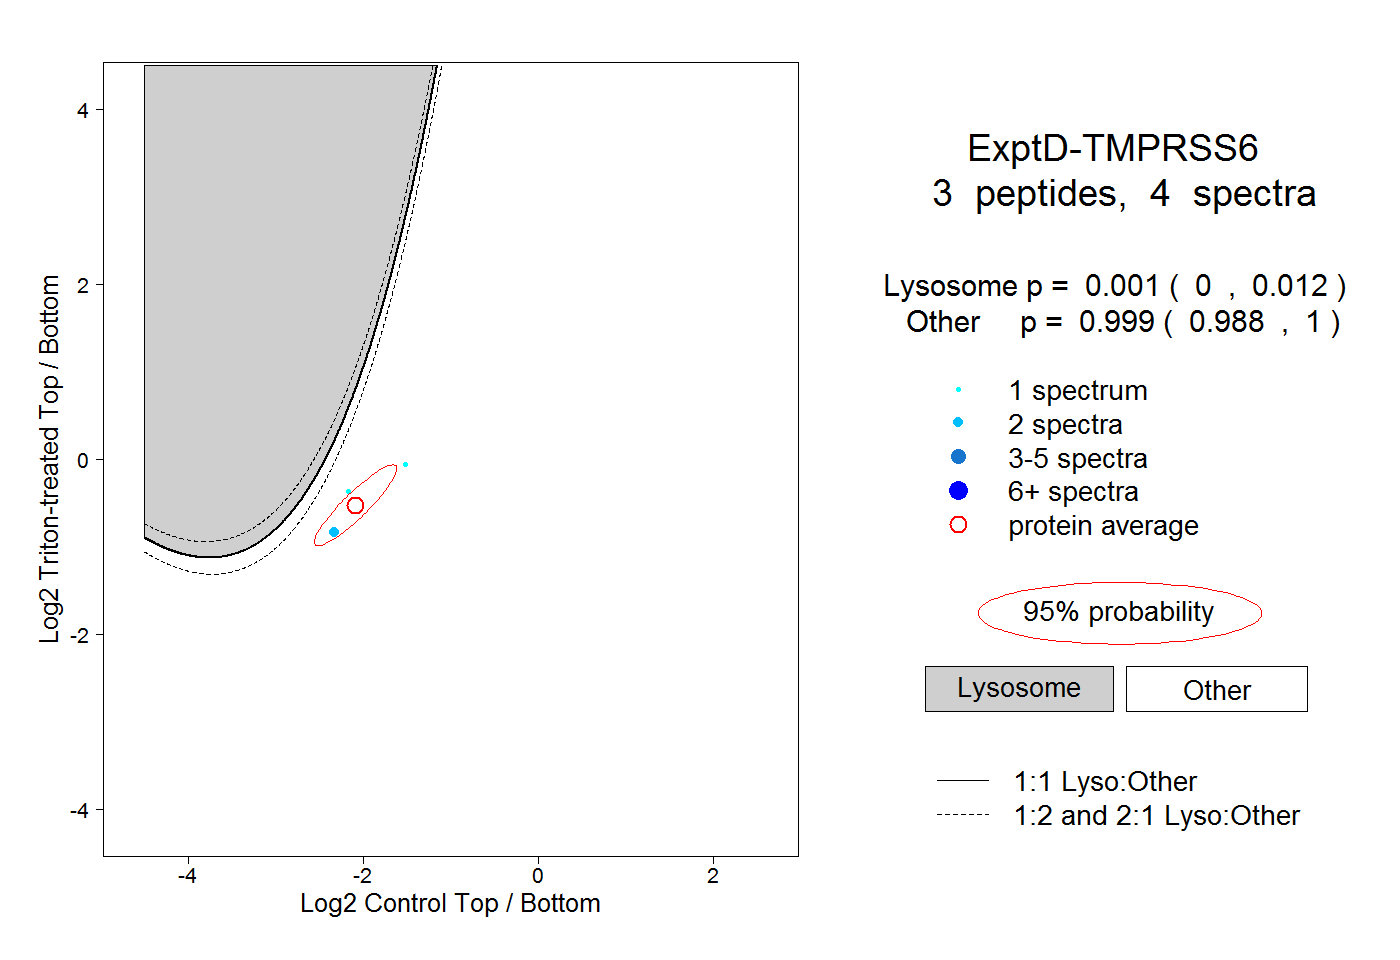
0.000 | 0.012
0.988 | 1.000