TMPRSS6
[ENSRNOP00000000200]
Main page
| | | Plot |
Mito |
Lyso |
|
Perox |
ER |
Golgi |
PM |
Cytosol |
Nucleus |
|
| Expt A |
 15
15
peptides |
31
spectra |
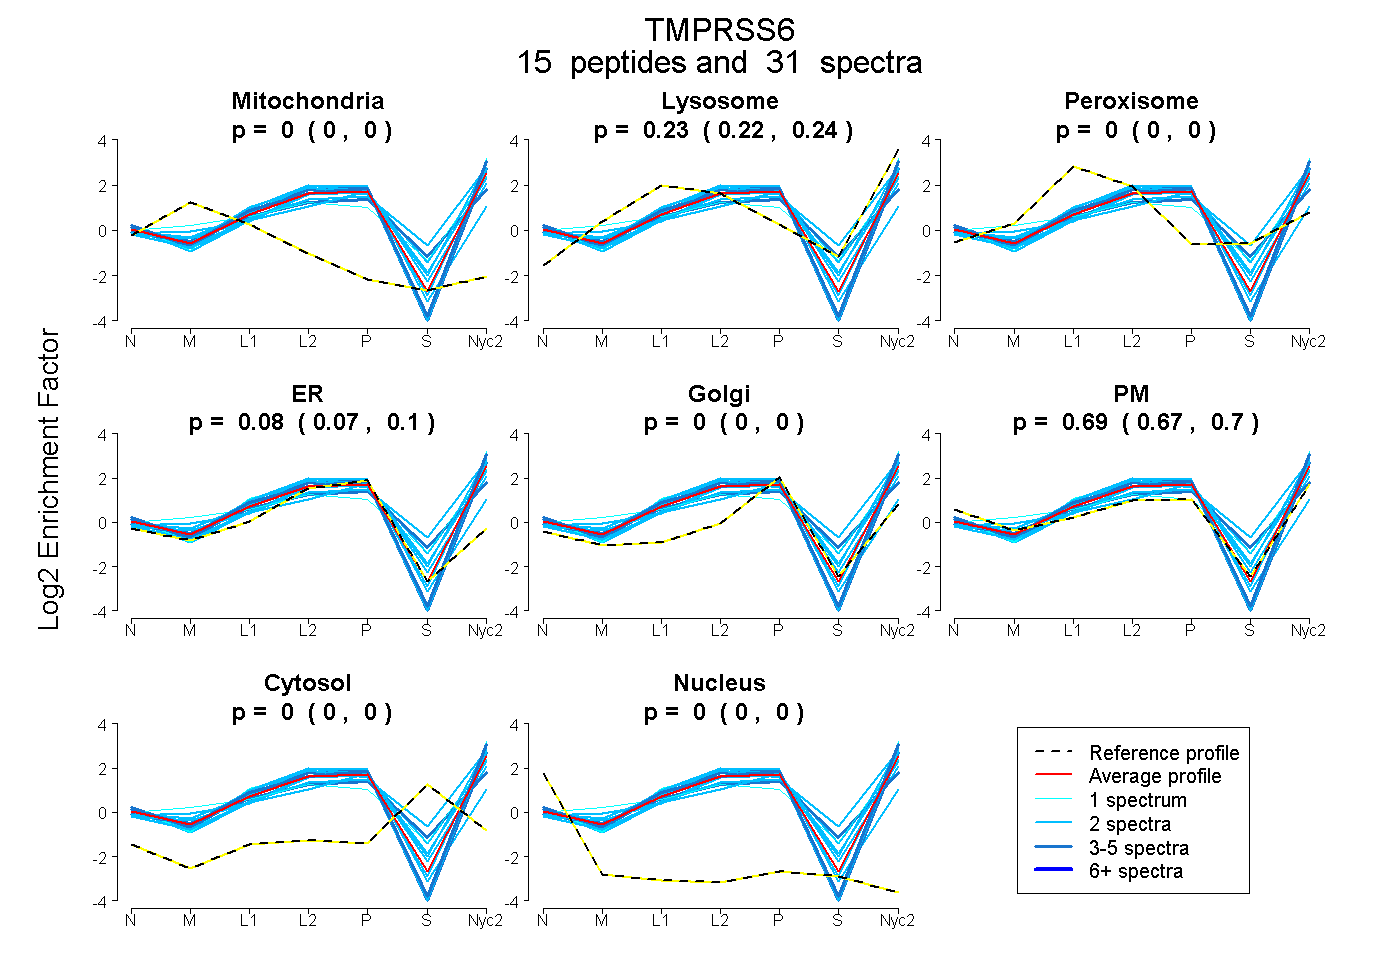 |
0.000
0.000 | 0.000 |
0.230
0.217 | 0.240 |
|
0.000
0.000 | 0.000 |
0.085
0.068 | 0.098 |
0.000
0.000 | 0.000 |
0.686
0.666 | 0.702 |
0.000
0.000 | 0.000 |
0.000
0.000 | 0.000 |
|
| | | Plot |
Mito |
|
Lyso or Perox |
|
ER |
Golgi |
PM |
Cytosol |
Nucleus |
|
| Expt B |
5
peptides |
10
spectra |
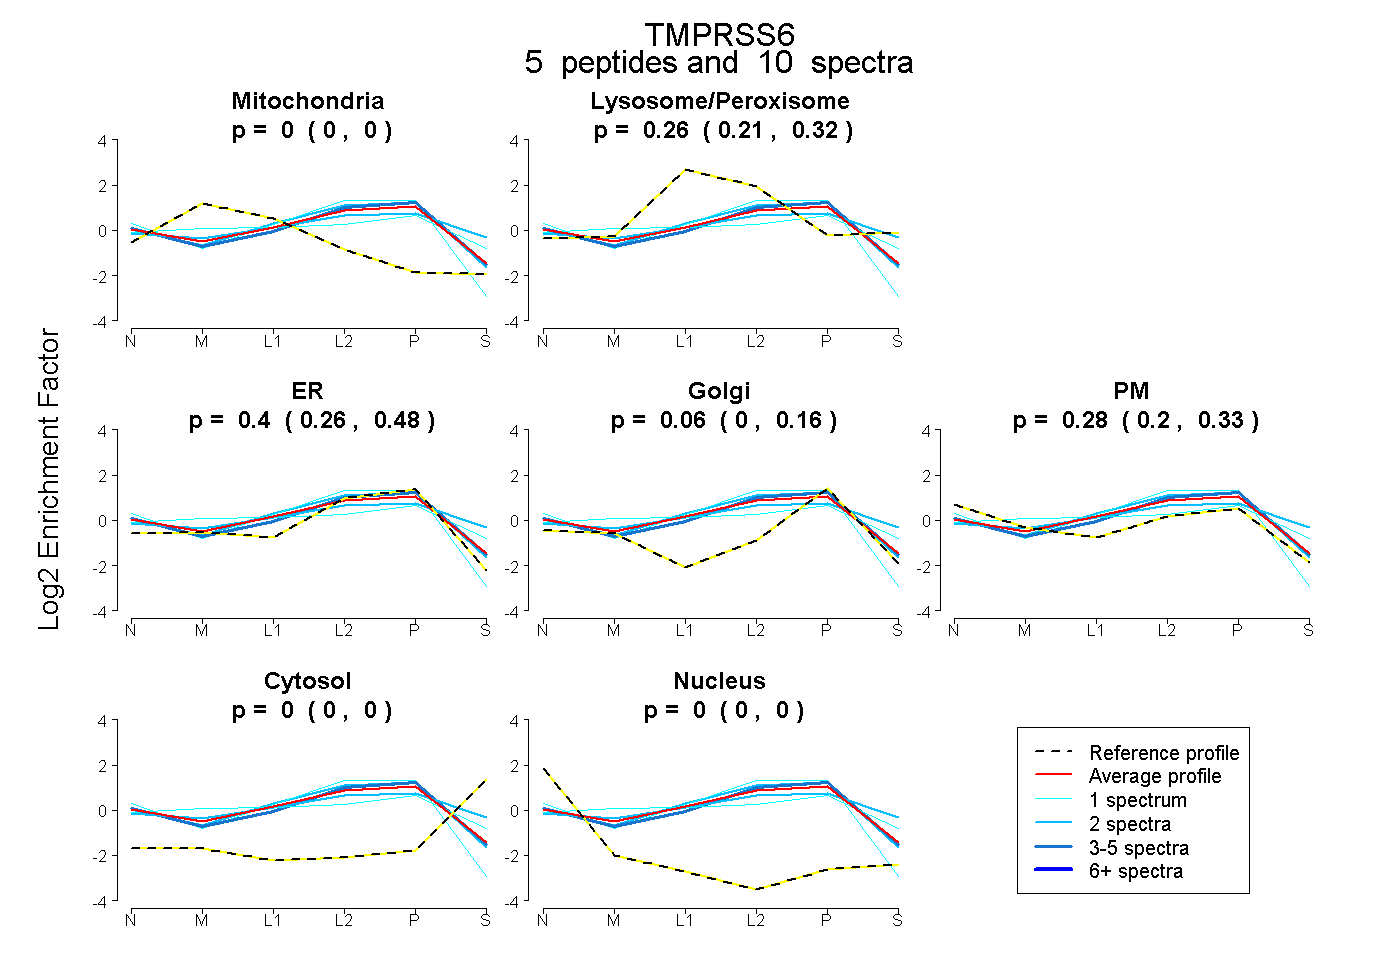 |
0.000
0.000 | 0.000 |
|
0.262
0.214 | 0.322 |
|
0.399
0.263 | 0.484 |
0.060
0.000 | 0.164 |
0.278
0.199 | 0.325 |
0.000
0.000 | 0.000 |
0.000
0.000 | 0.000 |
|
| 2 spectra, TLQPYAER |
0.000 |
|
0.494 |
|
0.000 |
0.410 |
0.044 |
0.053 |
0.000 |
|
| 2 spectra, LDPQGFLR |
0.000 |
|
0.252 |
|
0.580 |
0.000 |
0.168 |
0.000 |
0.000 |
|
| 1 spectrum, YSYVNPGQVLR |
0.056 |
|
0.406 |
|
0.000 |
0.419 |
0.115 |
0.004 |
0.000 |
|
| 4 spectra, LTLSPEVVR |
0.000 |
|
0.190 |
|
0.560 |
0.000 |
0.250 |
0.000 |
0.000 |
|
| 1 spectrum, LITSVYGCSR |
0.000 |
|
0.118 |
|
0.761 |
0.000 |
0.121 |
0.000 |
0.000 |
|
| | | Plot |
|
Lyso |
|
|
|
|
|
|
|
Other |
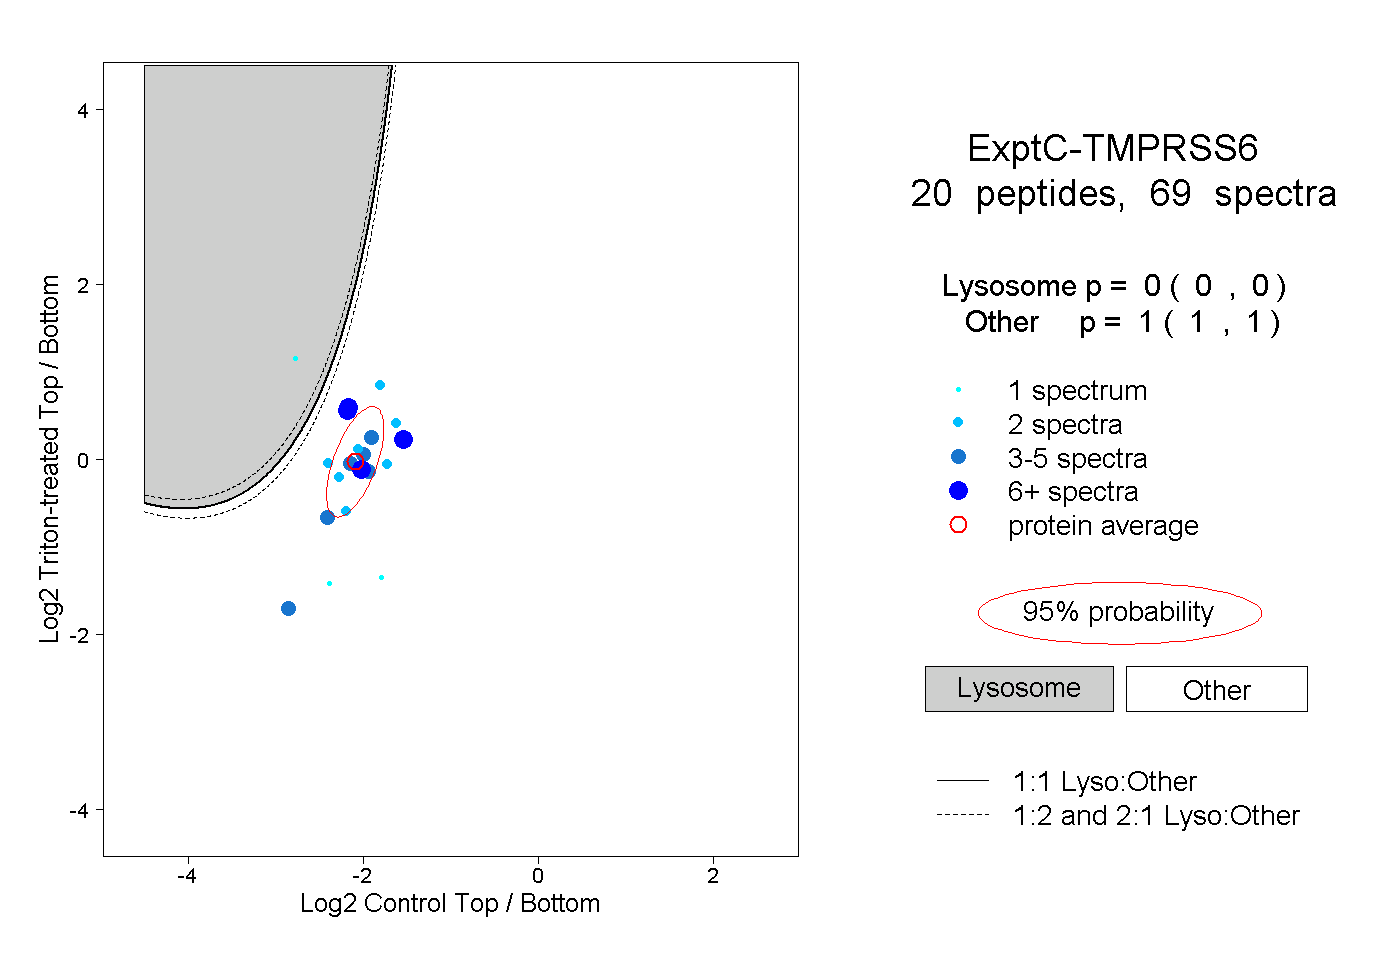
| Expt C |
20
peptides |
69
spectra |
 |
|
0.000
0.000 | 0.000 |
|
|
|
|
|
|
|
1.000
1.000 | 1.000 |
| | | Plot |
|
Lyso |
|
|
|
|
|
|
|
Other |
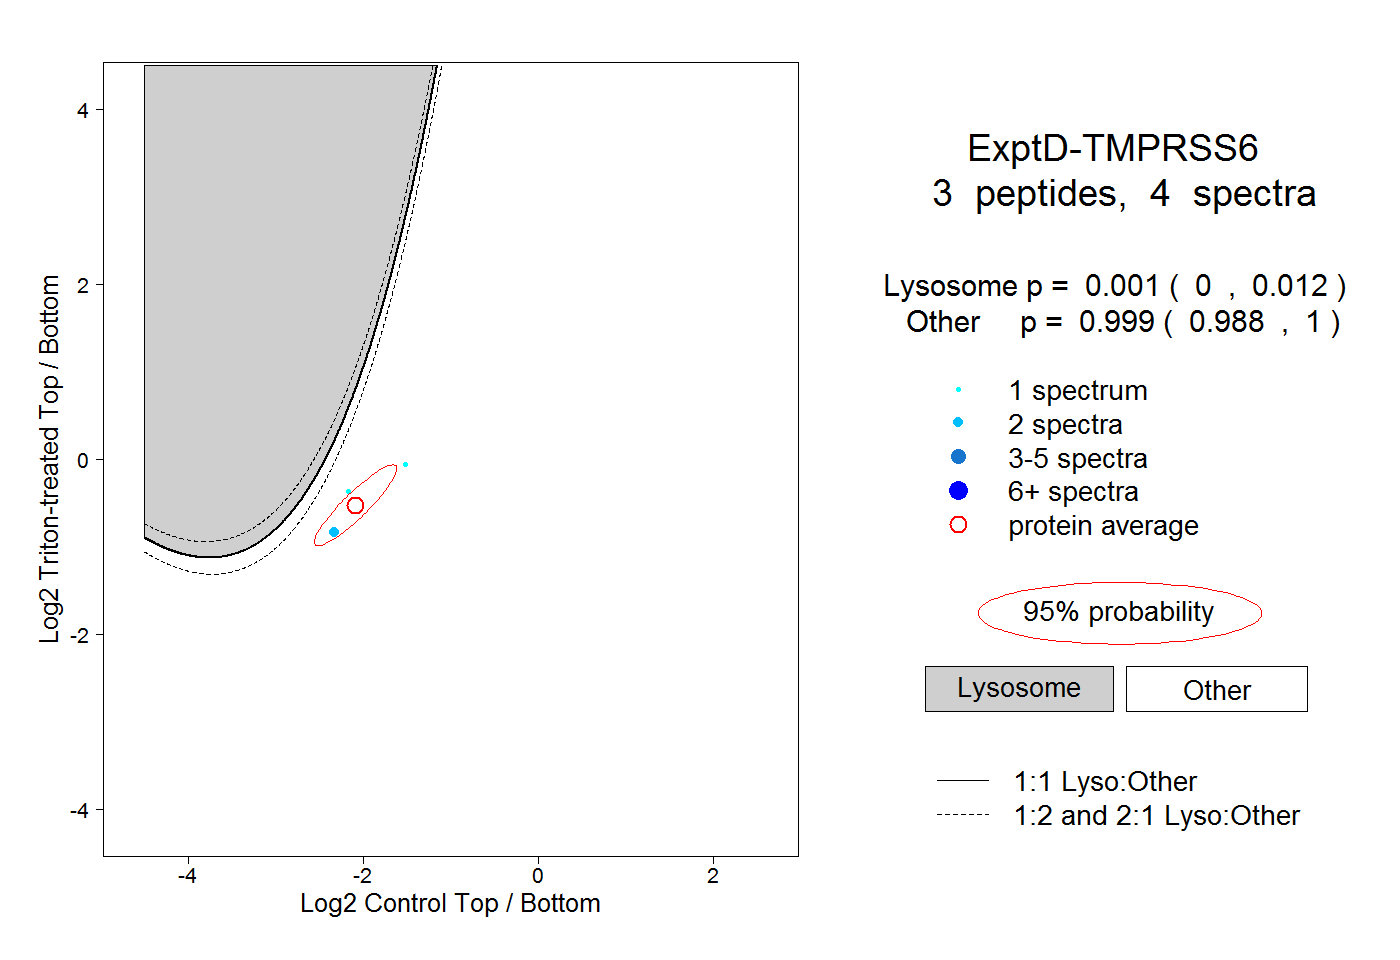
| Expt D |
3
peptides |
4
spectra |
 |
|
0.001
0.000 | 0.012 |
|
|
|
|
|
|
|
0.999
0.988 | 1.000 |