 15
15peptides
spectra
0.000 | 0.000
0.217 | 0.240
0.000 | 0.000
0.068 | 0.098
0.000 | 0.000
0.666 | 0.702
0.000 | 0.000
0.000 | 0.000
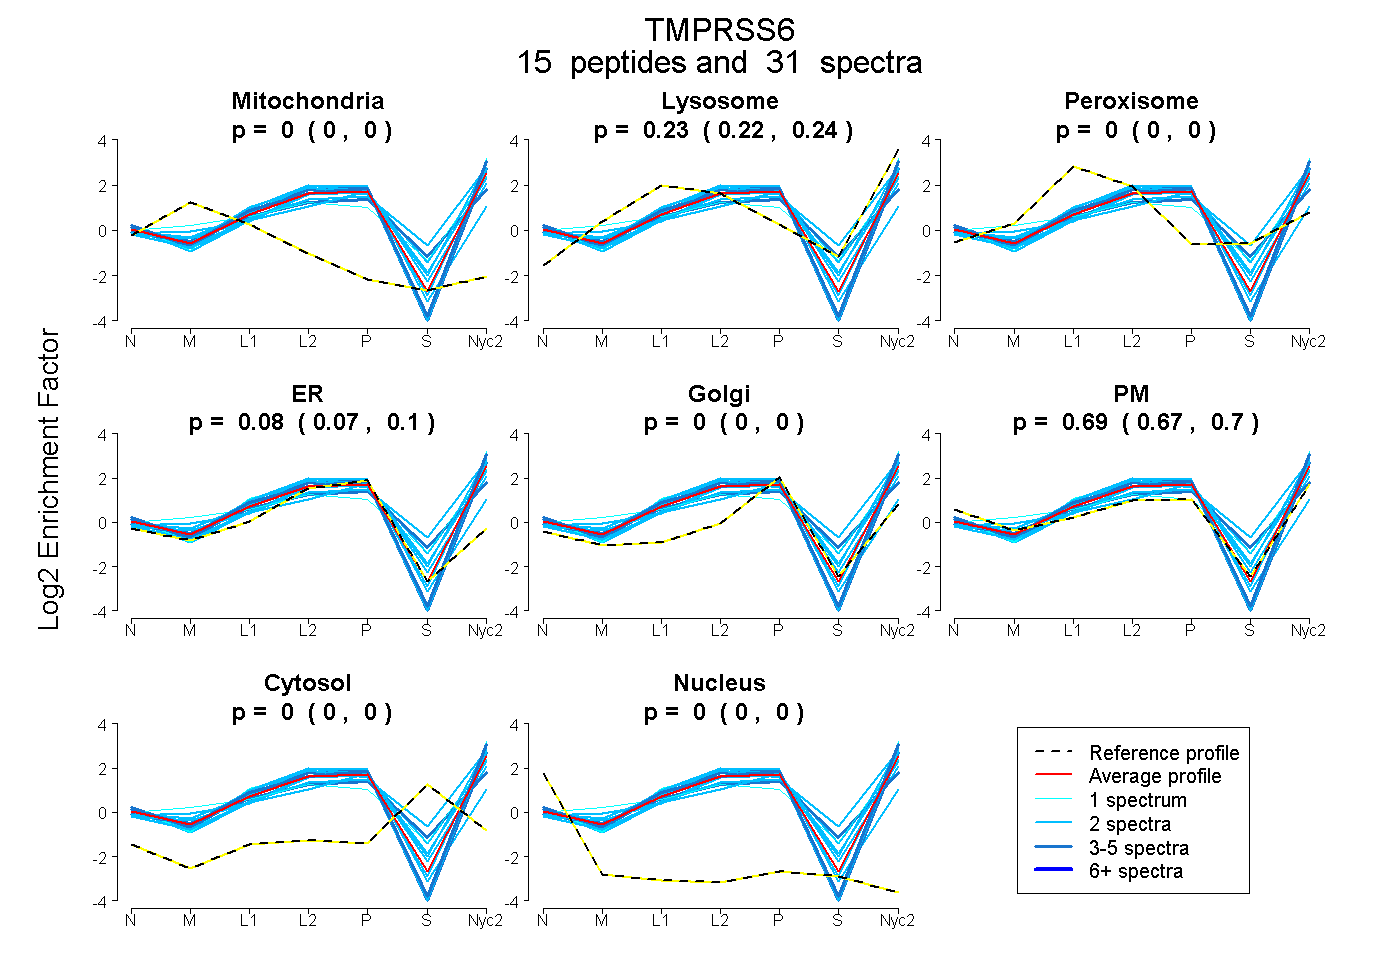
| Plot | Mito | Lyso | Perox | ER | Golgi | PM | Cytosol | Nucleus | |||||
| Expt A |
15 peptides |
31 spectra |
|
0.000 0.000 | 0.000 |
0.230 0.217 | 0.240 |
0.000 0.000 | 0.000 |
0.085 0.068 | 0.098 |
0.000 0.000 | 0.000 |
0.686 0.666 | 0.702 |
0.000 0.000 | 0.000 |
0.000 0.000 | 0.000 |
| 3 spectra, MLCAGYR | 0.000 | 0.284 | 0.051 | 0.132 | 0.115 | 0.363 | 0.056 | 0.000 | ||
| 2 spectra, YQVTPR | 0.000 | 0.311 | 0.000 | 0.000 | 0.305 | 0.384 | 0.000 | 0.000 | ||
| 2 spectra, WPGEVSFK | 0.000 | 0.368 | 0.000 | 0.003 | 0.000 | 0.629 | 0.000 | 0.000 | ||
| 1 spectrum, VQLEWTR | 0.000 | 0.365 | 0.000 | 0.000 | 0.000 | 0.609 | 0.026 | 0.000 | ||
| 1 spectrum, EGGPGSSTLQK | 0.000 | 0.114 | 0.000 | 0.055 | 0.000 | 0.831 | 0.000 | 0.000 | ||
| 2 spectra, AMFQCQEDSTCISLPR | 0.000 | 0.277 | 0.000 | 0.269 | 0.000 | 0.455 | 0.000 | 0.000 | ||
| 2 spectra, VAMYDAAGPLEK | 0.000 | 0.156 | 0.000 | 0.000 | 0.000 | 0.844 | 0.000 | 0.000 | ||
| 2 spectra, TLQPYAER | 0.000 | 0.466 | 0.000 | 0.000 | 0.181 | 0.295 | 0.057 | 0.000 | ||
| 2 spectra, DCPNGLDER | 0.000 | 0.288 | 0.000 | 0.059 | 0.141 | 0.512 | 0.000 | 0.000 | ||
| 2 spectra, LITSVYGCSR | 0.000 | 0.187 | 0.000 | 0.026 | 0.000 | 0.787 | 0.000 | 0.000 | ||
| 2 spectra, MFQELVASTR | 0.000 | 0.284 | 0.000 | 0.072 | 0.000 | 0.644 | 0.000 | 0.000 | ||
| 1 spectrum, LDPQGFLR | 0.000 | 0.177 | 0.000 | 0.000 | 0.000 | 0.823 | 0.000 | 0.000 | ||
| 4 spectra, YSYVNPGQVLR | 0.000 | 0.173 | 0.000 | 0.000 | 0.000 | 0.827 | 0.000 | 0.000 | ||
| 3 spectra, LTLSPEVVR | 0.000 | 0.100 | 0.000 | 0.019 | 0.000 | 0.880 | 0.000 | 0.000 | ||
| 2 spectra, CFQLPCSTR | 0.000 | 0.022 | 0.000 | 0.518 | 0.000 | 0.460 | 0.000 | 0.000 |
| Plot | Mito | Lyso or Perox | ER | Golgi | PM | Cytosol | Nucleus | ||||||
| Expt B |
5 peptides |
10 spectra |
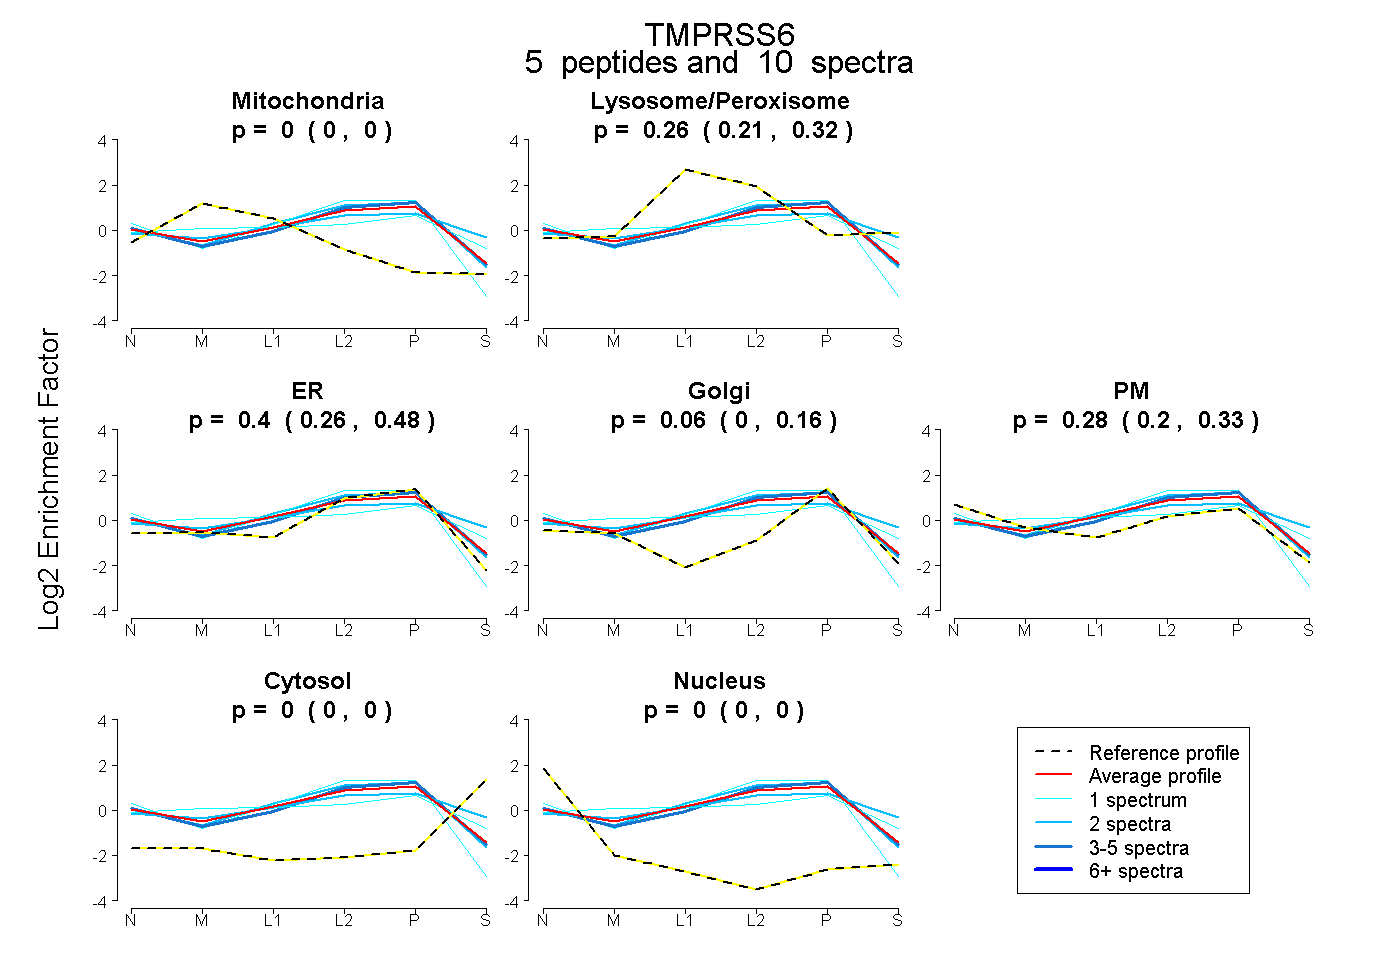 |
0.000 0.000 | 0.000 |
0.262 0.214 | 0.322 |
0.399 0.263 | 0.484 |
0.060 0.000 | 0.164 |
0.278 0.199 | 0.325 |
0.000 0.000 | 0.000 |
0.000 0.000 | 0.000 |
|||
| Plot | Lyso | Other | |||||||||||
| Expt C |
20 peptides |
69 spectra |
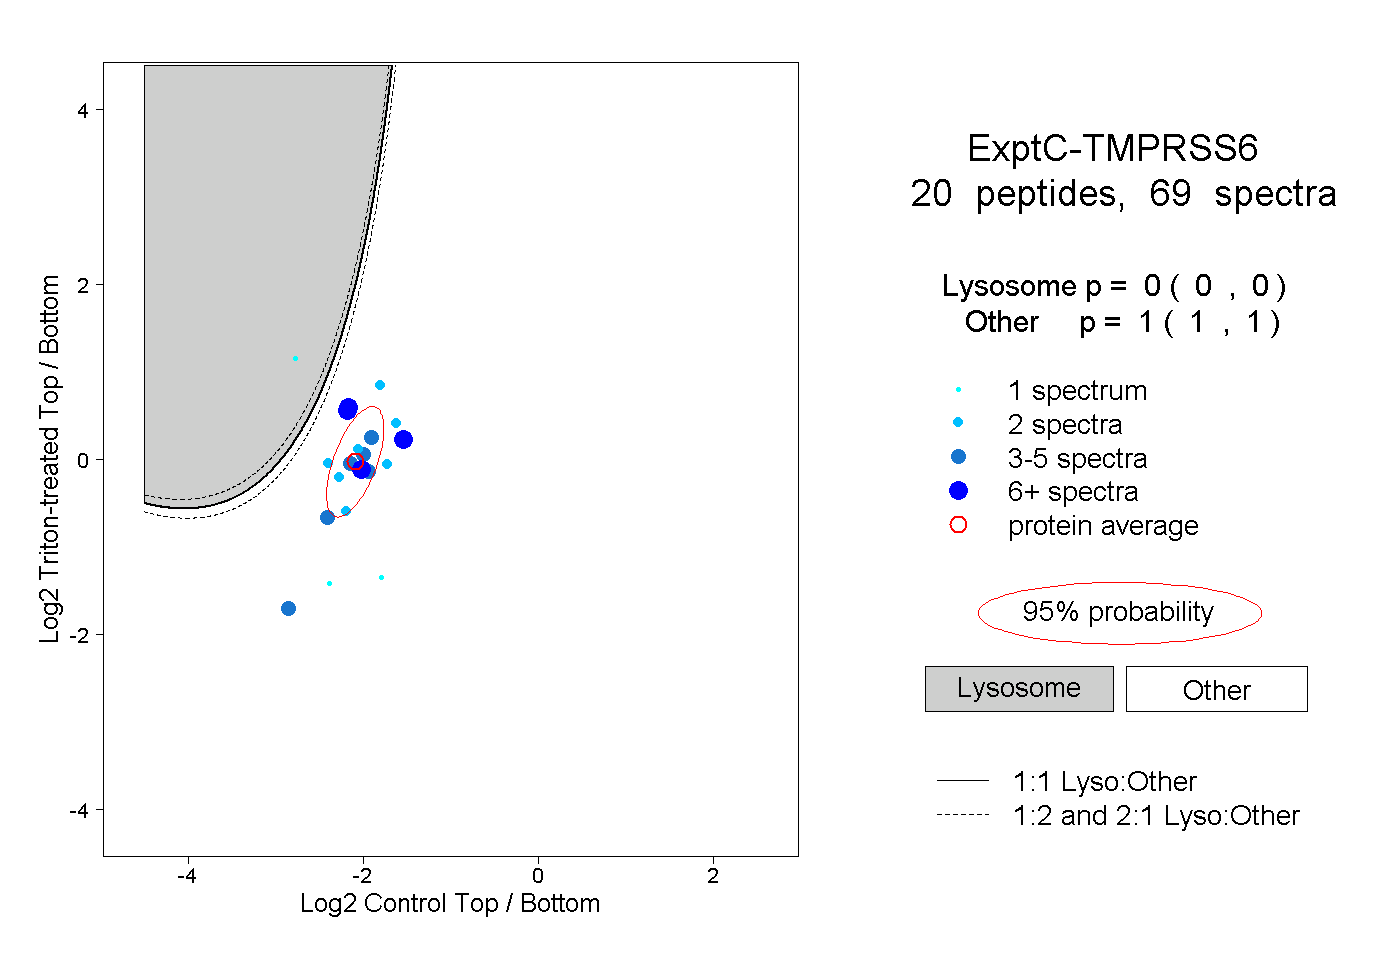 |
0.000 0.000 | 0.000 |
1.000 1.000 | 1.000 |
||||||||
| Plot | Lyso | Other | |||||||||||
| Expt D |
3 peptides |
4 spectra |
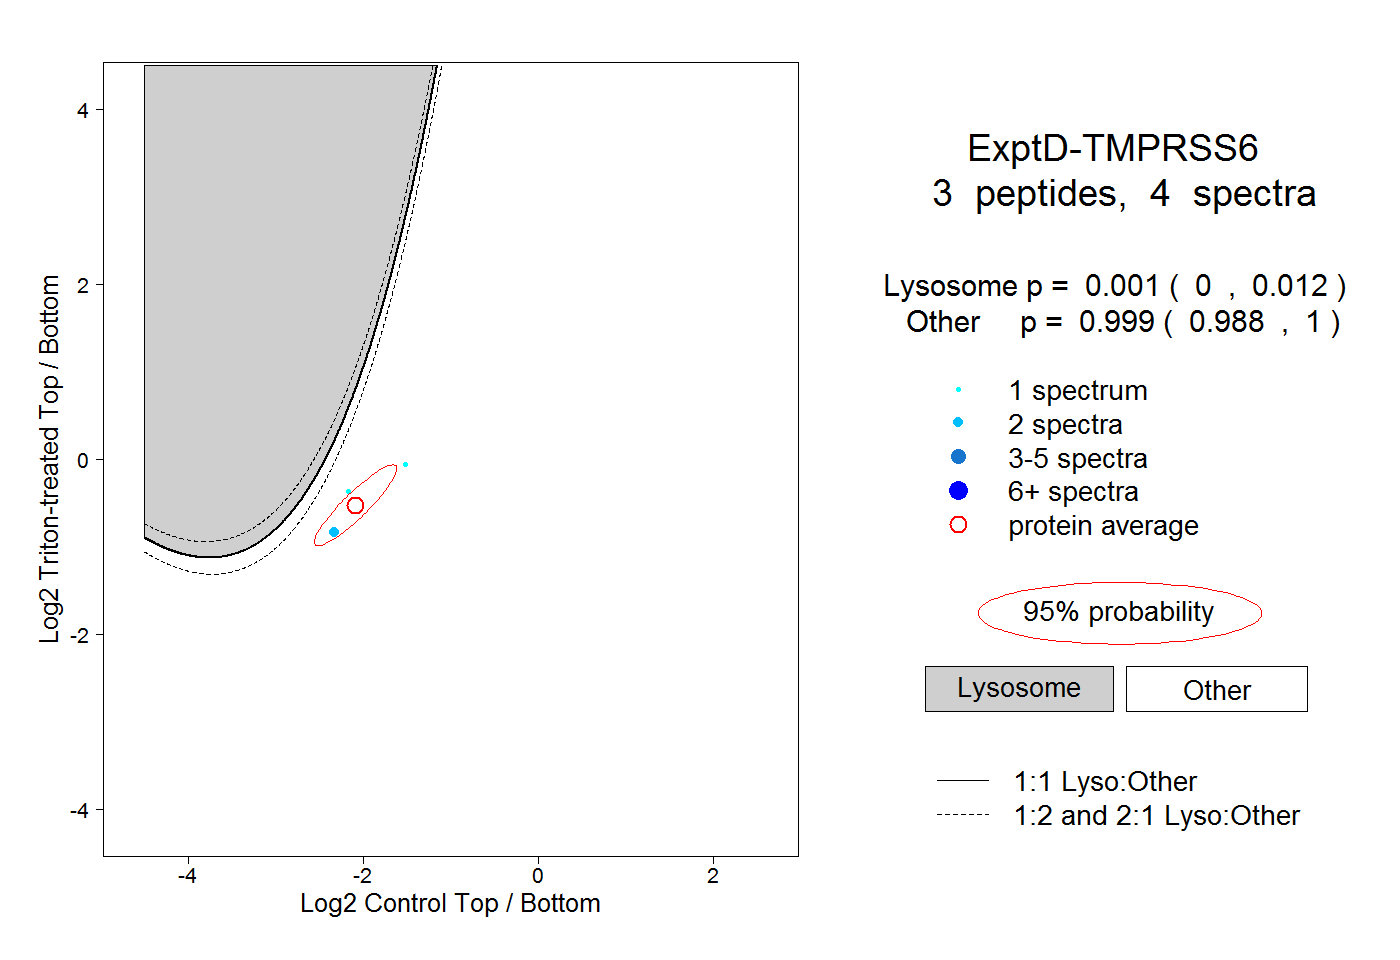 |
0.001 0.000 | 0.012 |
0.999 0.988 | 1.000 |