 11
11peptides
spectra
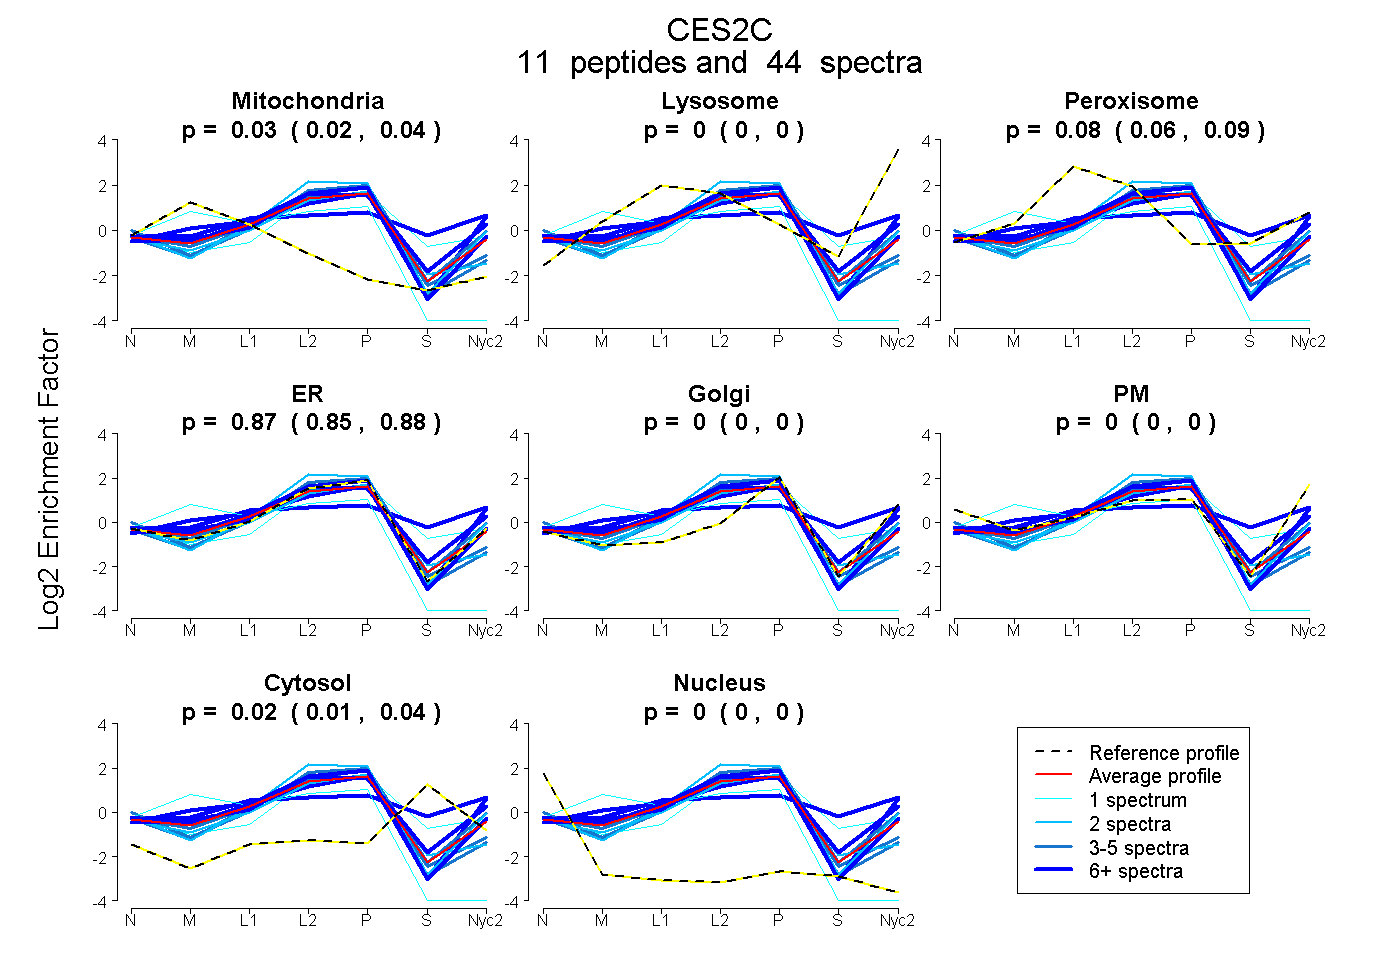
0.016 | 0.044
0.000 | 0.000
0.063 | 0.089
0.852 | 0.877
0.000 | 0.000
0.000 | 0.000
0.013 | 0.036
0.000 | 0.000
12peptides
spectra
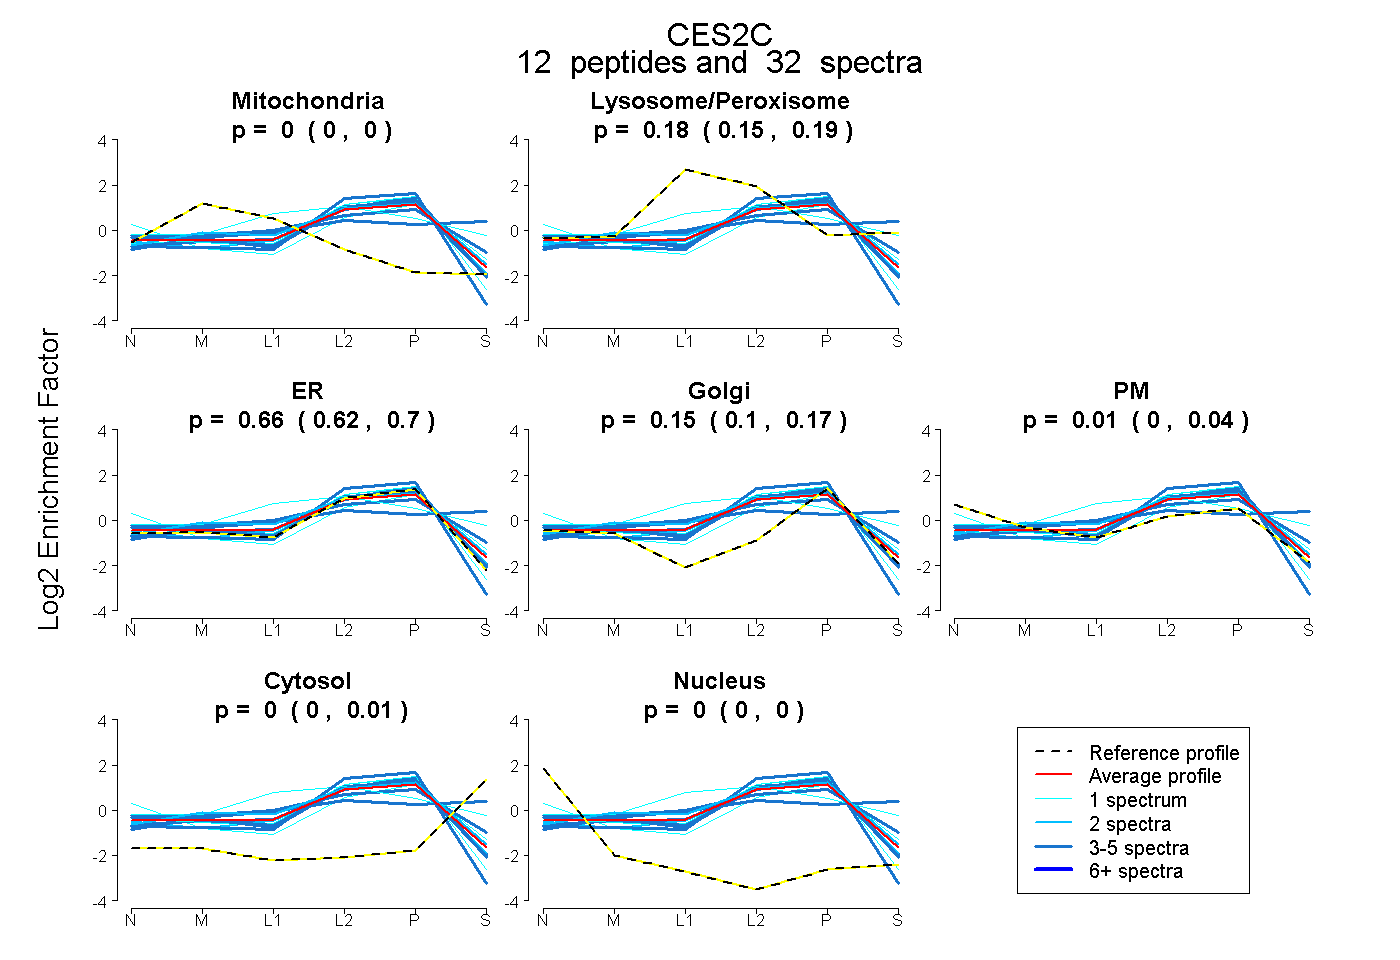
0.000 | 0.000
0.150 | 0.194
0.622 | 0.699
0.100 | 0.173
0.000 | 0.042
0.000 | 0.013
0.000 | 0.000
13peptides
spectra
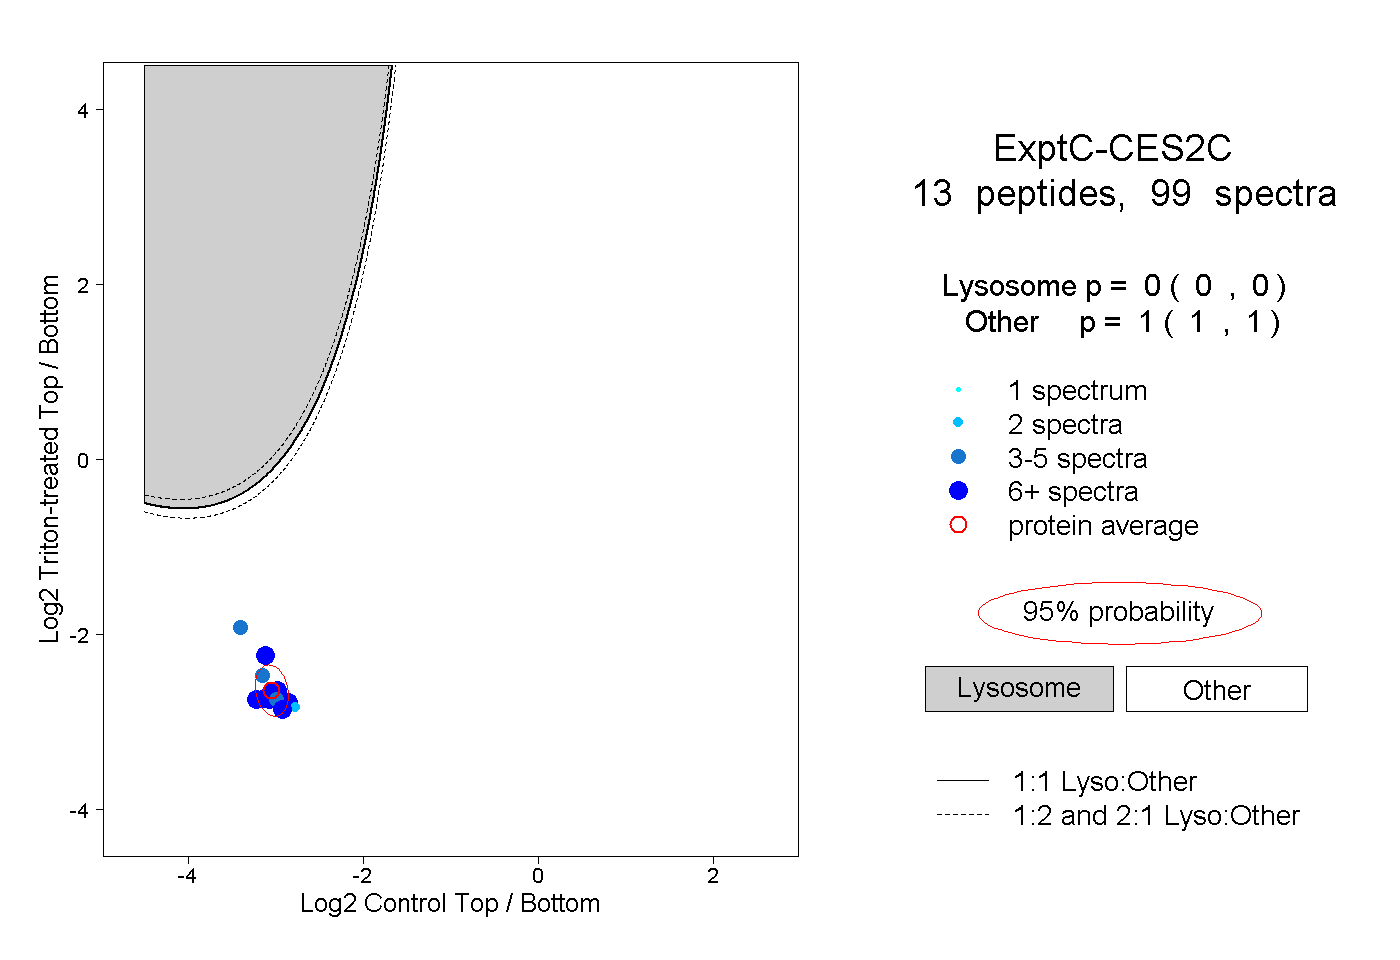
0.000 | 0.000
1.000 | 1.000
4peptides
spectra
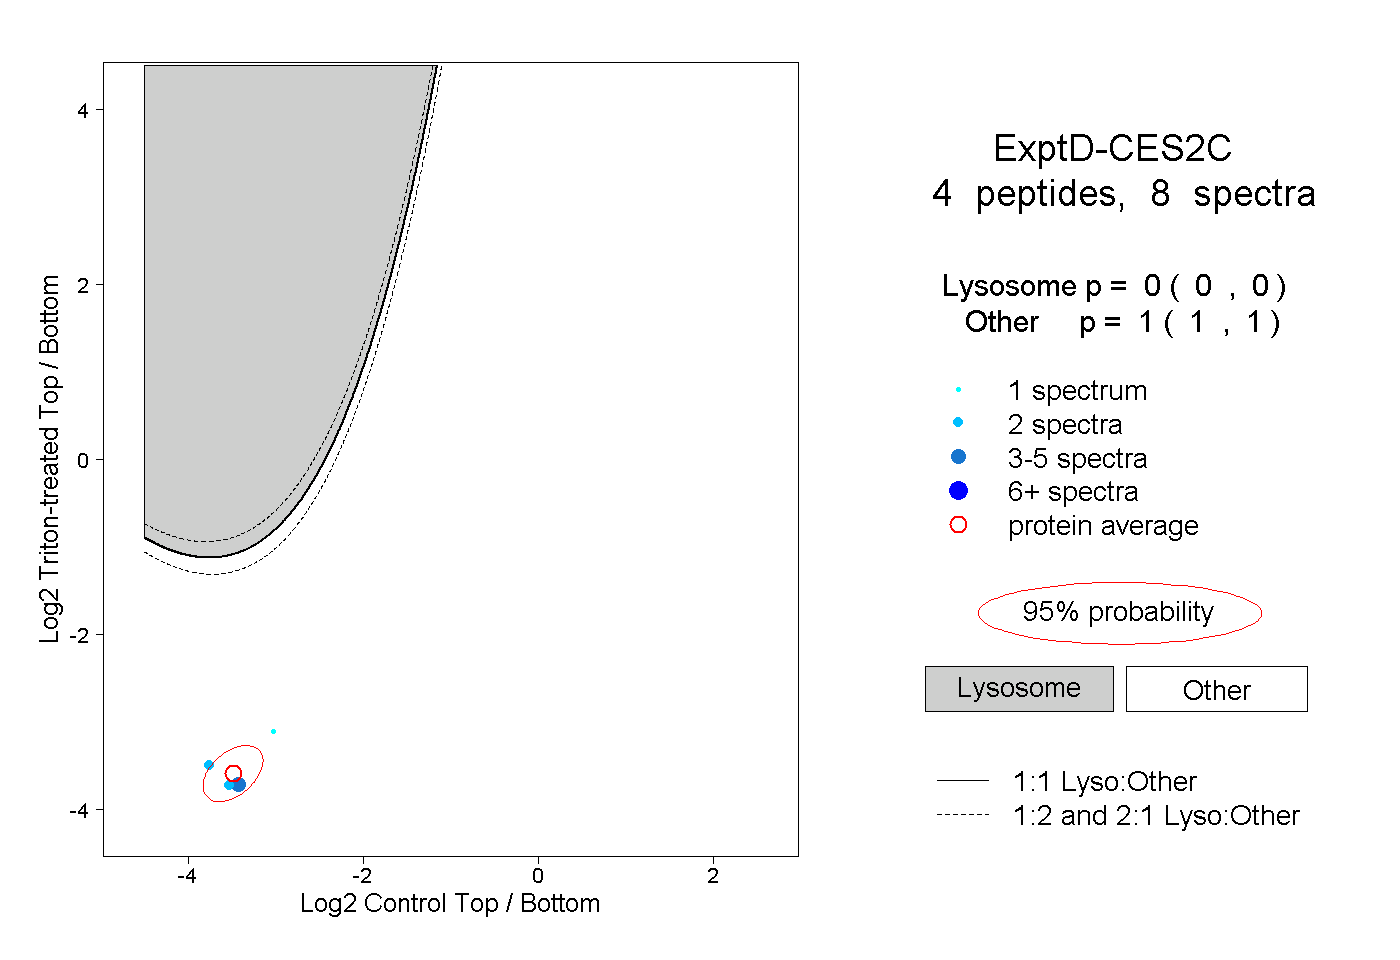
0.000 | 0.000
1.000 | 1.000