 11
11peptides
spectra
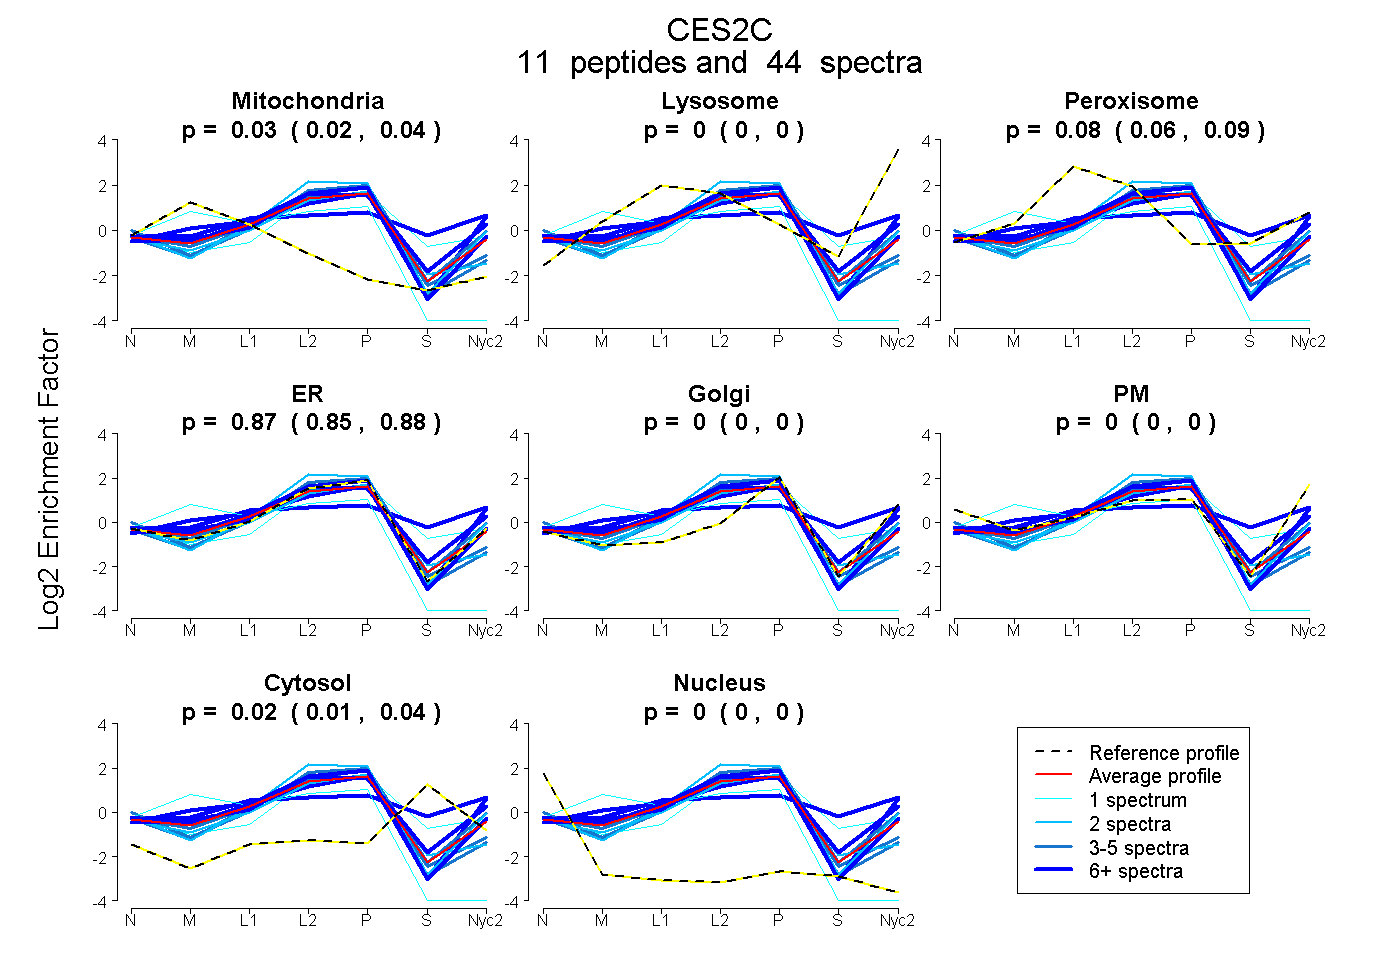
0.016 | 0.044
0.000 | 0.000
0.063 | 0.089
0.852 | 0.877
0.000 | 0.000
0.000 | 0.000
0.013 | 0.036
0.000 | 0.000
| Plot | Mito | Lyso | Perox | ER | Golgi | PM | Cytosol | Nucleus | |||||
| Expt A |
11 peptides |
44 spectra |
|
0.031 0.016 | 0.044 |
0.000 0.000 | 0.000 |
0.078 0.063 | 0.089 |
0.866 0.852 | 0.877 |
0.000 0.000 | 0.000 |
0.000 0.000 | 0.000 |
0.025 0.013 | 0.036 |
0.000 0.000 | 0.000 |
| 7 spectra, ENLQAVLK | 0.052 | 0.140 | 0.000 | 0.618 | 0.031 | 0.159 | 0.000 | 0.000 | ||
| 7 spectra, VDFTEEEK | 0.006 | 0.001 | 0.014 | 0.978 | 0.000 | 0.000 | 0.000 | 0.000 | ||
| 5 spectra, AGVHTFLGIPFAK | 0.081 | 0.000 | 0.000 | 0.900 | 0.000 | 0.000 | 0.000 | 0.019 | ||
| 6 spectra, WVQQNIAHFGGNPNR | 0.000 | 0.143 | 0.045 | 0.758 | 0.000 | 0.000 | 0.054 | 0.000 | ||
| 4 spectra, NVRPPHVK | 0.000 | 0.039 | 0.000 | 0.909 | 0.017 | 0.000 | 0.035 | 0.000 | ||
| 2 spectra, TTHTGQVR | 0.000 | 0.001 | 0.000 | 0.999 | 0.000 | 0.000 | 0.000 | 0.000 | ||
| 2 spectra, SGAEILVINK | 0.024 | 0.000 | 0.000 | 0.859 | 0.000 | 0.000 | 0.083 | 0.034 | ||
| 1 spectrum, MIPAVVDGEFLPR | 0.491 | 0.000 | 0.000 | 0.502 | 0.000 | 0.000 | 0.000 | 0.006 | ||
| 3 spectra, LSGCEATDSETLVR | 0.000 | 0.000 | 0.000 | 0.953 | 0.000 | 0.000 | 0.000 | 0.047 | ||
| 1 spectrum, ADHADEVPFVFGSFFWGIK | 0.000 | 0.004 | 0.024 | 0.736 | 0.000 | 0.000 | 0.236 | 0.000 | ||
| 6 spectra, FAPPEDPEPWSGVR | 0.000 | 0.025 | 0.425 | 0.000 | 0.344 | 0.034 | 0.173 | 0.000 |
| Plot | Mito | Lyso or Perox | ER | Golgi | PM | Cytosol | Nucleus | ||||||
| Expt B |
12 peptides |
32 spectra |
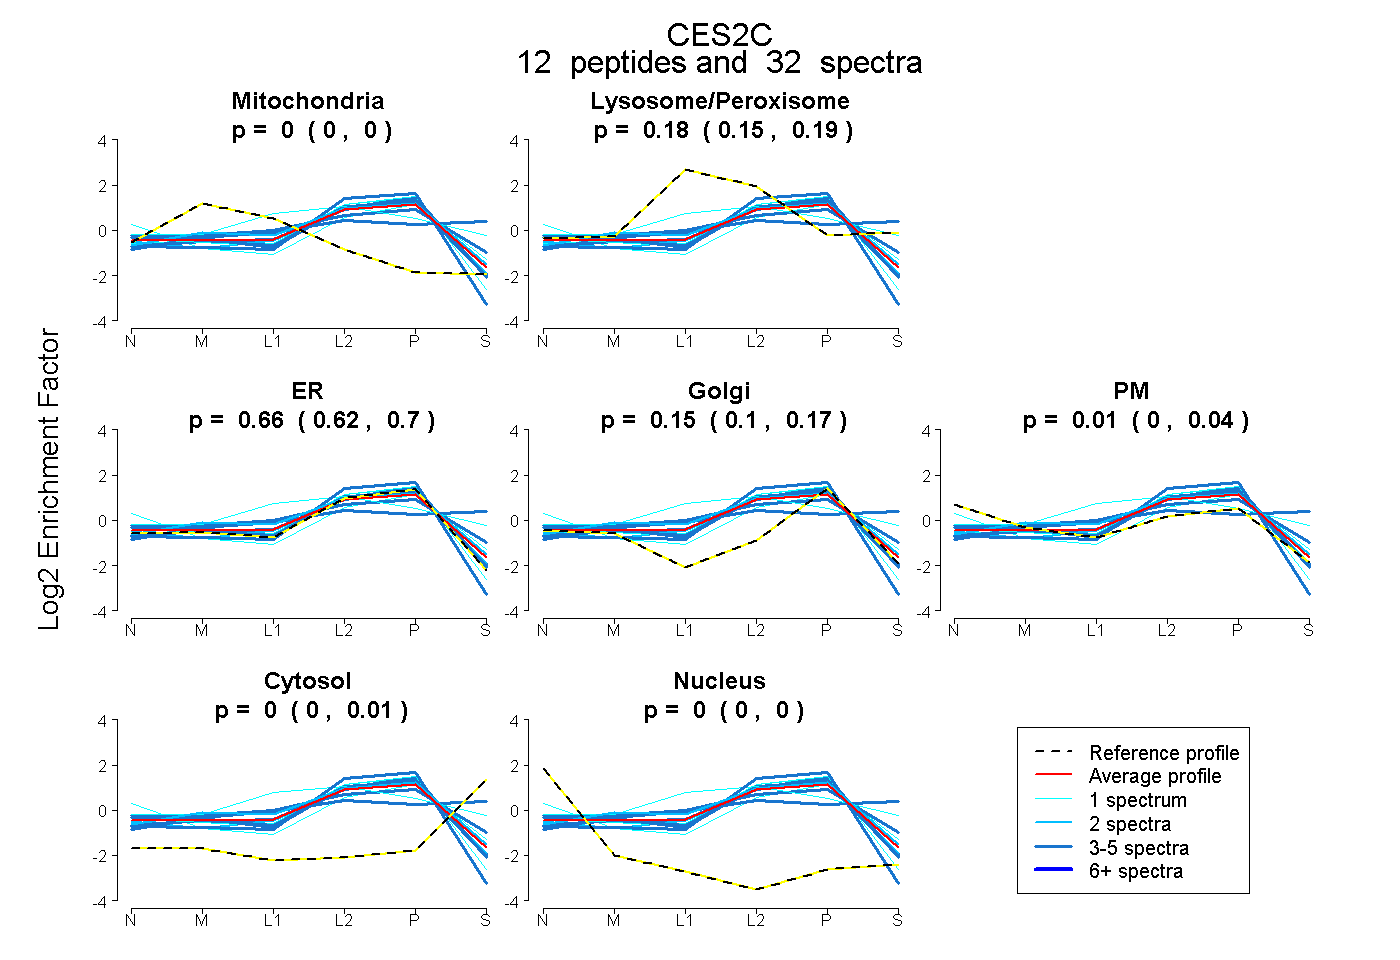 |
0.000 0.000 | 0.000 |
0.178 0.150 | 0.194 |
0.657 0.622 | 0.699 |
0.151 0.100 | 0.173 |
0.013 0.000 | 0.042 |
0.002 0.000 | 0.013 |
0.000 0.000 | 0.000 |
|||
| Plot | Lyso | Other | |||||||||||
| Expt C |
13 peptides |
99 spectra |
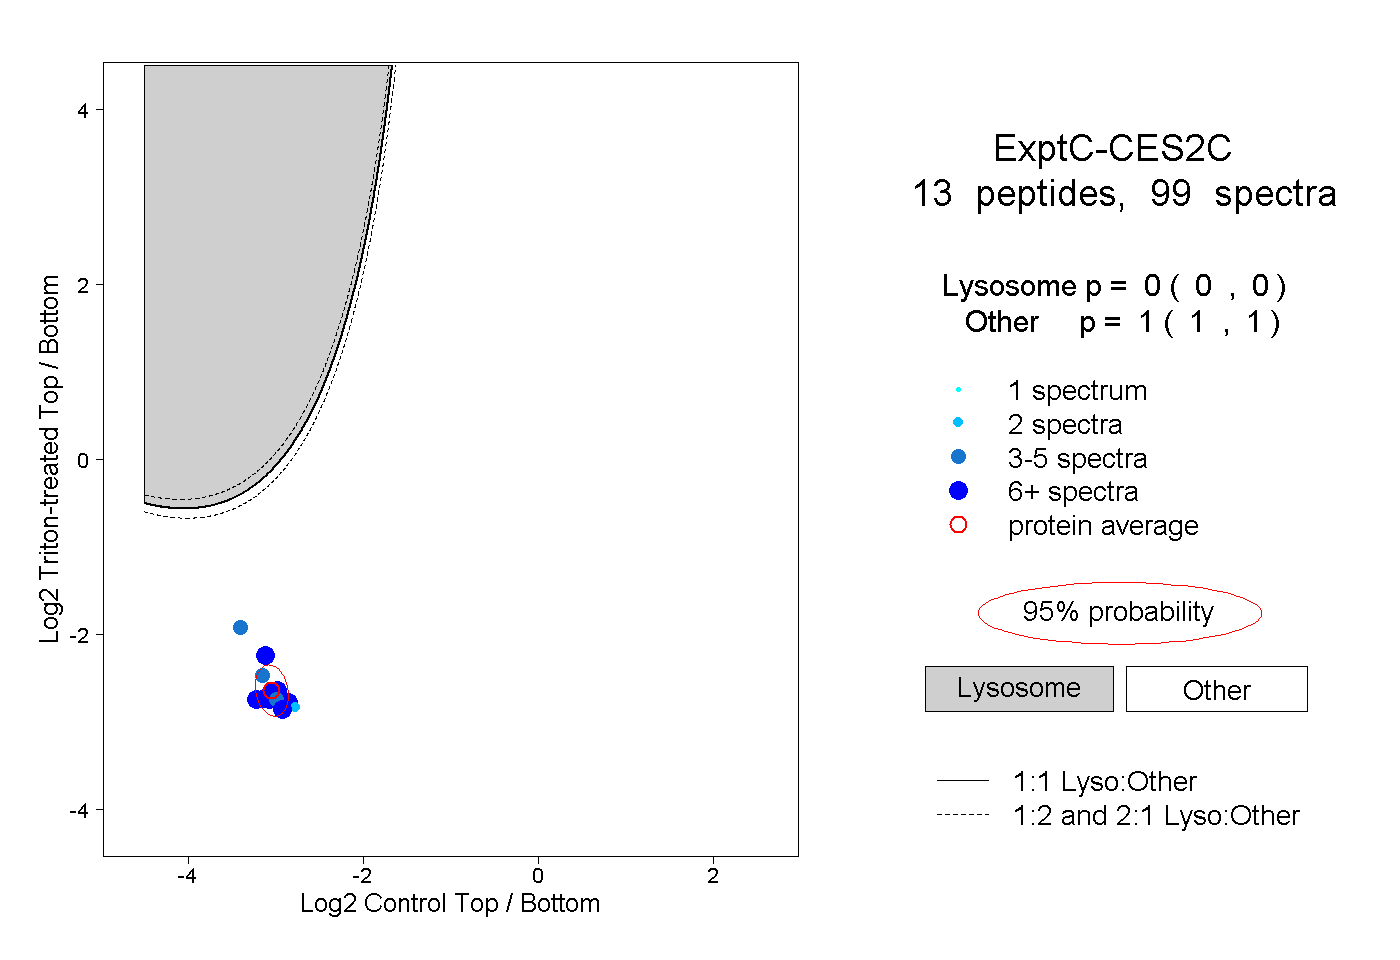 |
0.000 0.000 | 0.000 |
1.000 1.000 | 1.000 |
||||||||
| Plot | Lyso | Other | |||||||||||
| Expt D |
4 peptides |
8 spectra |
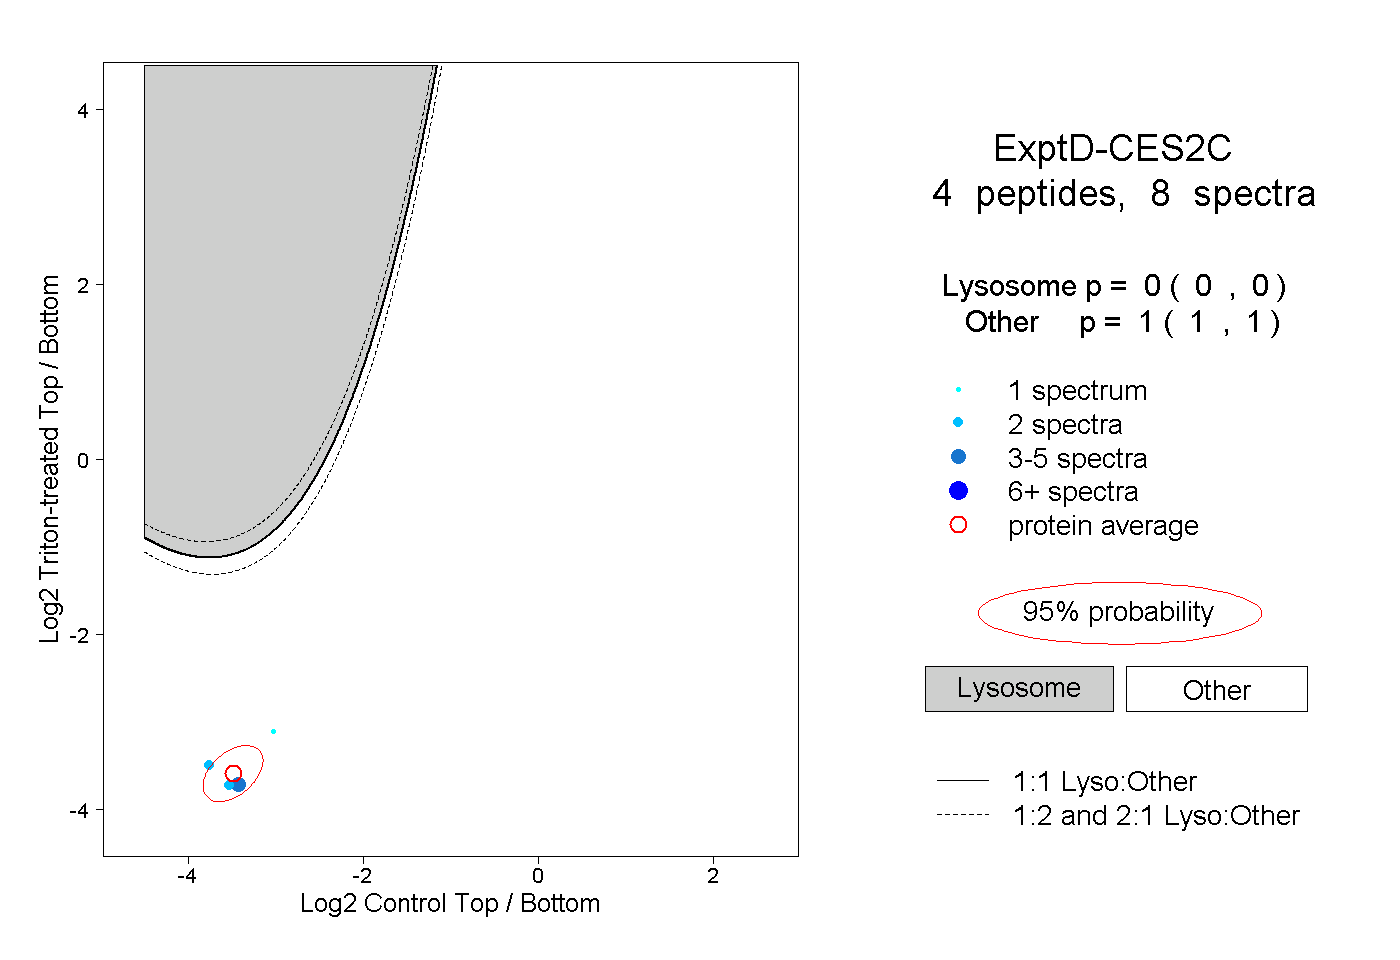 |
0.000 0.000 | 0.000 |
1.000 1.000 | 1.000 |