 12
12peptides
spectra
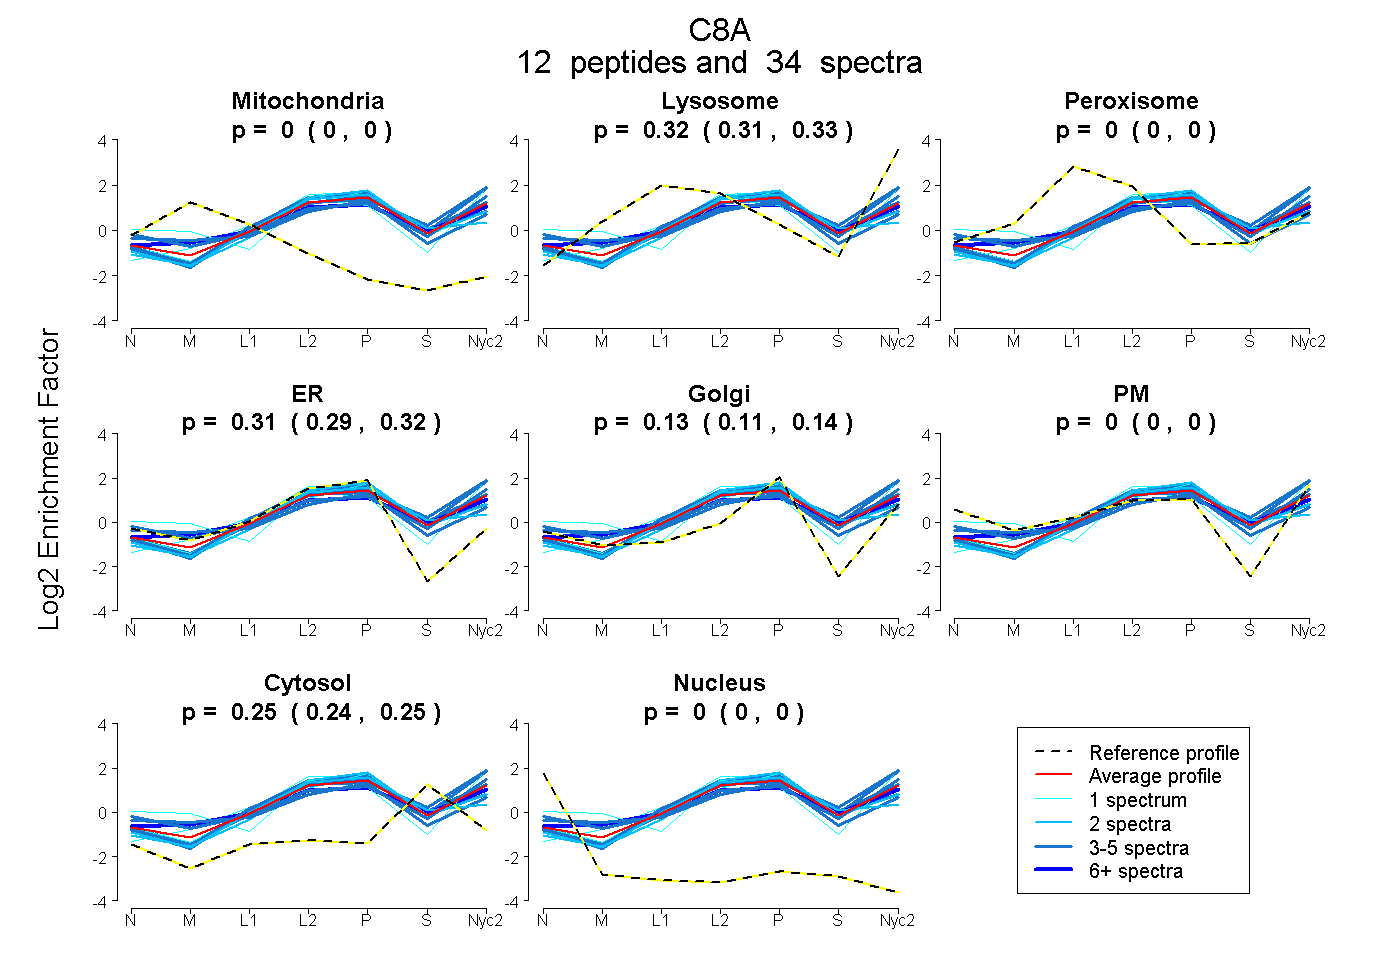
0.000 | 0.000
0.311 | 0.326
0.000 | 0.000
0.289 | 0.322
0.111 | 0.140
0.000 | 0.000
0.241 | 0.252
0.000 | 0.000
3peptides
spectra
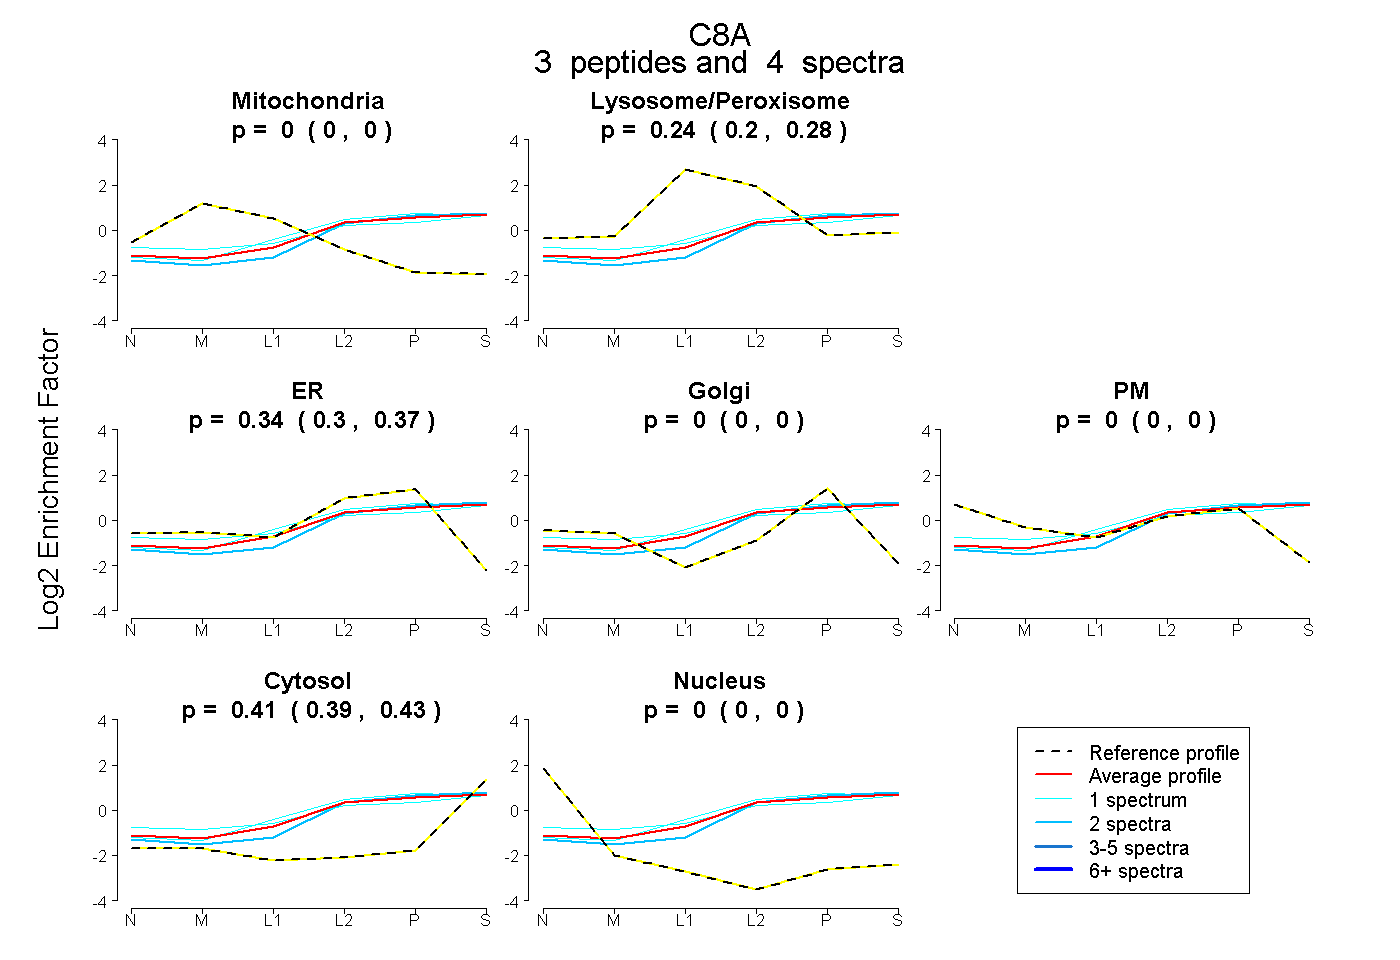
0.000 | 0.000
0.199 | 0.280
0.305 | 0.371
0.000 | 0.000
0.000 | 0.000
0.392 | 0.431
0.000 | 0.000
14peptides
spectra
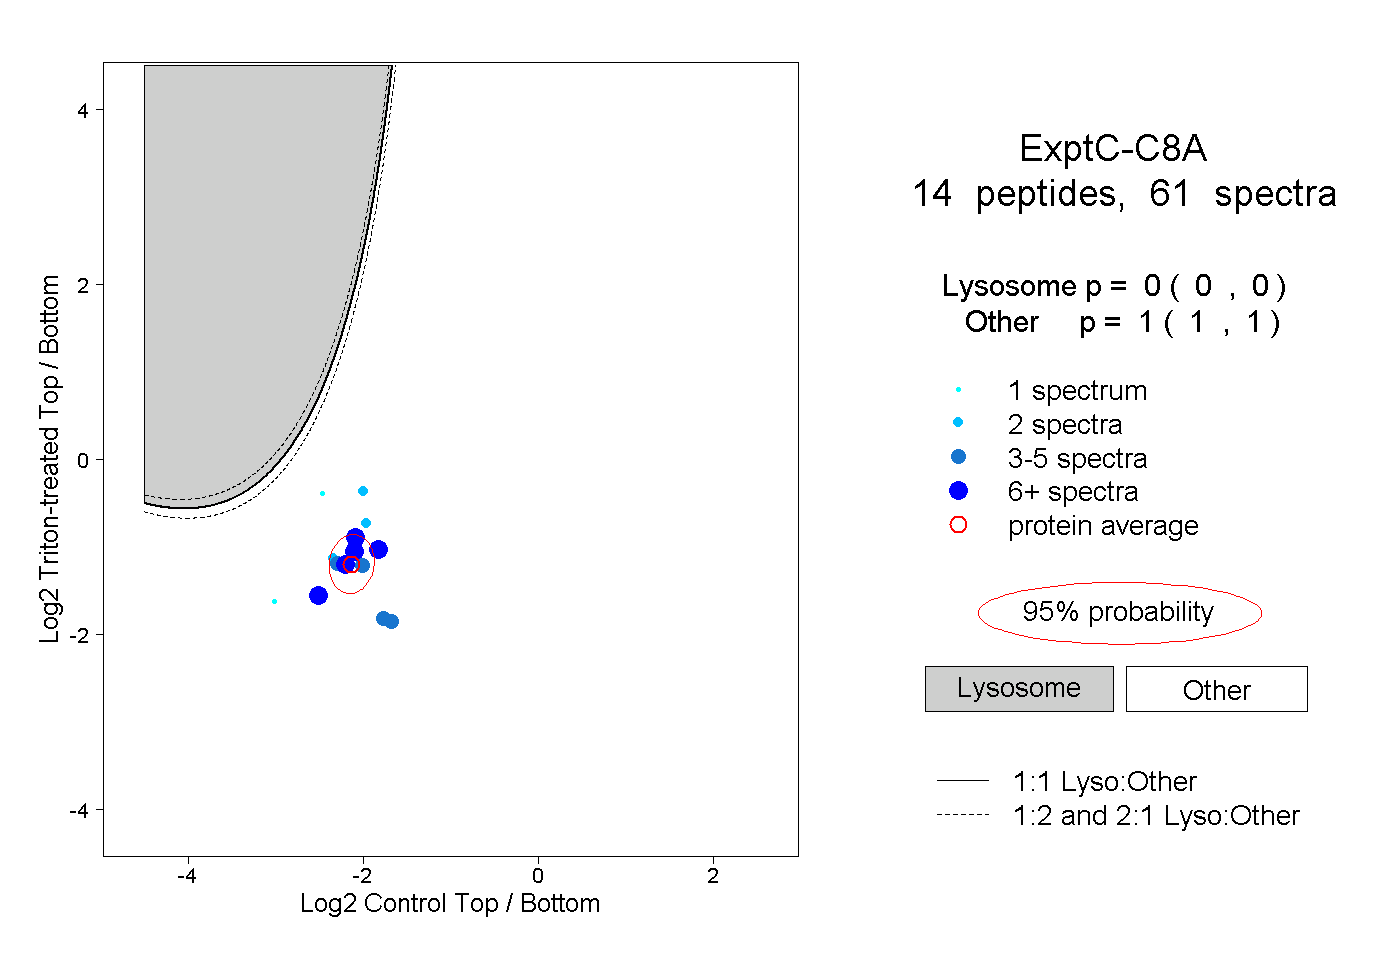
0.000 | 0.000
1.000 | 1.000
4peptides
spectra
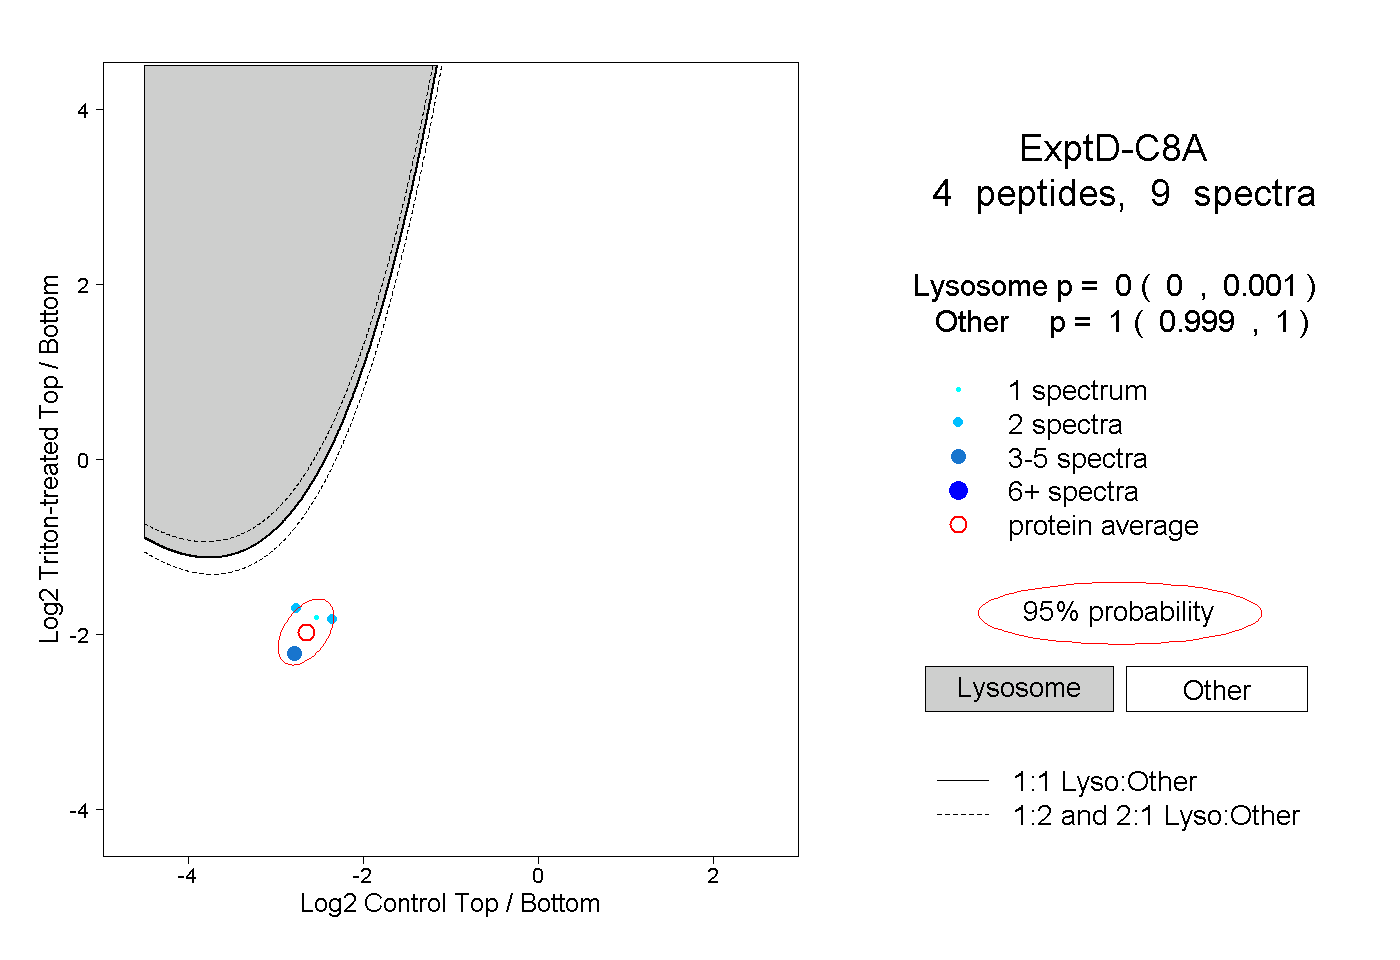
0.000 | 0.001
0.999 | 1.000