 12
12peptides
spectra
0.000 | 0.000
0.311 | 0.326
0.000 | 0.000
0.289 | 0.322
0.111 | 0.140
0.000 | 0.000
0.241 | 0.252
0.000 | 0.000
| Plot | Mito | Lyso | Perox | ER | Golgi | PM | Cytosol | Nucleus | |||||
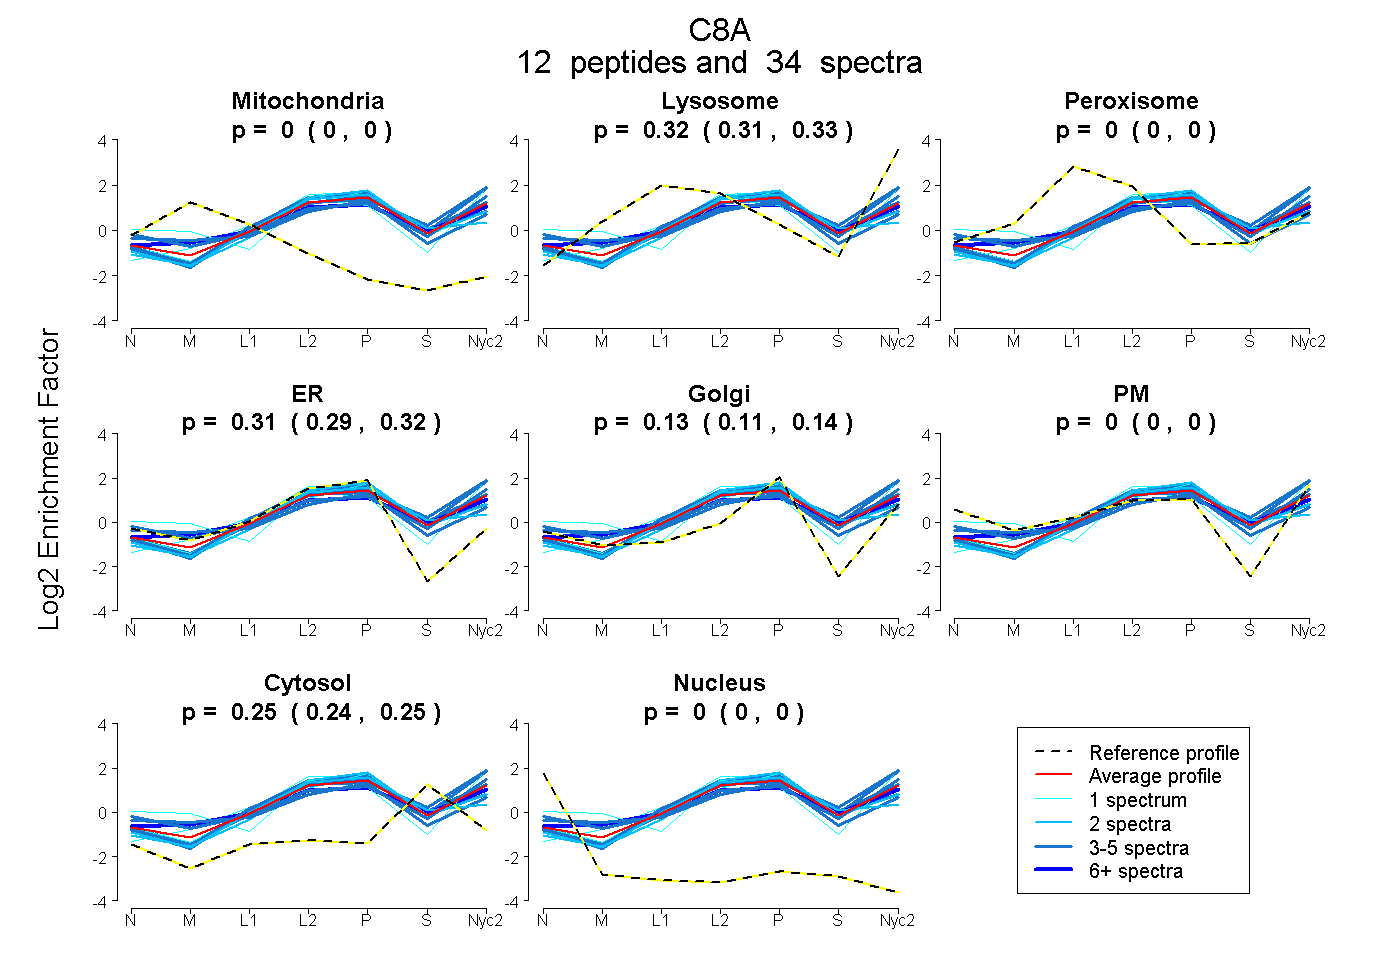
| Expt A |
12 peptides |
34 spectra |
|
0.000 0.000 | 0.000 |
0.320 0.311 | 0.326 |
0.000 0.000 | 0.000 |
0.307 0.289 | 0.322 |
0.127 0.111 | 0.140 |
0.000 0.000 | 0.000 |
0.247 0.241 | 0.252 |
0.000 0.000 | 0.000 |
| 1 spectrum, QGPACESMVLEAMEGAK | 0.000 | 0.164 | 0.000 | 0.000 | 0.116 | 0.598 | 0.121 | 0.000 | ||
| 6 spectra, LYYGEDEK | 0.000 | 0.346 | 0.000 | 0.298 | 0.081 | 0.000 | 0.276 | 0.000 | ||
| 4 spectra, LQYDPTCER | 0.000 | 0.338 | 0.000 | 0.298 | 0.087 | 0.000 | 0.277 | 0.000 | ||
| 2 spectra, VIEDDCR | 0.000 | 0.189 | 0.000 | 0.490 | 0.000 | 0.000 | 0.321 | 0.000 | ||
| 4 spectra, DLAVEDIISR | 0.000 | 0.408 | 0.000 | 0.166 | 0.216 | 0.000 | 0.210 | 0.000 | ||
| 3 spectra, QYEPIPGSER | 0.000 | 0.434 | 0.000 | 0.102 | 0.199 | 0.000 | 0.265 | 0.000 | ||
| 3 spectra, SLQTQAC | 0.000 | 0.121 | 0.125 | 0.199 | 0.315 | 0.054 | 0.187 | 0.000 | ||
| 1 spectrum, CIGGGVGLQFGEK | 0.000 | 0.263 | 0.000 | 0.502 | 0.000 | 0.000 | 0.235 | 0.000 | ||
| 3 spectra, VQTAHFK | 0.000 | 0.256 | 0.000 | 0.081 | 0.102 | 0.324 | 0.236 | 0.000 | ||
| 2 spectra, QAQCGQDFQCR | 0.000 | 0.224 | 0.000 | 0.431 | 0.078 | 0.000 | 0.266 | 0.000 | ||
| 4 spectra, ANCDSPTPCLR | 0.000 | 0.250 | 0.000 | 0.407 | 0.047 | 0.000 | 0.295 | 0.000 | ||
| 1 spectrum, KPYNFLK | 0.000 | 0.403 | 0.000 | 0.197 | 0.218 | 0.000 | 0.182 | 0.000 |
| Plot | Mito | Lyso or Perox | ER | Golgi | PM | Cytosol | Nucleus | ||||||
| Expt B |
3 peptides |
4 spectra |
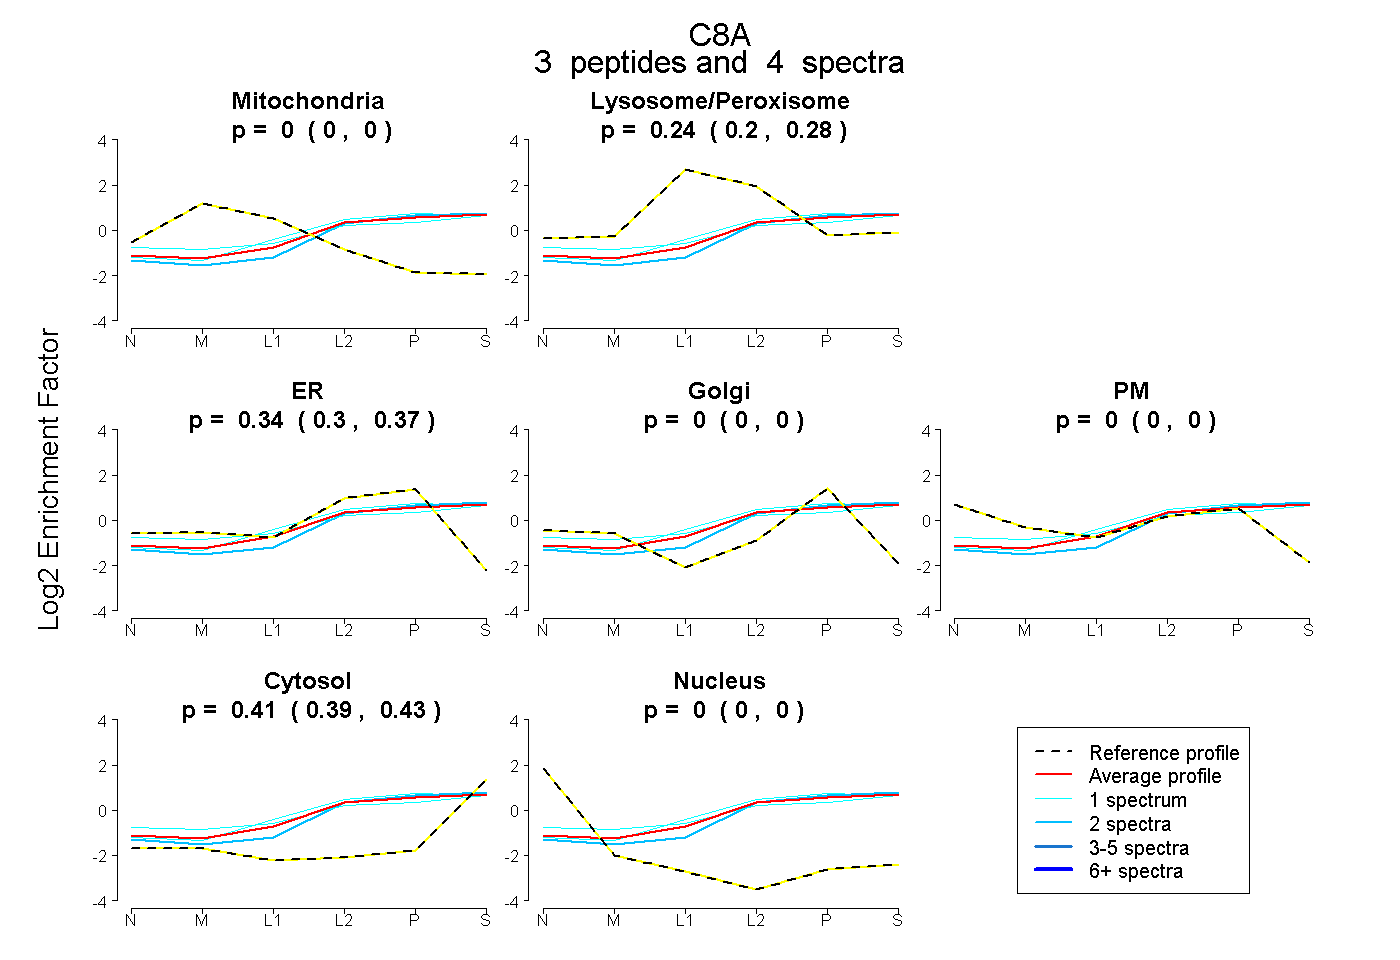 |
0.000 0.000 | 0.000 |
0.244 0.199 | 0.280 |
0.342 0.305 | 0.371 |
0.000 0.000 | 0.000 |
0.000 0.000 | 0.000 |
0.414 0.392 | 0.431 |
0.000 0.000 | 0.000 |
|||
| Plot | Lyso | Other | |||||||||||
| Expt C |
14 peptides |
61 spectra |
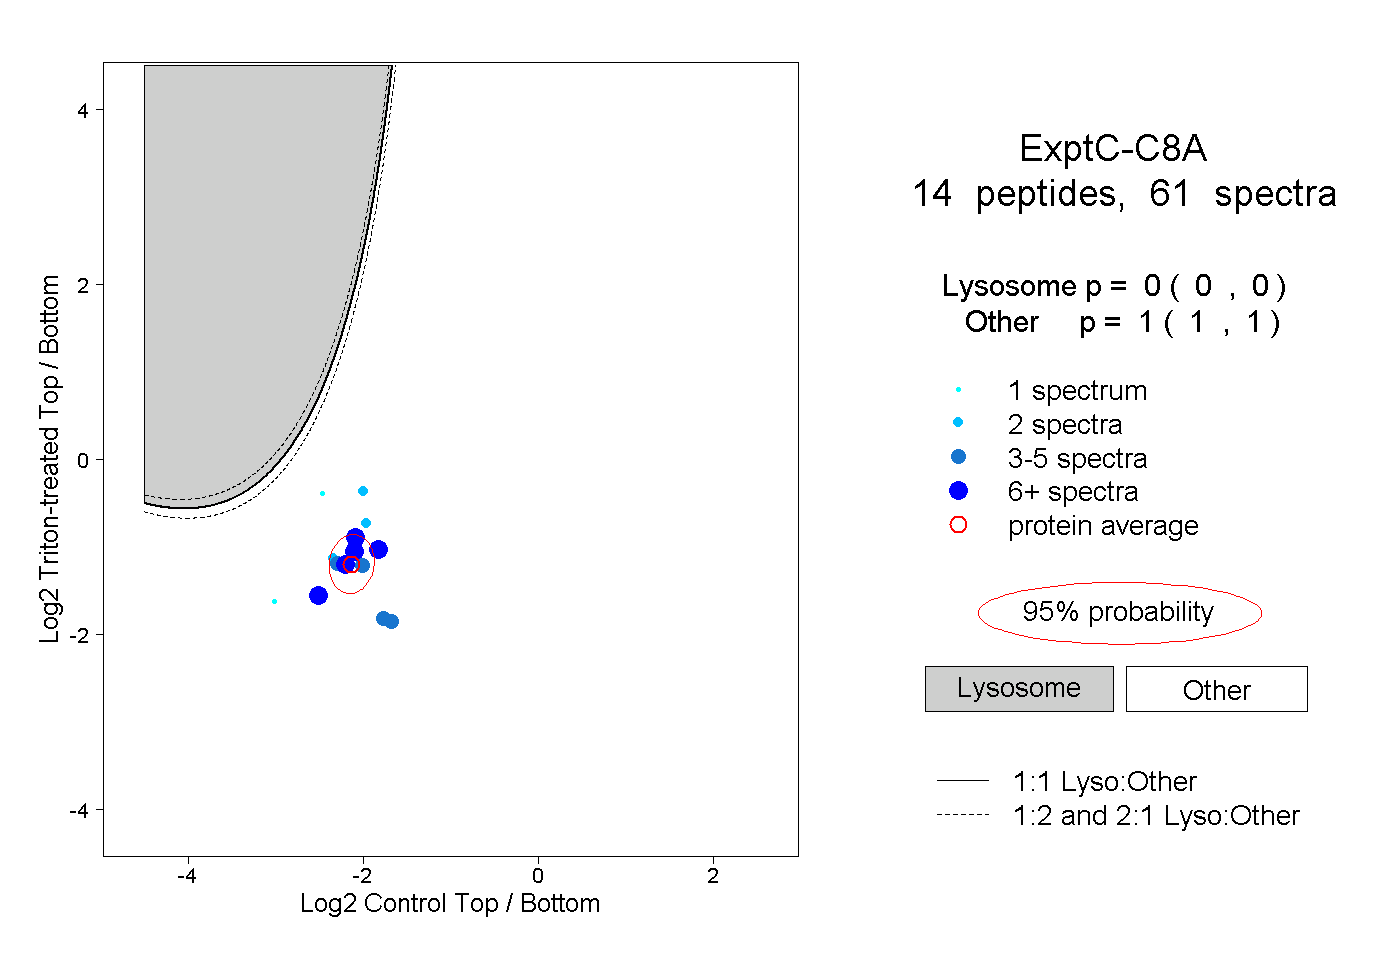 |
0.000 0.000 | 0.000 |
1.000 1.000 | 1.000 |
||||||||
| Plot | Lyso | Other | |||||||||||
| Expt D |
4 peptides |
9 spectra |
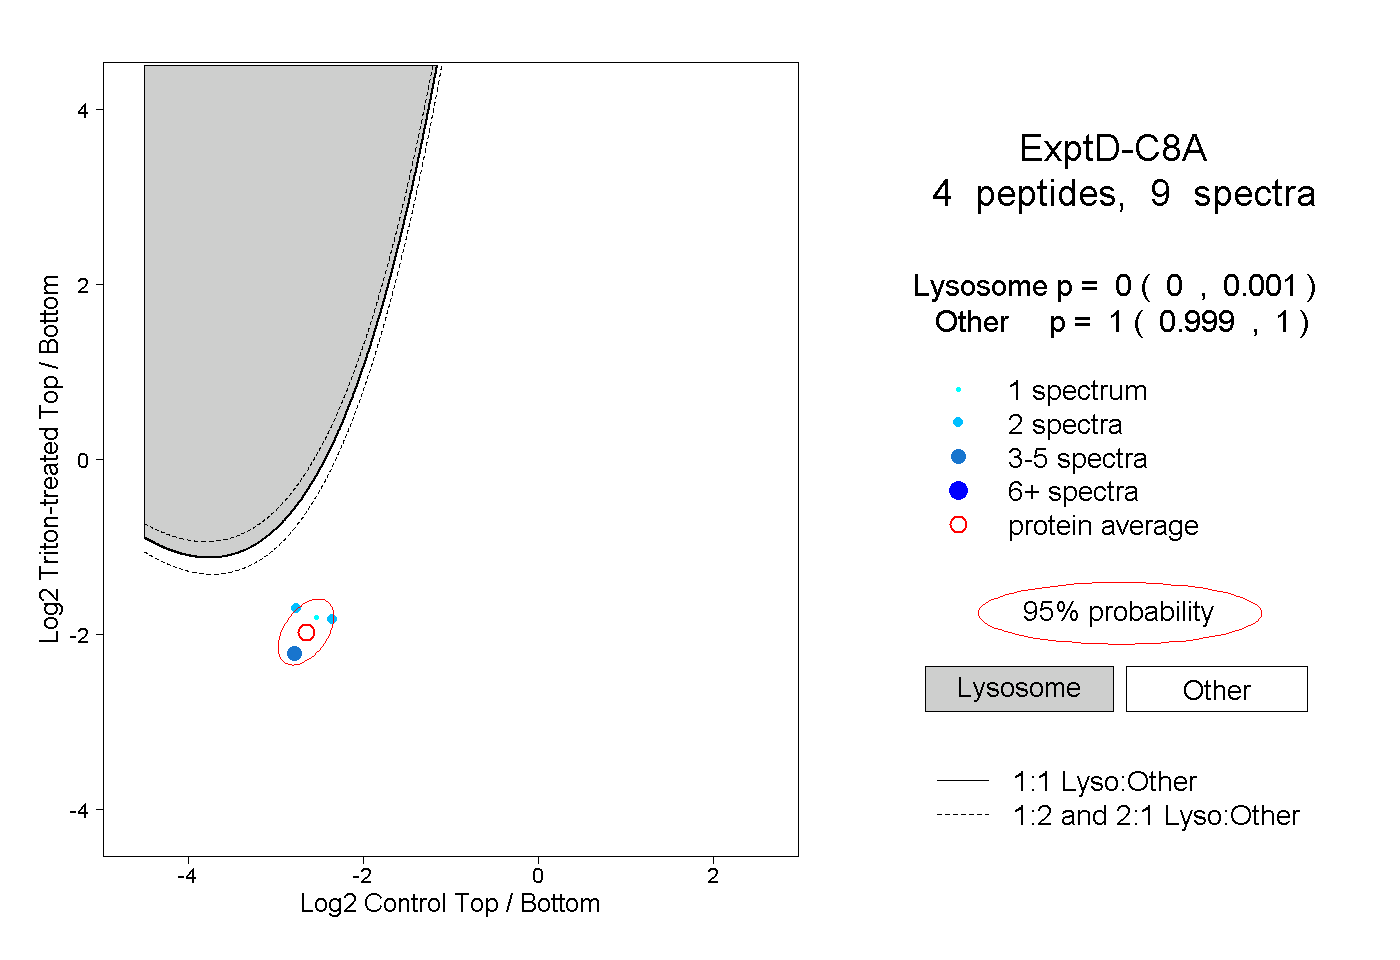 |
0.000 0.000 | 0.001 |
1.000 0.999 | 1.000 |