C8A
[ENSRNOP00000063871]
Main page
| | | Plot |
Mito |
Lyso |
|
Perox |
ER |
Golgi |
PM |
Cytosol |
Nucleus |
|
| Expt A |
 12
12
peptides |
34
spectra |
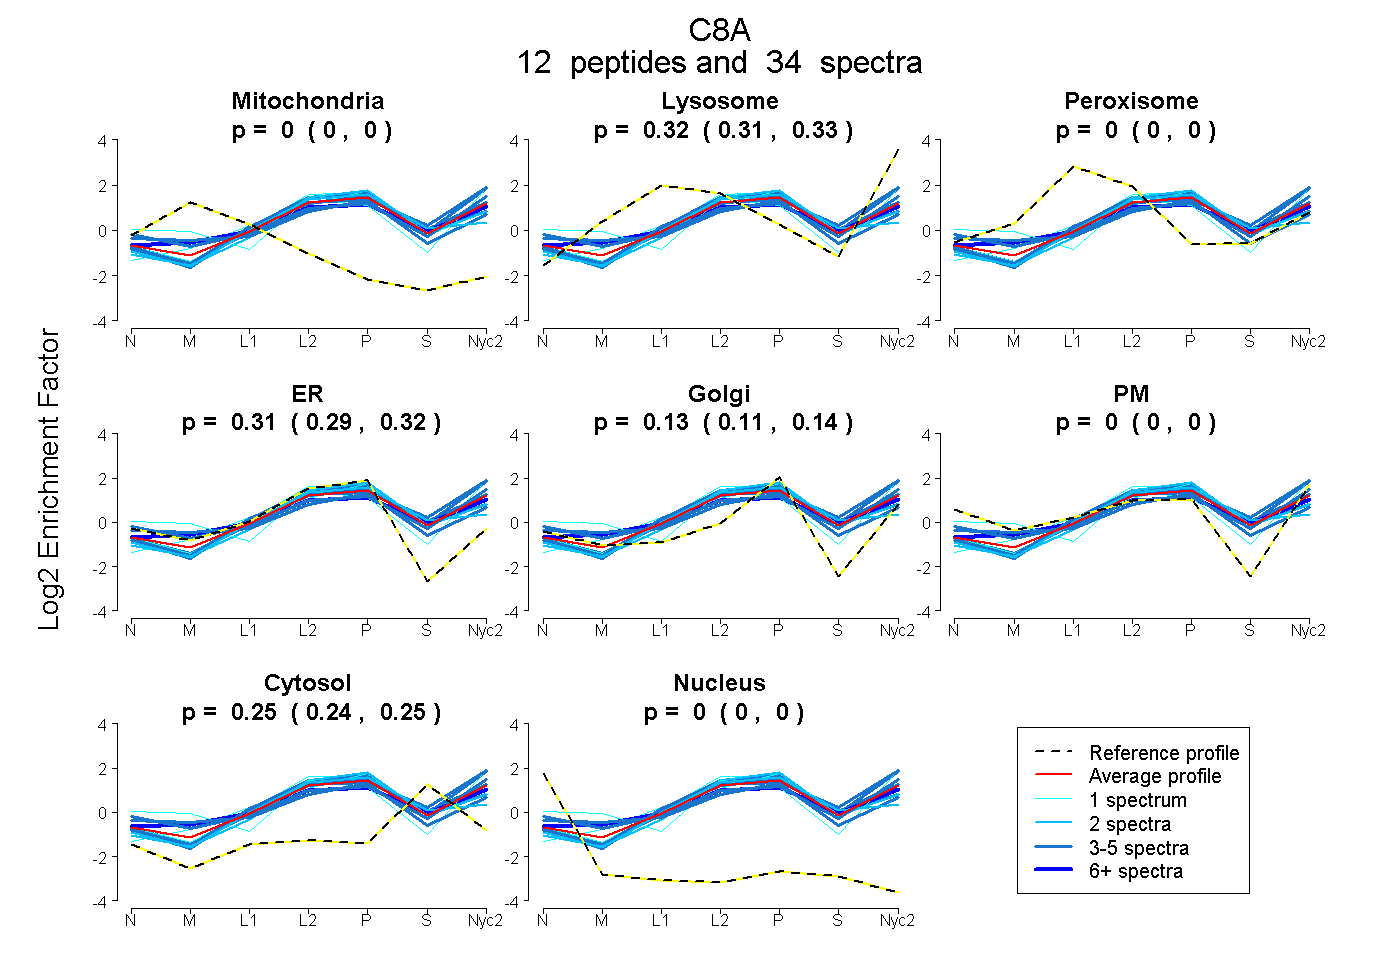 |
0.000
0.000 | 0.000 |
0.320
0.311 | 0.326 |
|
0.000
0.000 | 0.000 |
0.307
0.289 | 0.322 |
0.127
0.111 | 0.140 |
0.000
0.000 | 0.000 |
0.247
0.241 | 0.252 |
0.000
0.000 | 0.000 |
|
| | | Plot |
Mito |
|
Lyso or Perox |
|
ER |
Golgi |
PM |
Cytosol |
Nucleus |
|
| Expt B |
3
peptides |
4
spectra |
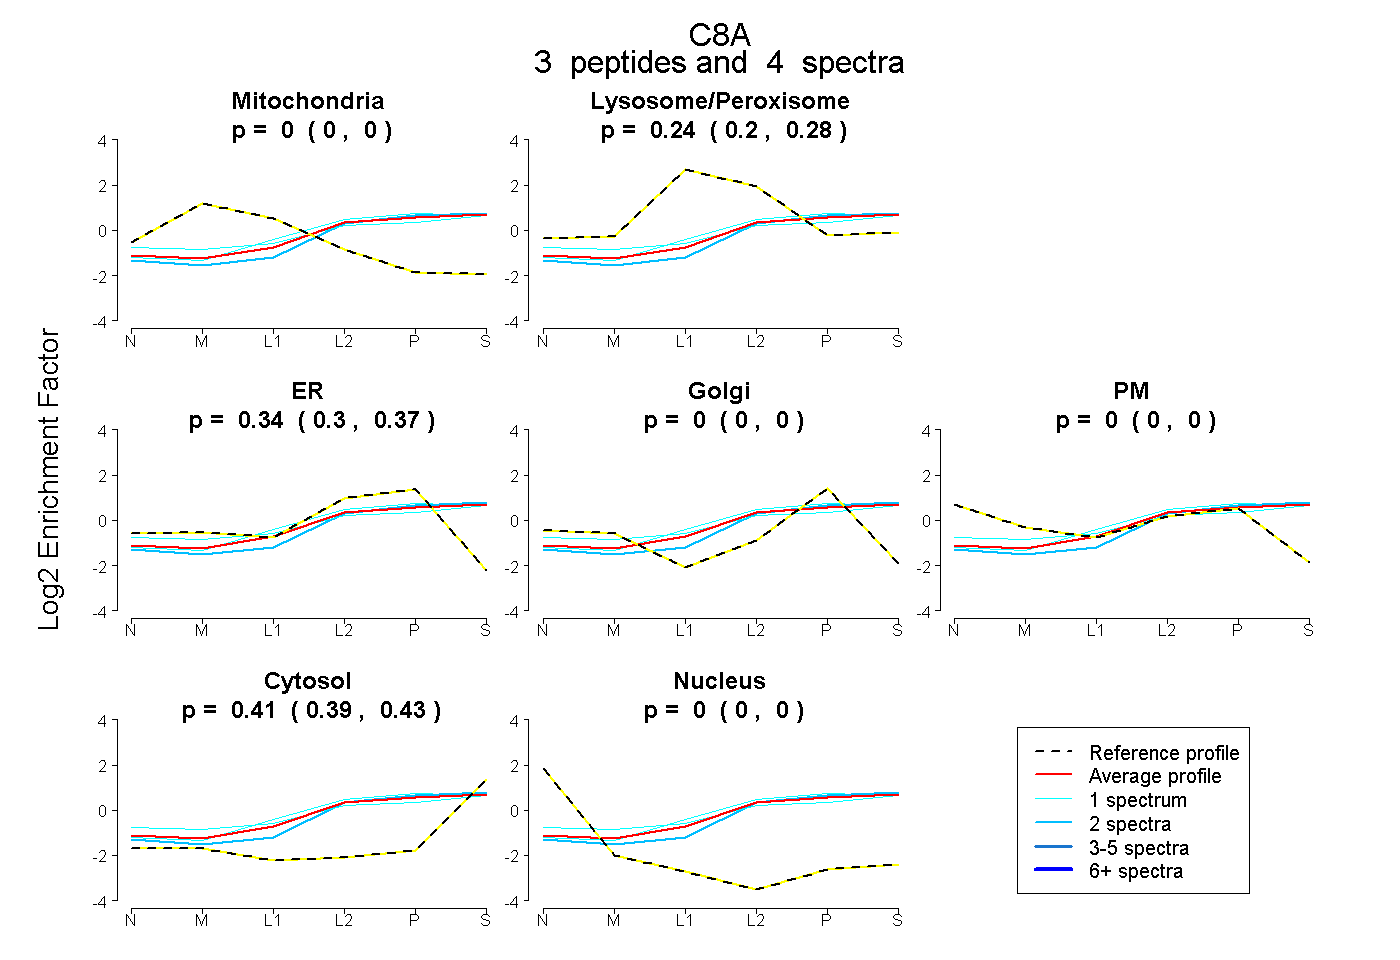 |
0.000
0.000 | 0.000 |
|
0.244
0.199 | 0.280 |
|
0.342
0.305 | 0.371 |
0.000
0.000 | 0.000 |
0.000
0.000 | 0.000 |
0.414
0.392 | 0.431 |
0.000
0.000 | 0.000 |
|
| 1 spectrum, VQTAHFK |
0.000 |
|
0.361 |
|
0.086 |
0.202 |
0.000 |
0.352 |
0.000 |
|
| 2 spectra, VIEDDCR |
0.000 |
|
0.148 |
|
0.390 |
0.000 |
0.000 |
0.461 |
0.000 |
|
| 1 spectrum, DLAVEDIISR |
0.000 |
|
0.293 |
|
0.333 |
0.000 |
0.000 |
0.375 |
0.000 |
|
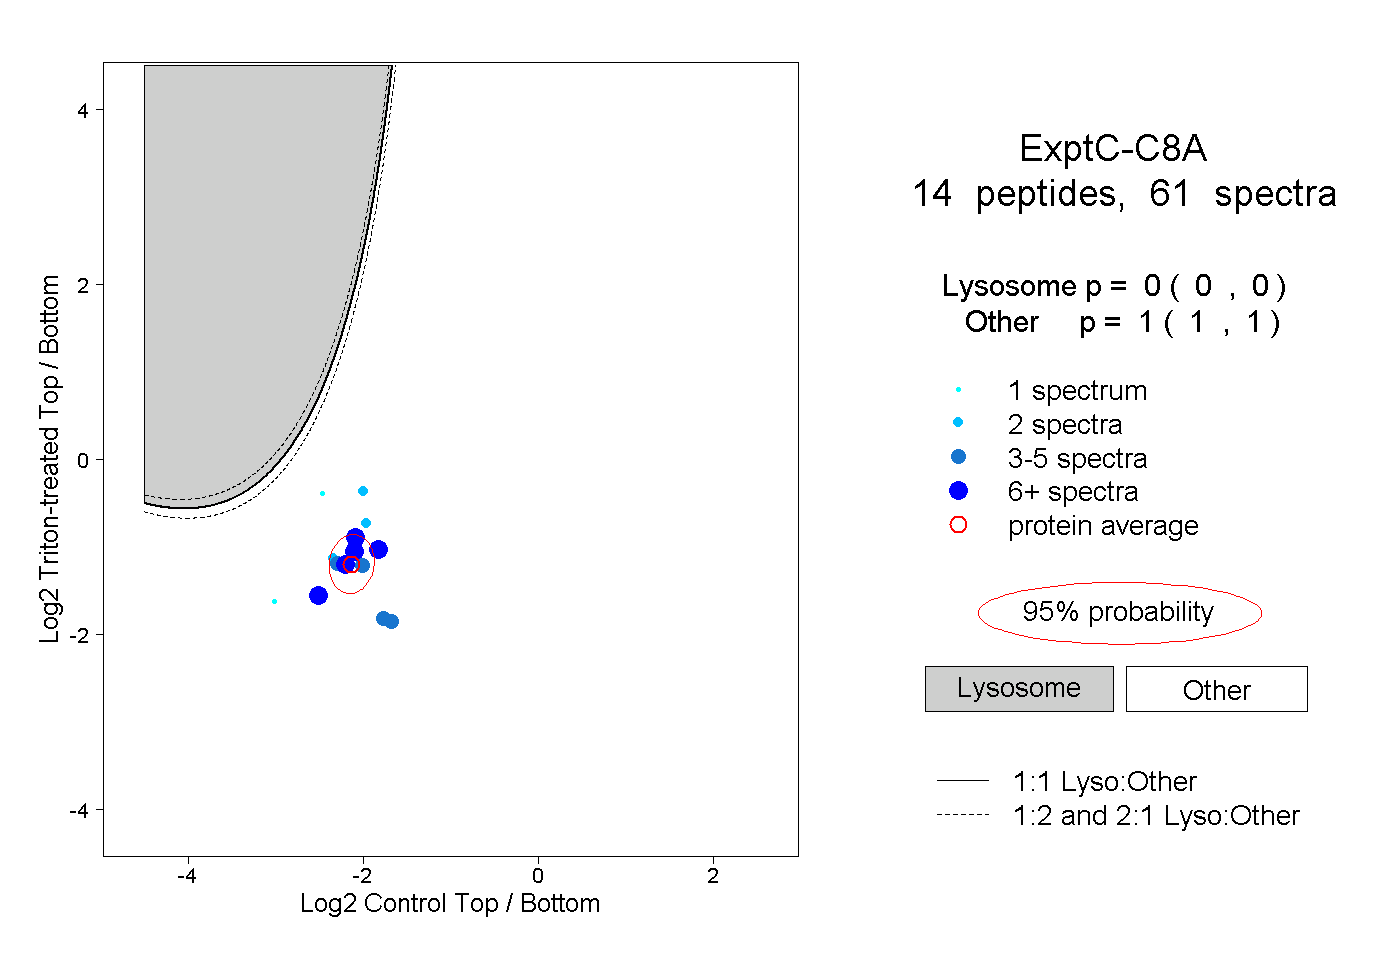
| | | Plot |
|
Lyso |
|
|
|
|
|
|
|
Other |
| Expt C |
14
peptides |
61
spectra |
 |
|
0.000
0.000 | 0.000 |
|
|
|
|
|
|
|
1.000
1.000 | 1.000 |
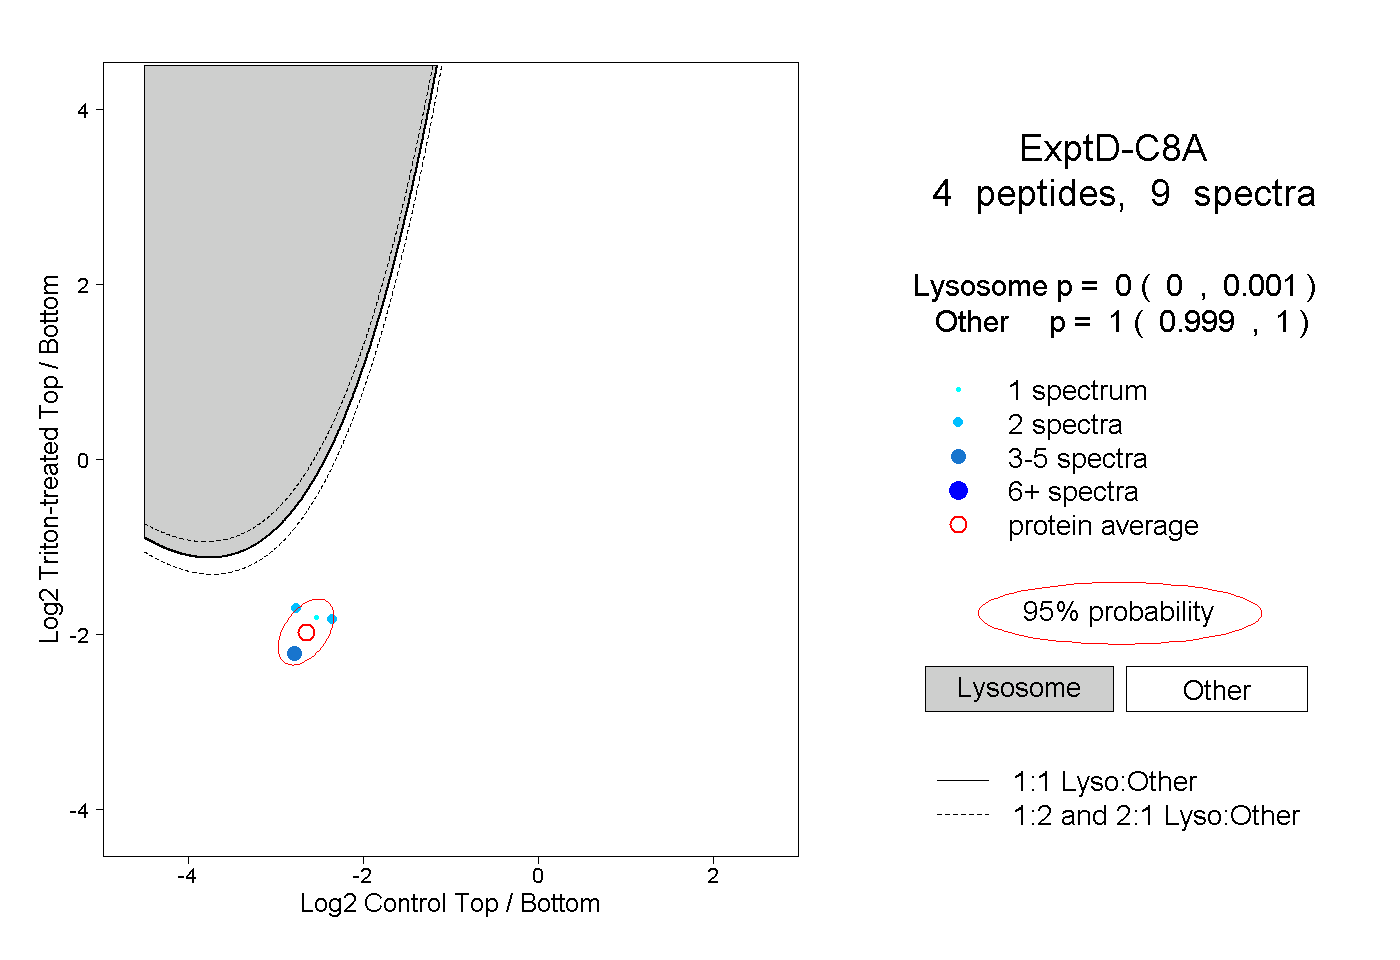
| | | Plot |
|
Lyso |
|
|
|
|
|
|
|
Other |
| Expt D |
4
peptides |
9
spectra |
 |
|
0.000
0.000 | 0.001 |
|
|
|
|
|
|
|
1.000
0.999 | 1.000 |