 10
10peptides
spectra
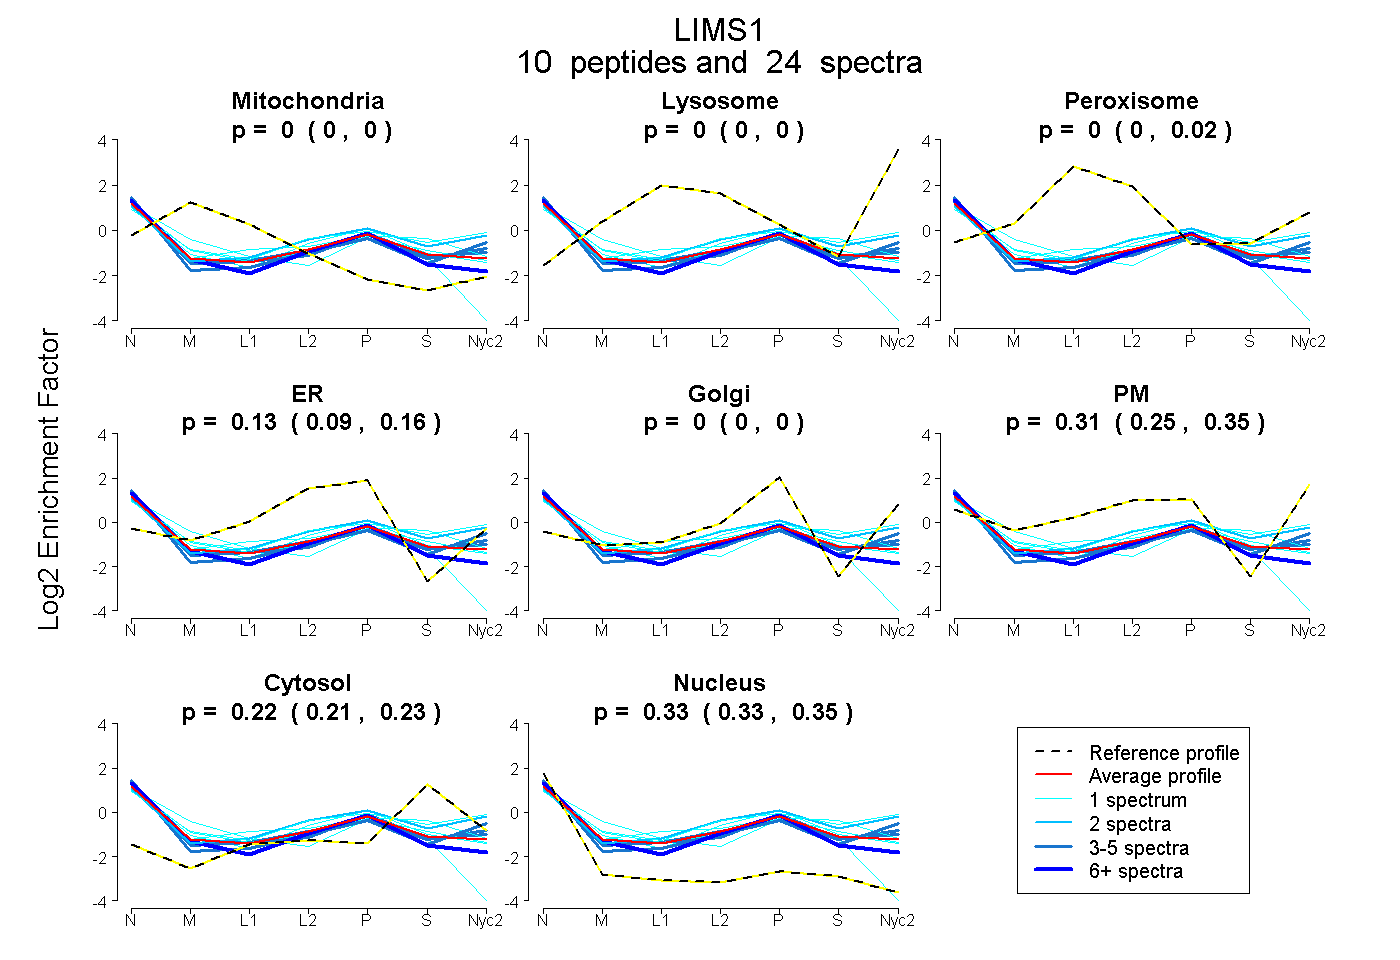
0.000 | 0.000
0.000 | 0.000
0.000 | 0.016
0.091 | 0.161
0.000 | 0.000
0.251 | 0.349
0.212 | 0.231
0.325 | 0.345
4peptides
spectra
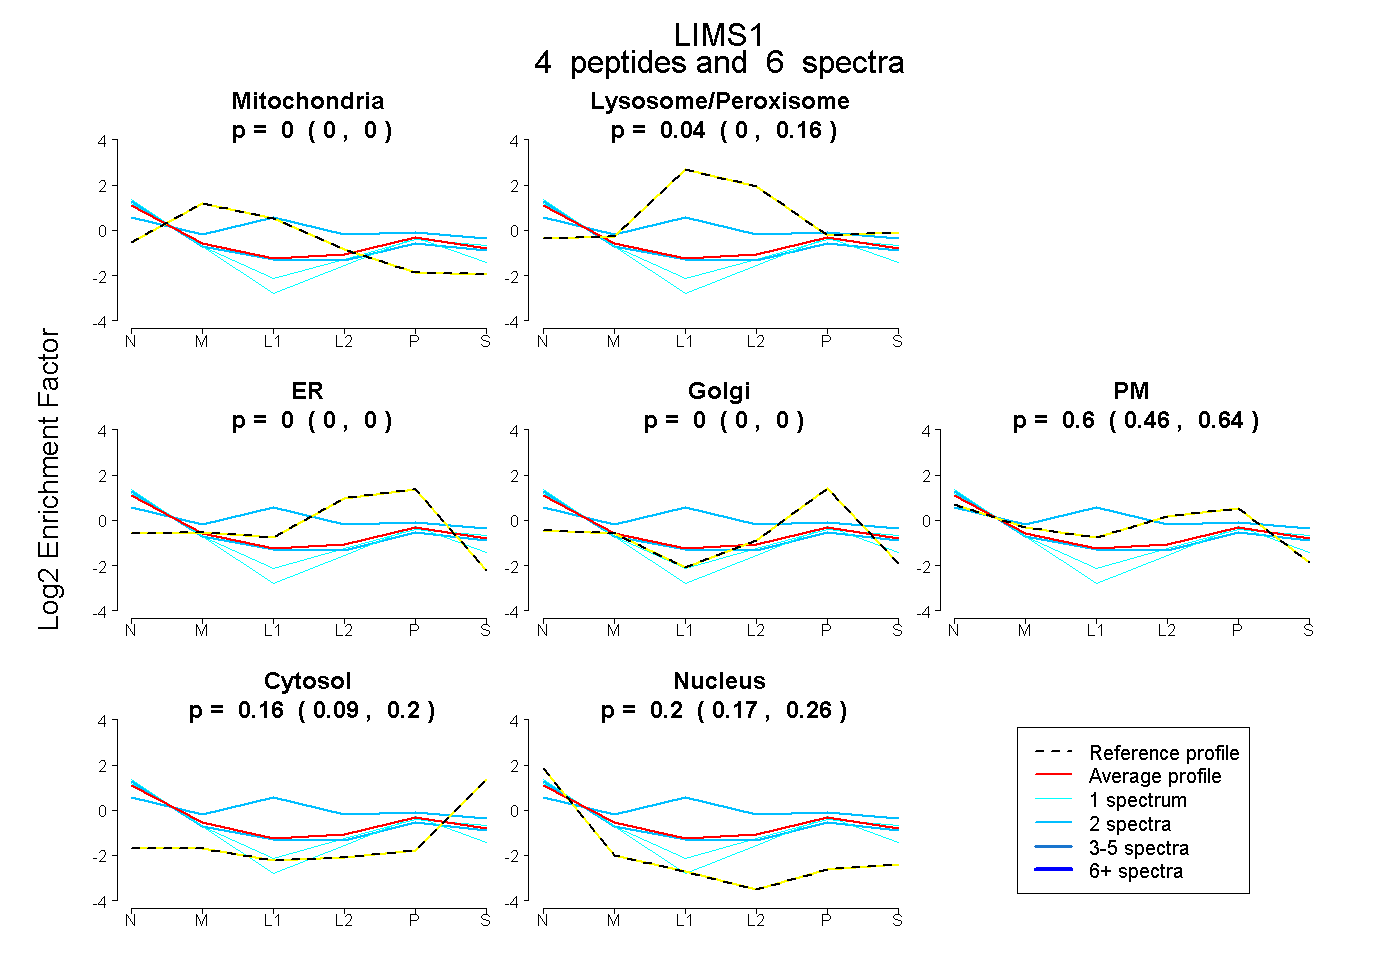
0.000 | 0.000
0.000 | 0.158
0.000 | 0.000
0.000 | 0.000
0.455 | 0.644
0.091 | 0.200
0.166 | 0.260
7peptides
spectra
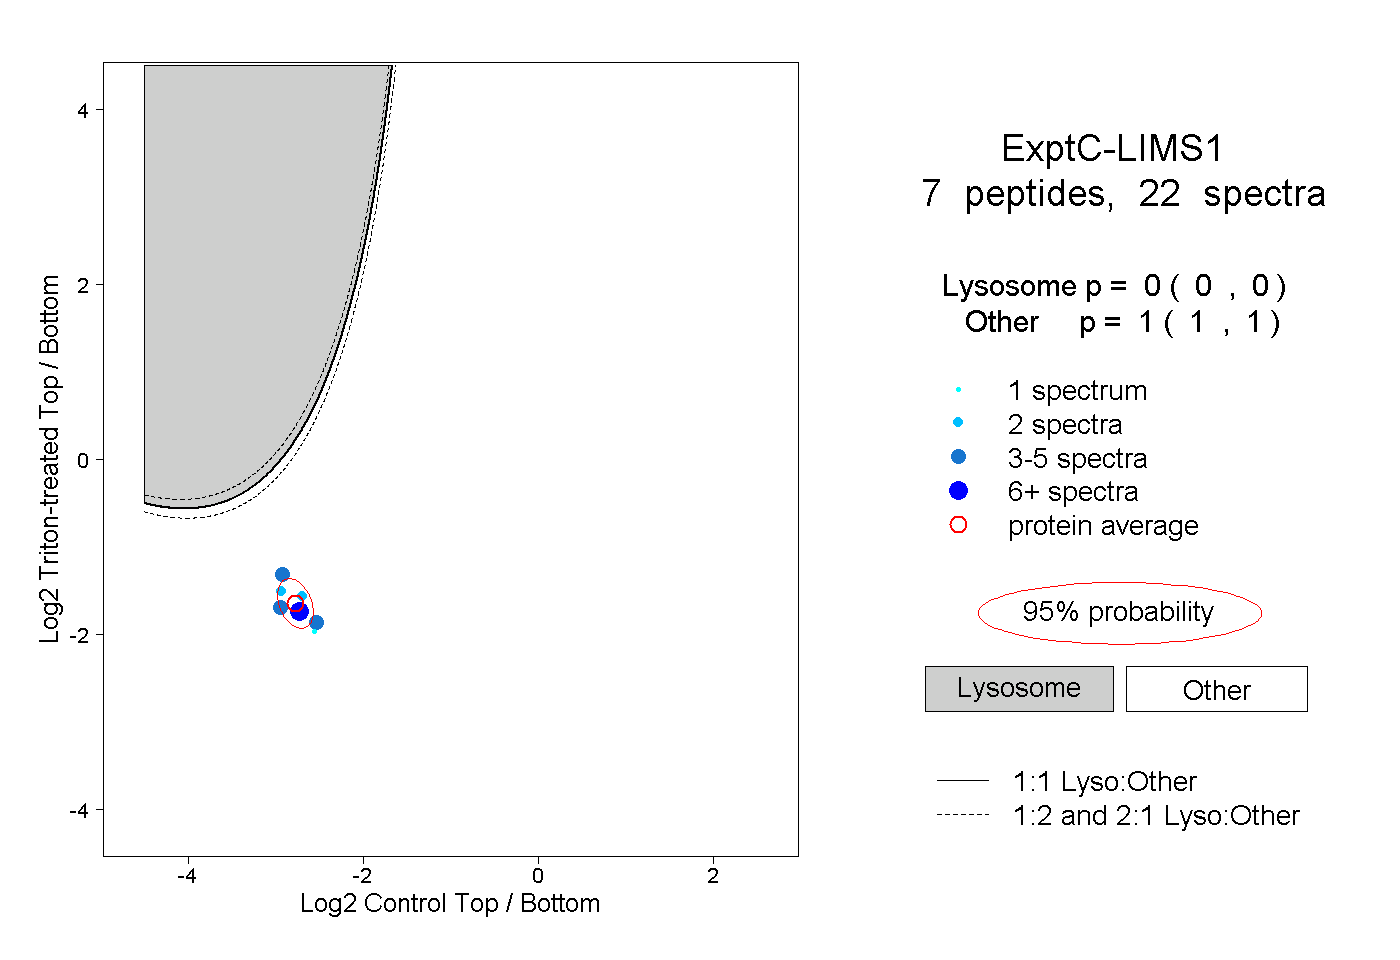
0.000 | 0.000
1.000 | 1.000