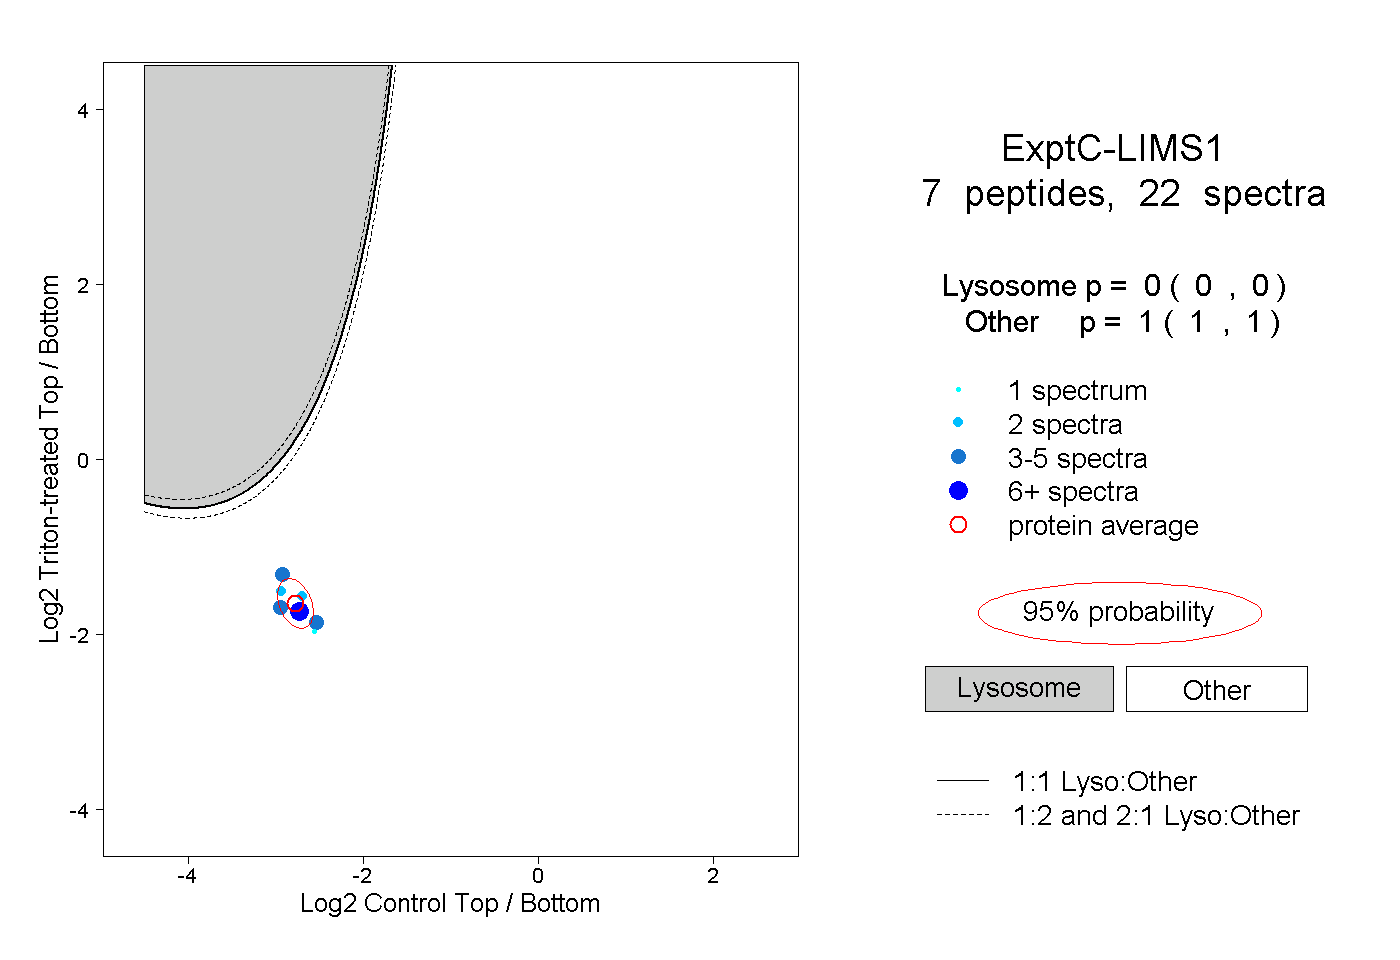
LIMS1
[ENSRNOP00000062647]
Main page
| | | Plot |
Mito |
Lyso |
|
Perox |
ER |
Golgi |
PM |
Cytosol |
Nucleus |
|
| Expt A |
 10
10
peptides |
24
spectra |
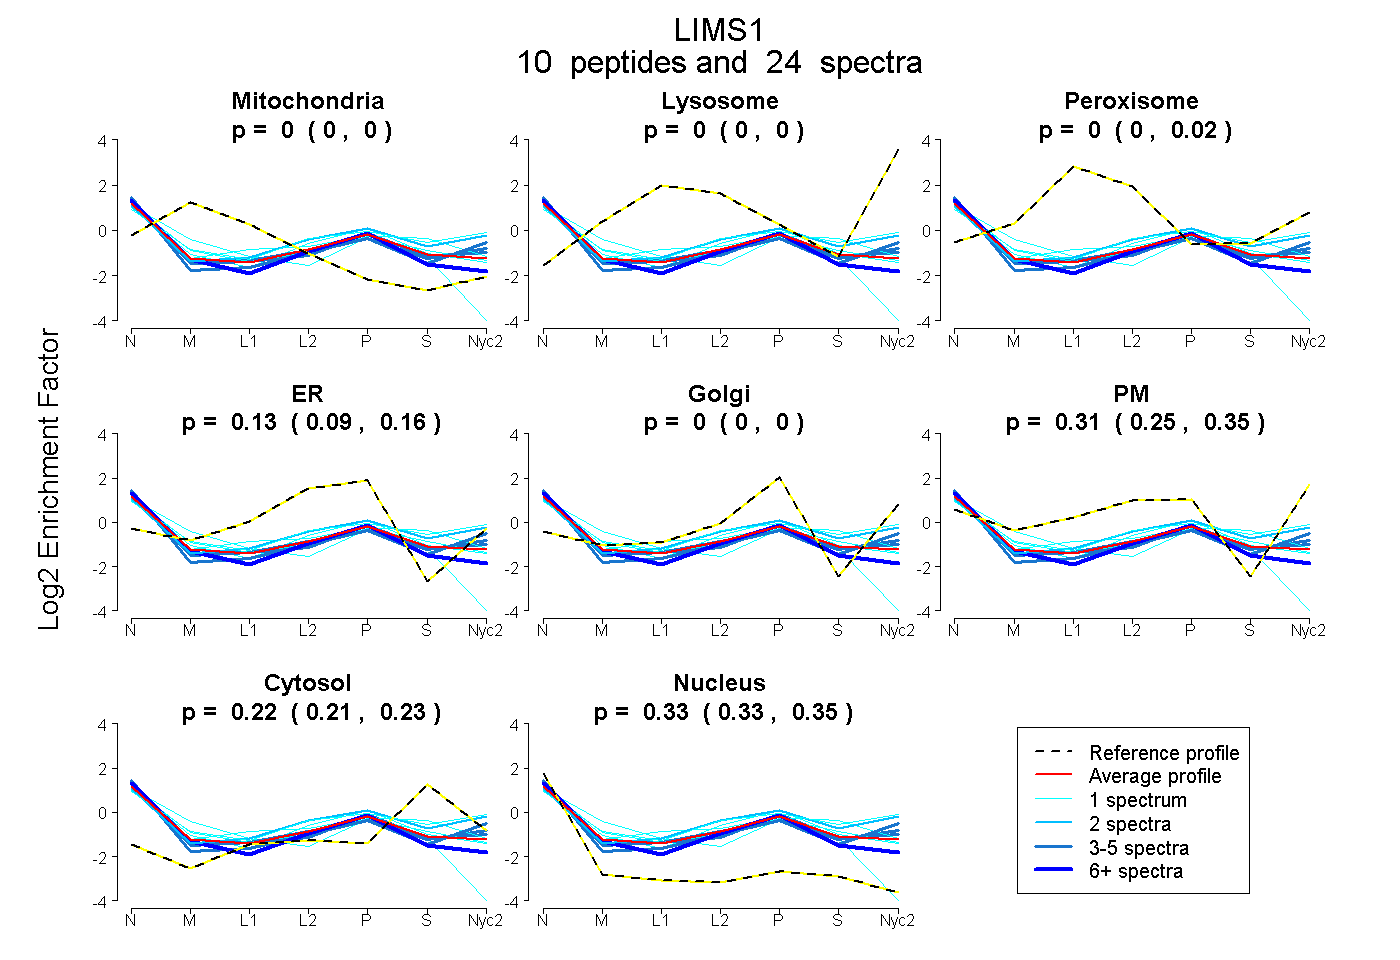 |
0.000
0.000 | 0.000 |
0.000
0.000 | 0.000 |
|
0.003
0.000 | 0.016 |
0.128
0.091 | 0.161 |
0.000
0.000 | 0.000 |
0.310
0.251 | 0.349 |
0.224
0.212 | 0.231 |
0.335
0.325 | 0.345 |
|
| | | Plot |
Mito |
|
Lyso or Perox |
|
ER |
Golgi |
PM |
Cytosol |
Nucleus |
|
| Expt B |
4
peptides |
6
spectra |
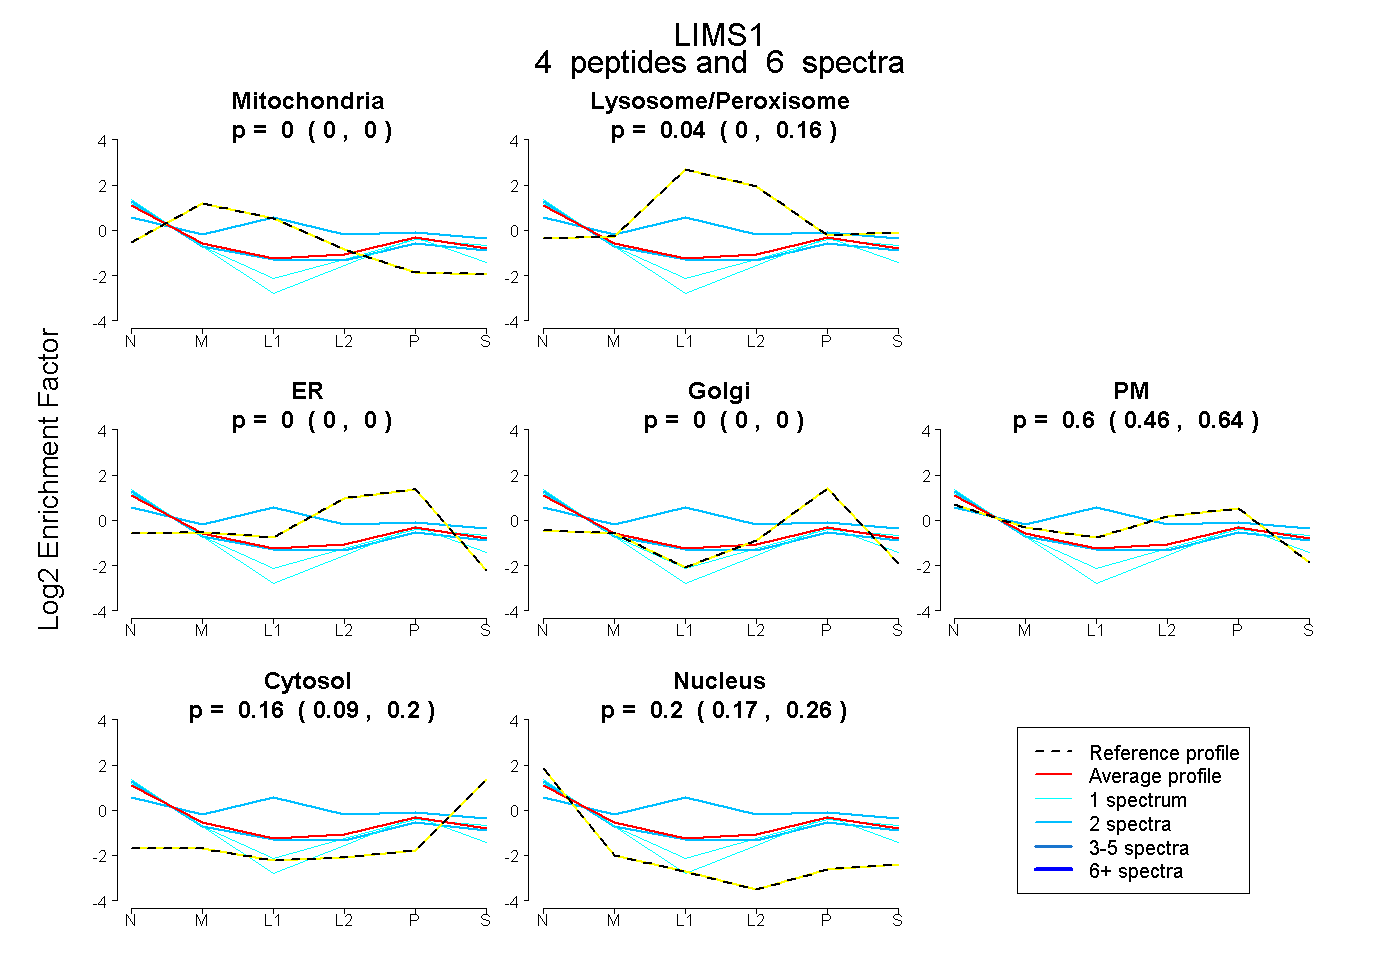 |
0.000
0.000 | 0.000 |
|
0.037
0.000 | 0.158 |
|
0.000
0.000 | 0.000 |
0.000
0.000 | 0.000 |
0.596
0.455 | 0.644 |
0.164
0.091 | 0.200 |
0.203
0.166 | 0.260 |
|
| 2 spectra, QWHVEHFVCAK |
0.023 |
|
0.421 |
|
0.000 |
0.000 |
0.352 |
0.100 |
0.105 |
|
| 2 spectra, ELTADAR |
0.000 |
|
0.060 |
|
0.000 |
0.000 |
0.508 |
0.131 |
0.301 |
|
| 1 spectrum, LSETLGR |
0.000 |
|
0.000 |
|
0.000 |
0.359 |
0.214 |
0.028 |
0.399 |
|
| 1 spectrum, CEKPFLGHR |
0.000 |
|
0.000 |
|
0.000 |
0.029 |
0.511 |
0.206 |
0.254 |
|
| | | Plot |
|
Lyso |
|
|
|
|
|
|
|
Other |
| Expt C |
7
peptides |
22
spectra |
 |
|
0.000
0.000 | 0.000 |
|
|
|
|
|
|
|
1.000
1.000 | 1.000 |