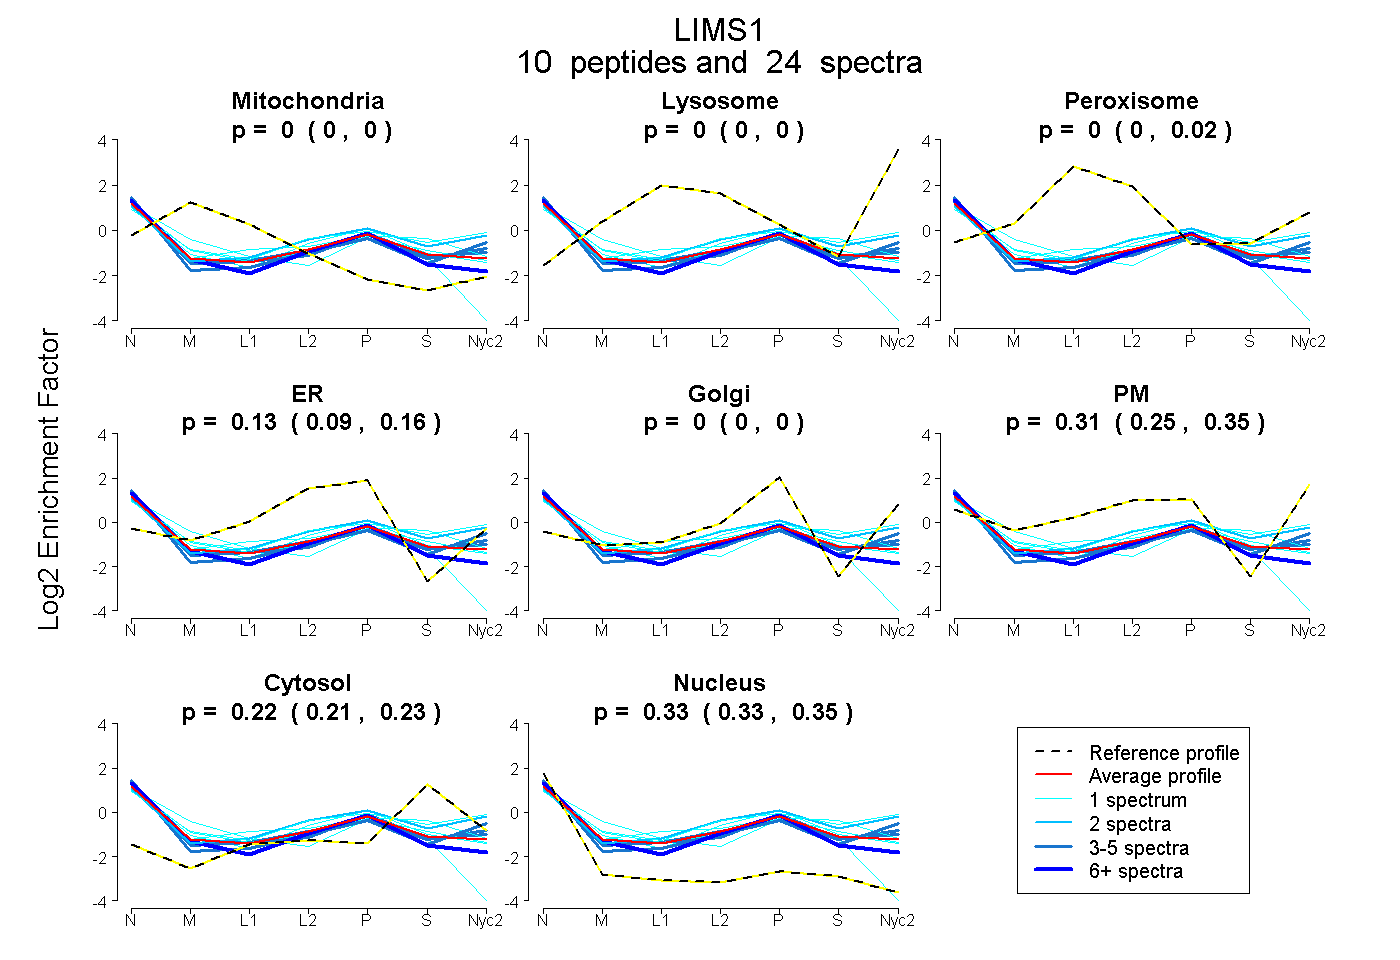
 10
10peptides
spectra
0.000 | 0.000
0.000 | 0.000
0.000 | 0.016
0.091 | 0.161
0.000 | 0.000
0.251 | 0.349
0.212 | 0.231
0.325 | 0.345
| Plot | Mito | Lyso | Perox | ER | Golgi | PM | Cytosol | Nucleus | |||||
| Expt A |
10 peptides |
24 spectra |
|
0.000 0.000 | 0.000 |
0.000 0.000 | 0.000 |
0.003 0.000 | 0.016 |
0.128 0.091 | 0.161 |
0.000 0.000 | 0.000 |
0.310 0.251 | 0.349 |
0.224 0.212 | 0.231 |
0.335 0.325 | 0.345 |
| 6 spectra, MGVPICGACR | 0.000 | 0.000 | 0.000 | 0.284 | 0.021 | 0.124 | 0.132 | 0.439 | ||
| 4 spectra, FPLELK | 0.000 | 0.000 | 0.000 | 0.000 | 0.000 | 0.458 | 0.200 | 0.342 | ||
| 1 spectrum, FVEFDMKPVCK | 0.076 | 0.000 | 0.000 | 0.087 | 0.000 | 0.290 | 0.250 | 0.296 | ||
| 3 spectra, LSETLGR | 0.000 | 0.000 | 0.000 | 0.000 | 0.000 | 0.457 | 0.174 | 0.369 | ||
| 1 spectrum, RPIEGR | 0.000 | 0.000 | 0.000 | 0.000 | 0.000 | 0.516 | 0.328 | 0.156 | ||
| 1 spectrum, CEKPFLGHR | 0.313 | 0.000 | 0.000 | 0.192 | 0.000 | 0.000 | 0.082 | 0.412 | ||
| 1 spectrum, CDLCQEVLADIGFVK | 0.000 | 0.000 | 0.000 | 0.271 | 0.000 | 0.194 | 0.217 | 0.318 | ||
| 2 spectra, QWHVEHFVCAK | 0.000 | 0.000 | 0.000 | 0.000 | 0.000 | 0.509 | 0.301 | 0.189 | ||
| 4 spectra, ELTADAR | 0.000 | 0.000 | 0.000 | 0.000 | 0.071 | 0.375 | 0.207 | 0.347 | ||
| 1 spectrum, GELYCLPCHDK | 0.000 | 0.000 | 0.131 | 0.095 | 0.000 | 0.200 | 0.309 | 0.265 |
| Plot | Mito | Lyso or Perox | ER | Golgi | PM | Cytosol | Nucleus | ||||||
| Expt B |
4 peptides |
6 spectra |
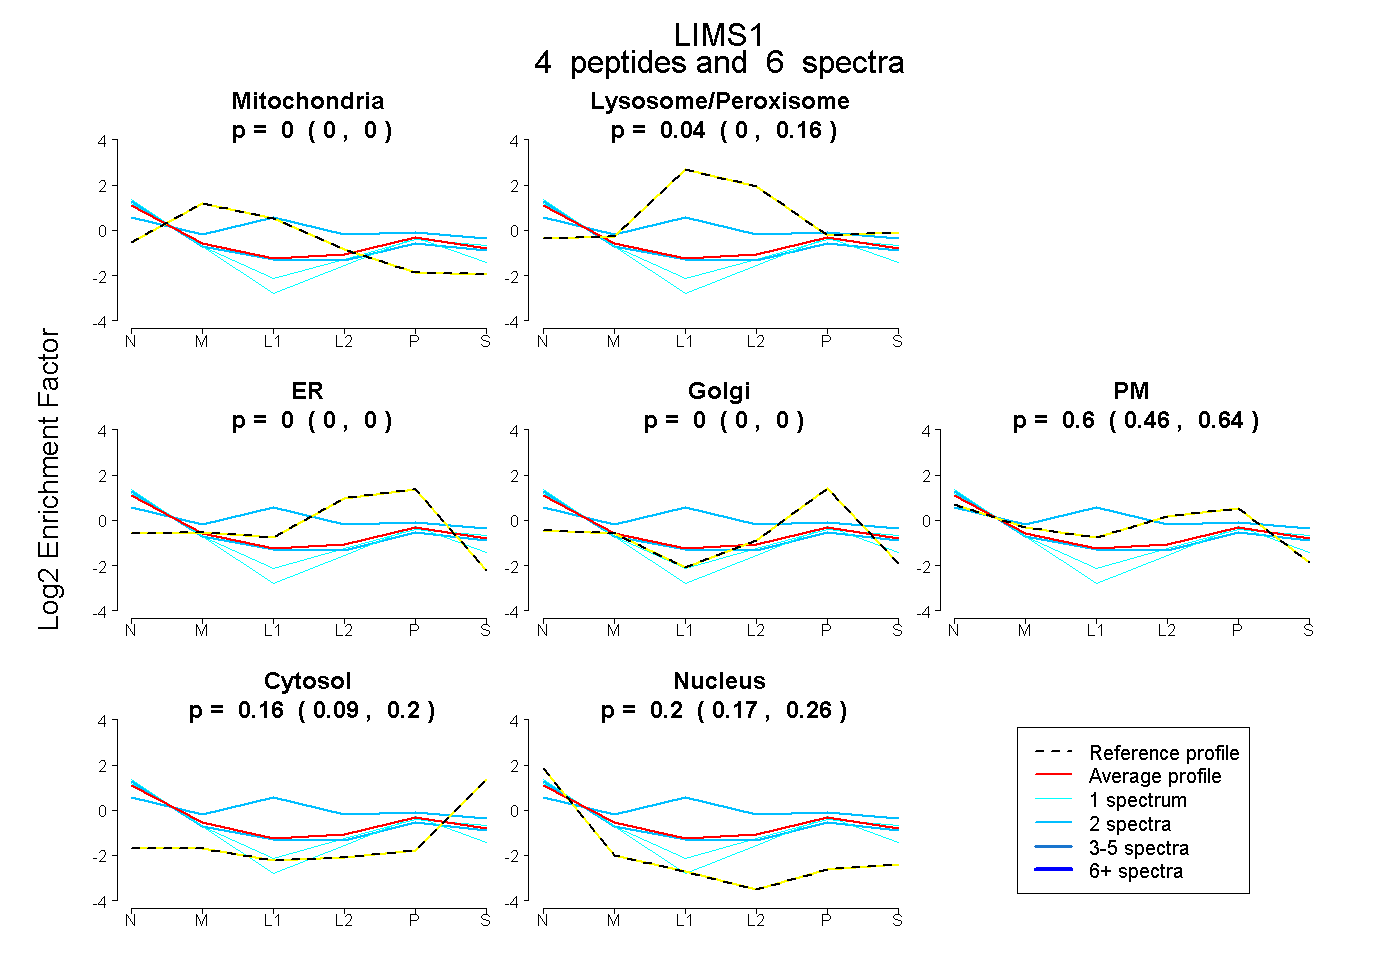 |
0.000 0.000 | 0.000 |
0.037 0.000 | 0.158 |
0.000 0.000 | 0.000 |
0.000 0.000 | 0.000 |
0.596 0.455 | 0.644 |
0.164 0.091 | 0.200 |
0.203 0.166 | 0.260 |
|||
| Plot | Lyso | Other | |||||||||||
| Expt C |
7 peptides |
22 spectra |
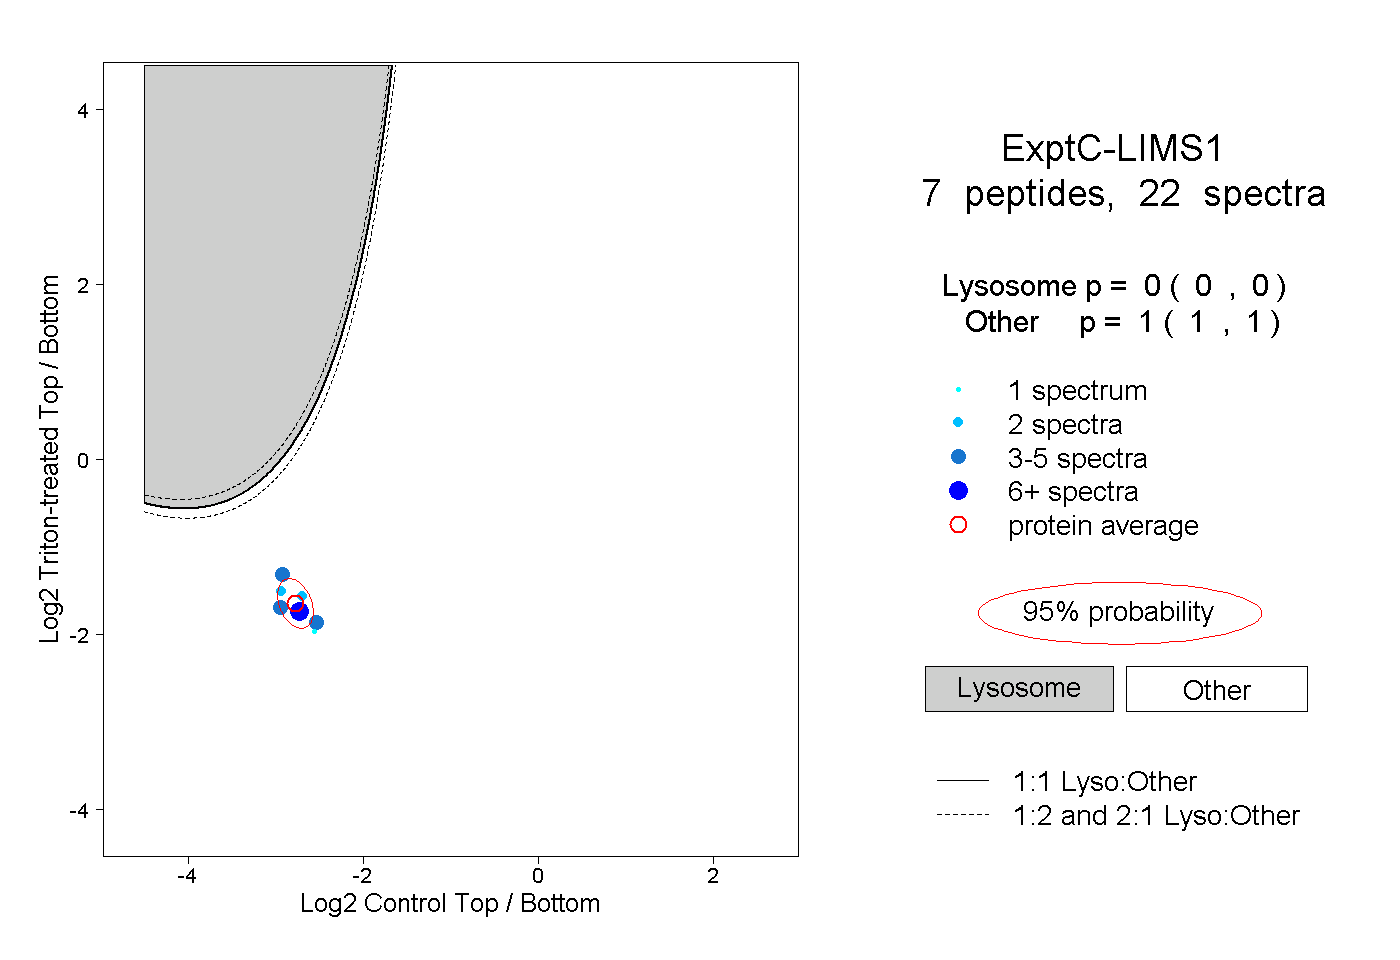 |
0.000 0.000 | 0.000 |
1.000 1.000 | 1.000 |