 13
13peptides
spectra
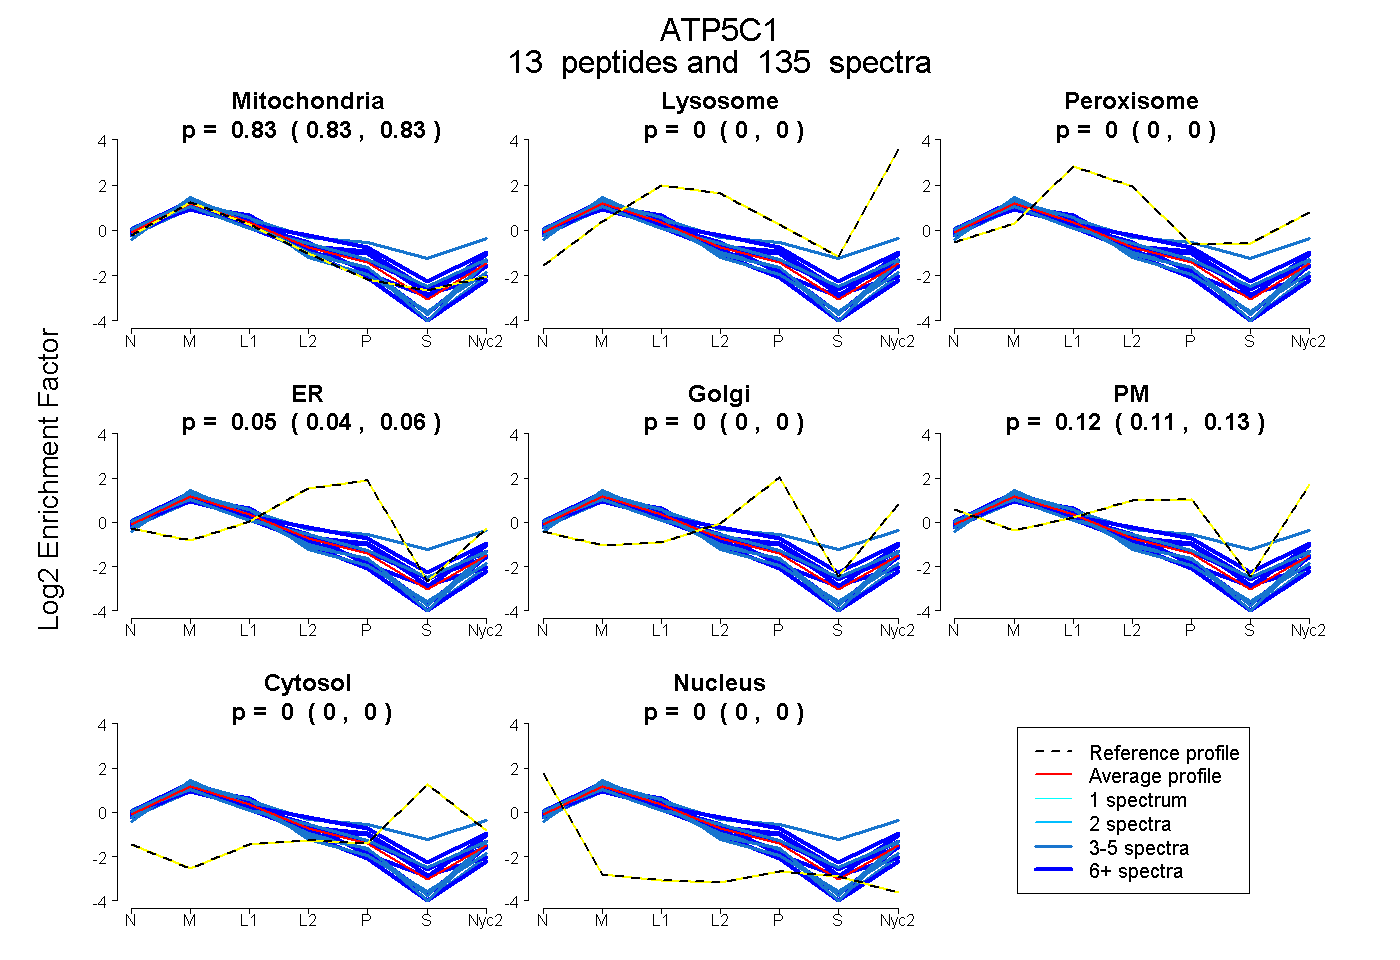
0.825 | 0.833
0.000 | 0.000
0.000 | 0.000
0.040 | 0.056
0.000 | 0.000
0.113 | 0.130
0.000 | 0.000
0.000 | 0.000
11peptides
spectra
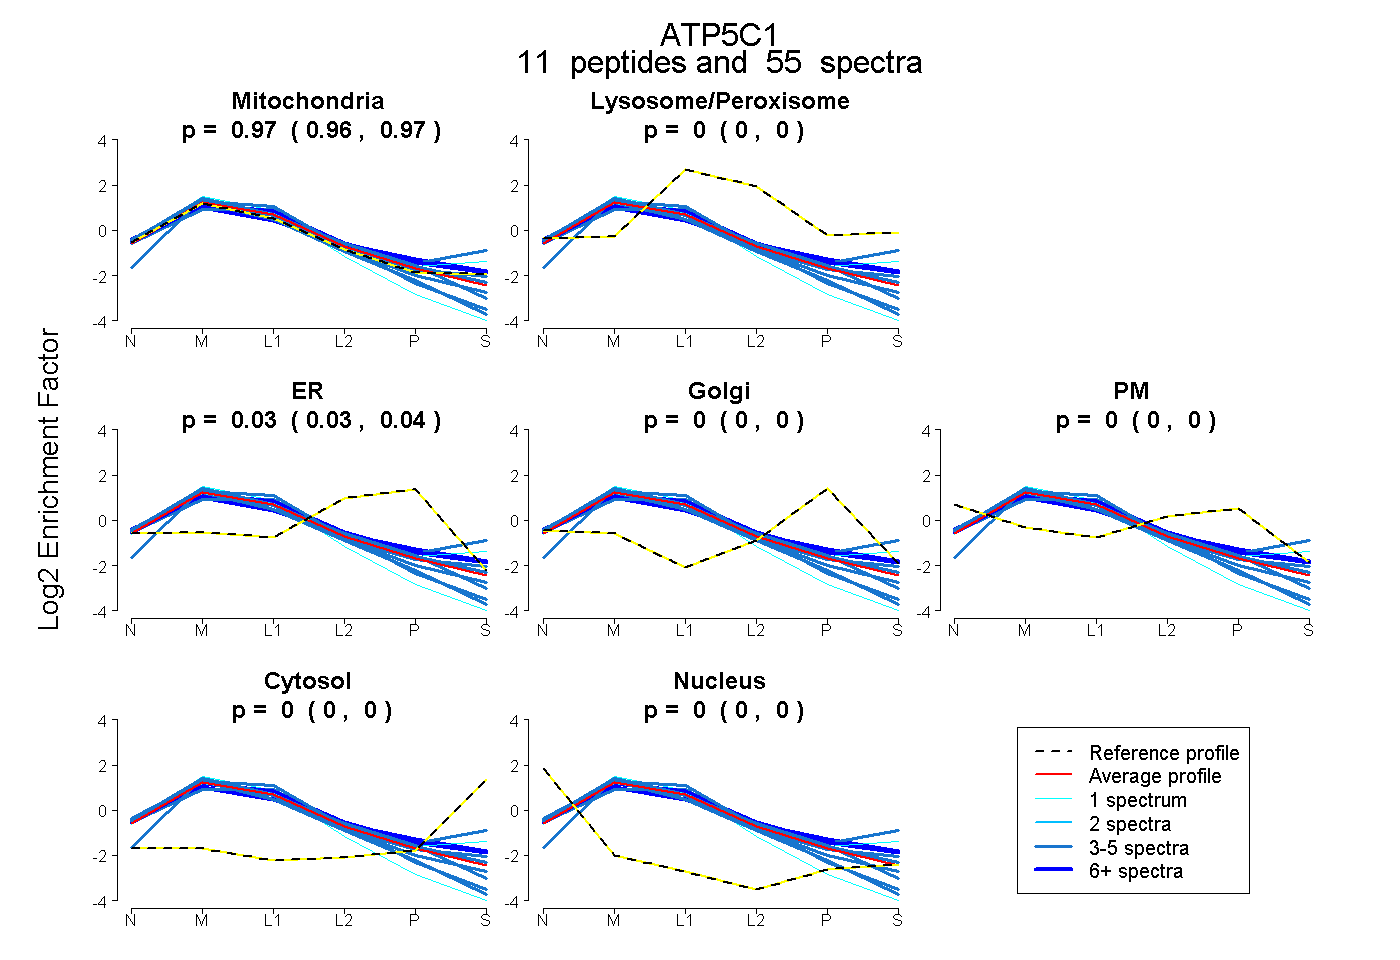
0.960 | 0.973
0.000 | 0.000
0.026 | 0.039
0.000 | 0.000
0.000 | 0.000
0.000 | 0.000
0.000 | 0.000
12peptides
spectra
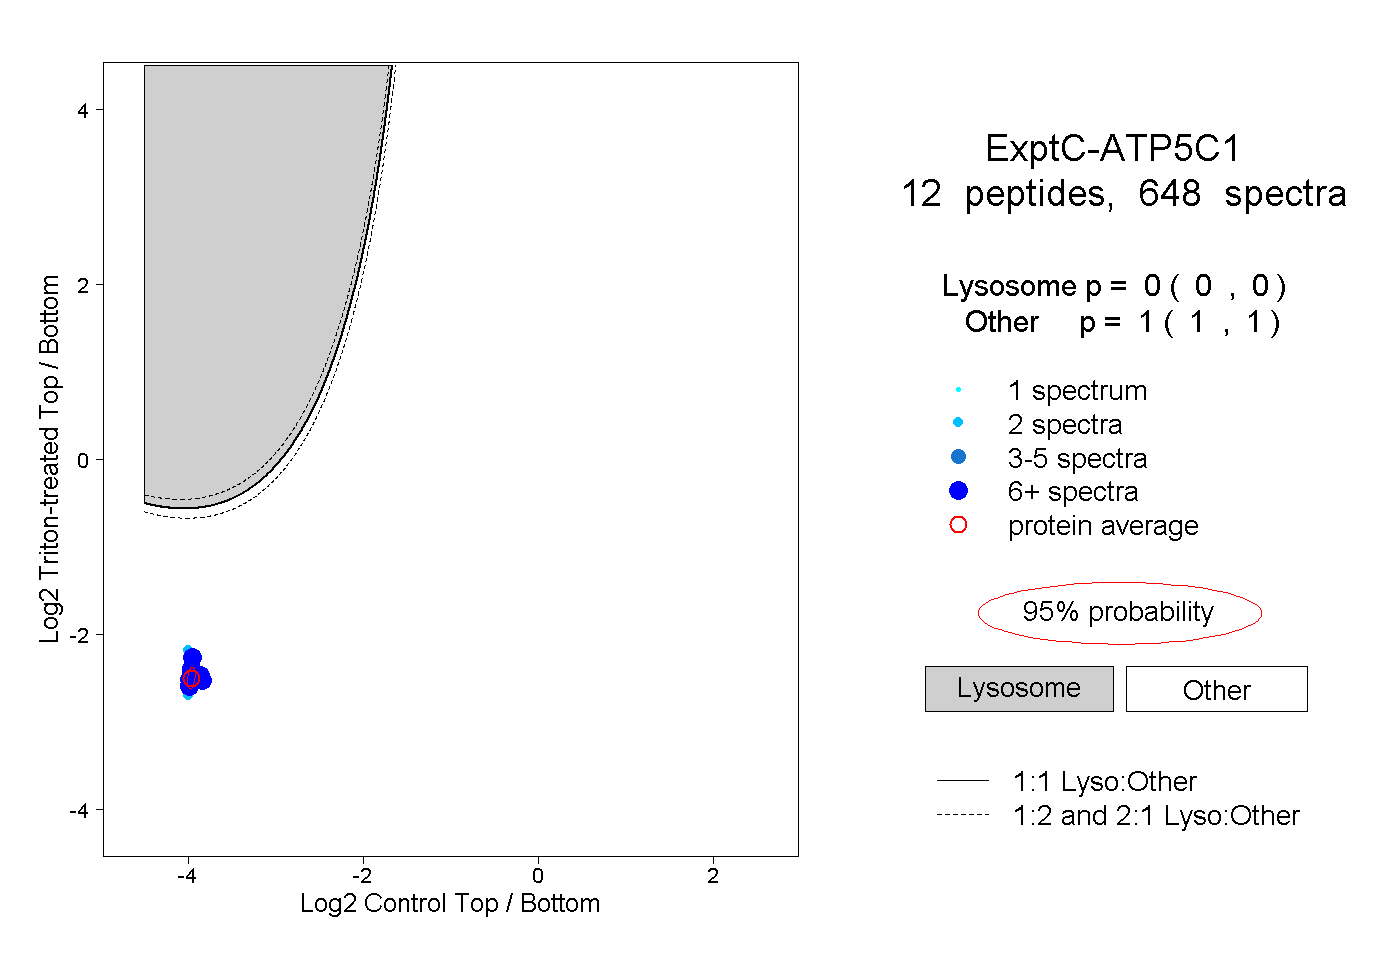
0.000 | 0.000
1.000 | 1.000
9peptides
spectra
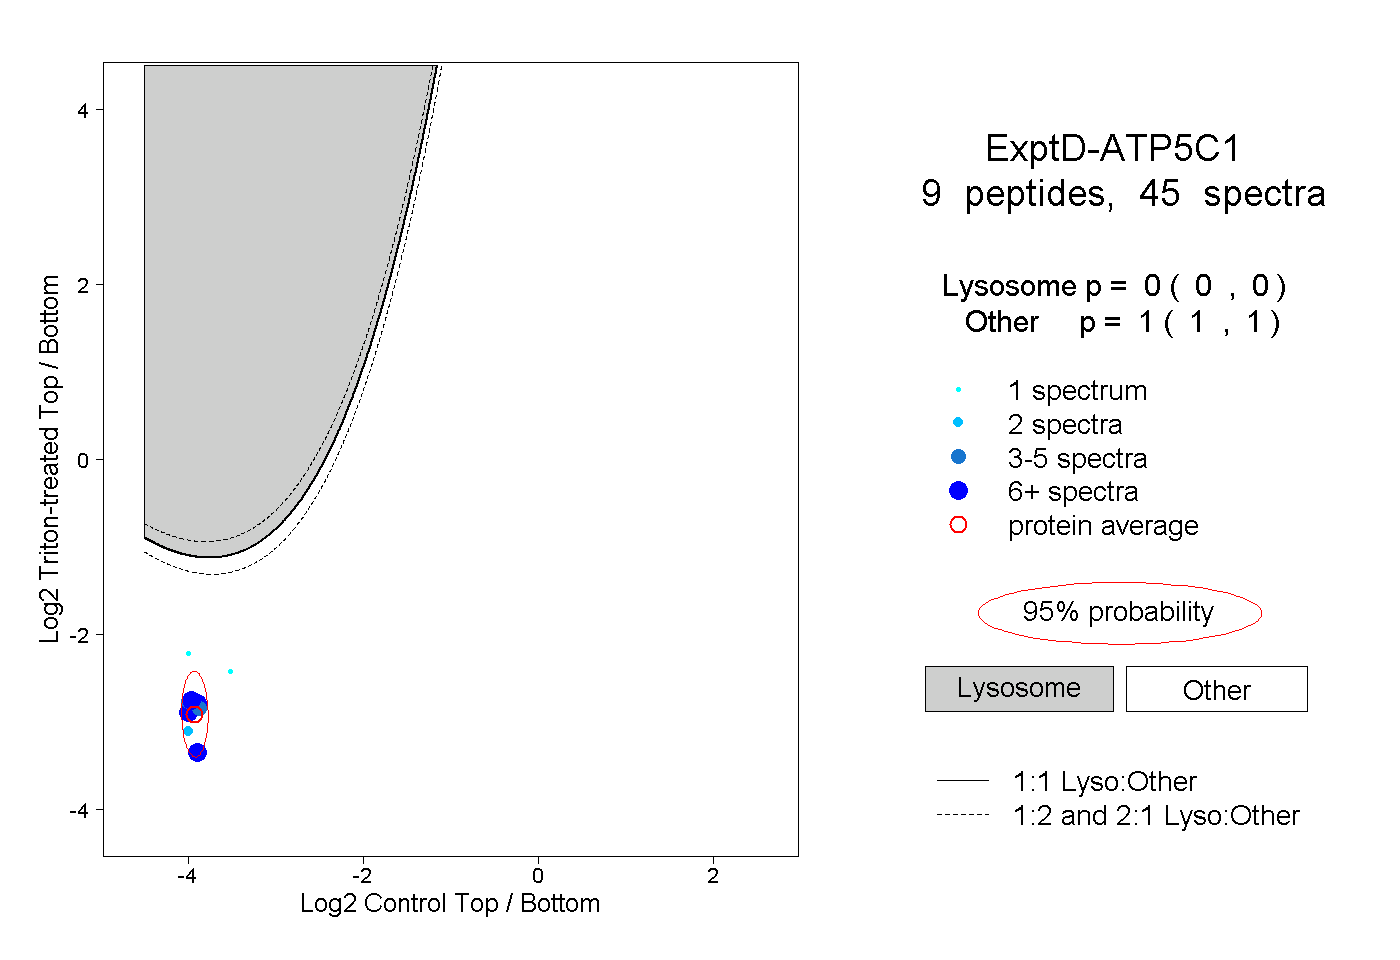
0.000 | 0.000
1.000 | 1.000