ATP5C1
[ENSRNOP00000061946]
Main page
| | | Plot |
Mito |
Lyso |
|
Perox |
ER |
Golgi |
PM |
Cytosol |
Nucleus |
|
| Expt A |
 13
13
peptides |
135
spectra |
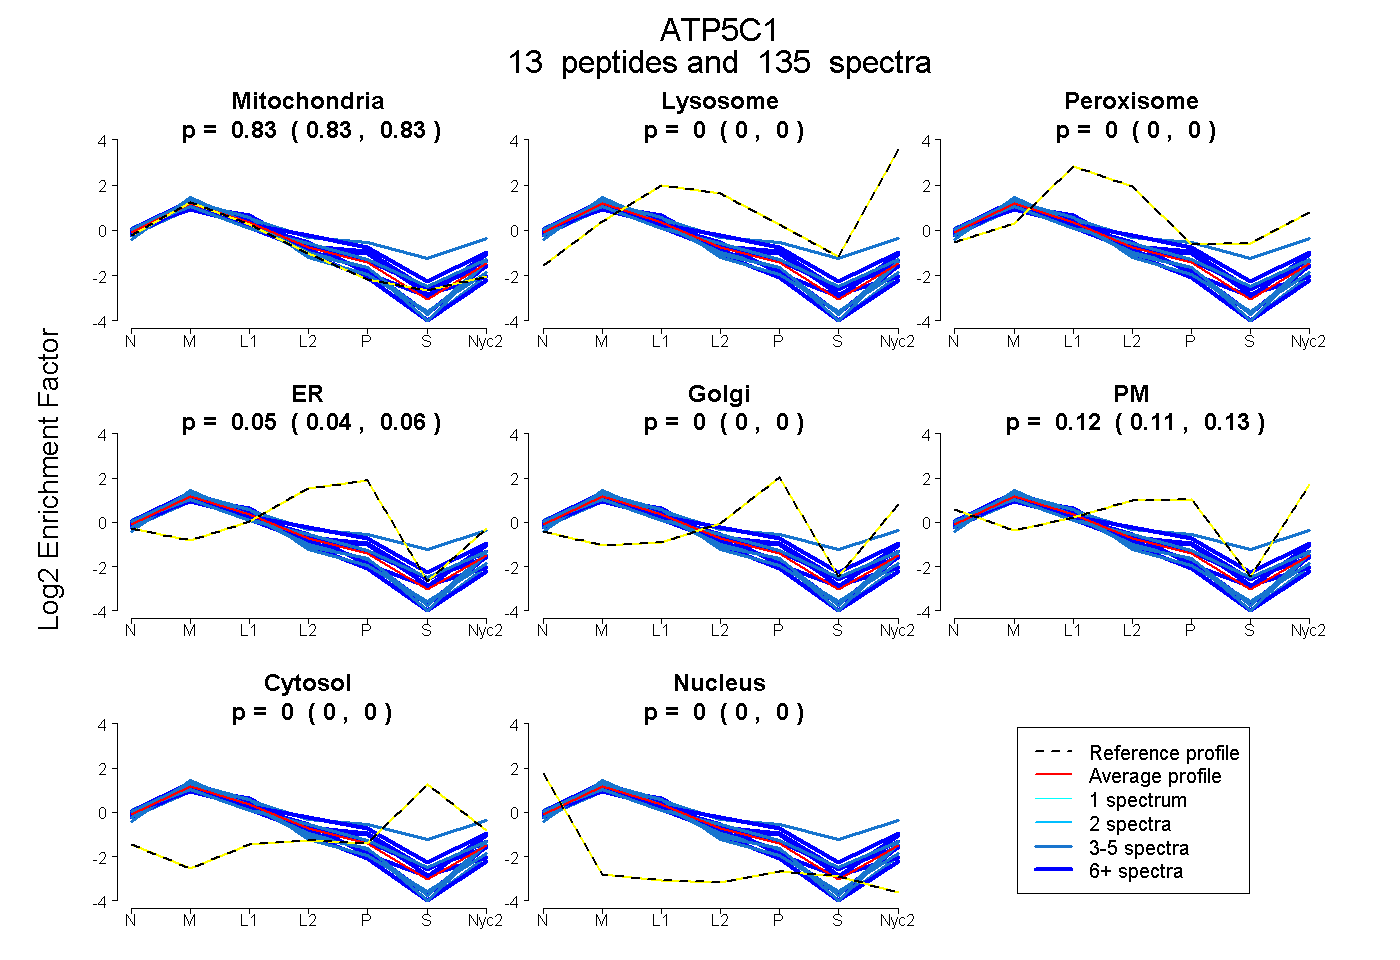 |
0.830
0.825 | 0.833 |
0.000
0.000 | 0.000 |
|
0.000
0.000 | 0.000 |
0.049
0.040 | 0.056 |
0.000
0.000 | 0.000 |
0.122
0.113 | 0.130 |
0.000
0.000 | 0.000 |
0.000
0.000 | 0.000 |
|
| | | Plot |
Mito |
|
Lyso or Perox |
|
ER |
Golgi |
PM |
Cytosol |
Nucleus |
|
| Expt B |
11
peptides |
55
spectra |
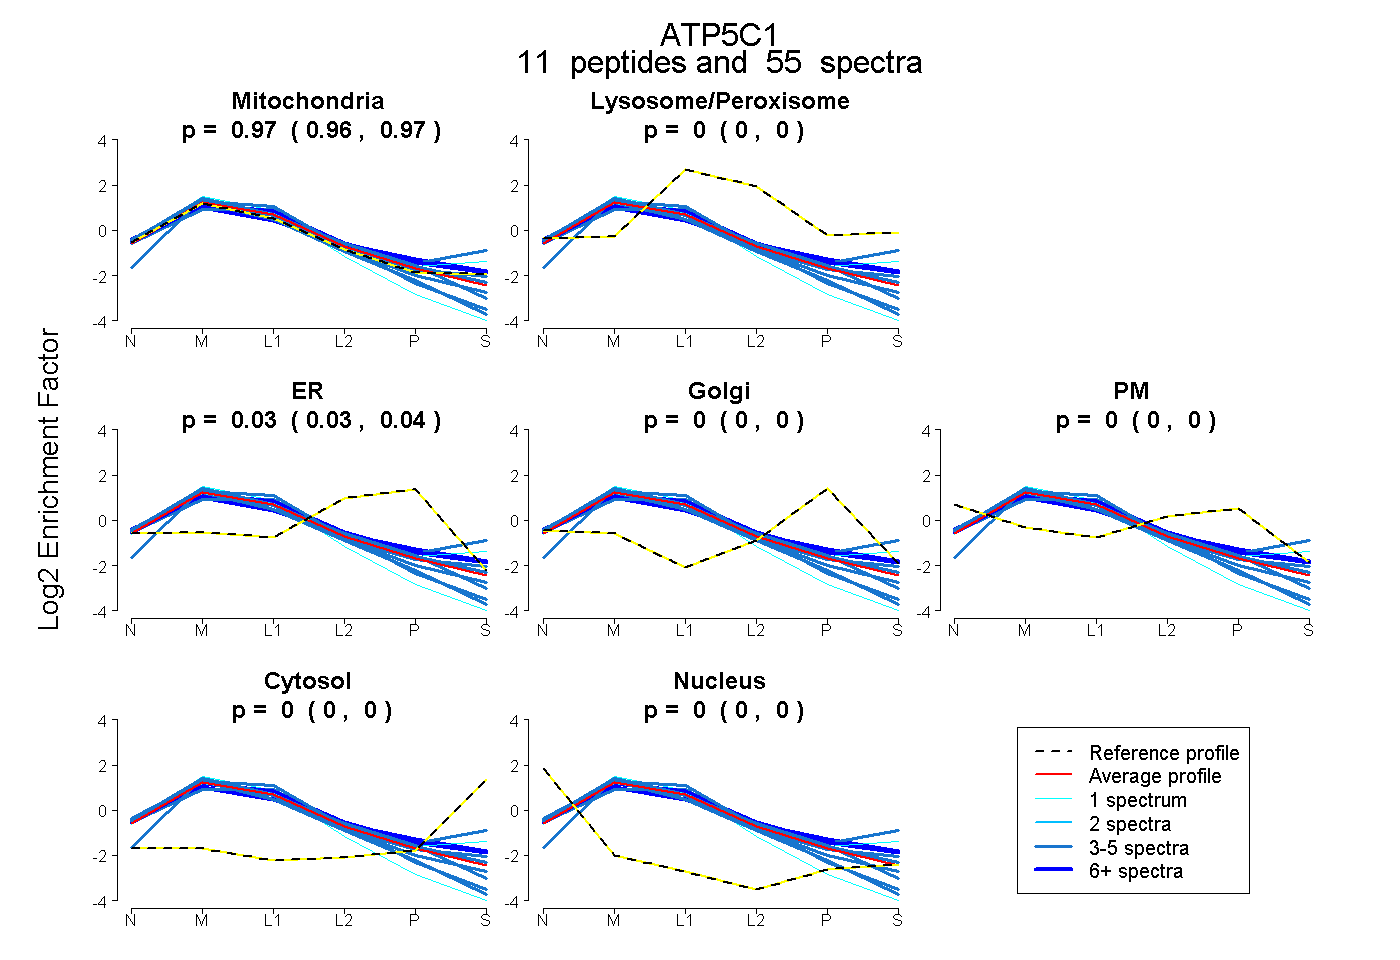 |
0.967
0.960 | 0.973 |
|
0.000
0.000 | 0.000 |
|
0.033
0.026 | 0.039 |
0.000
0.000 | 0.000 |
0.000
0.000 | 0.000 |
0.000
0.000 | 0.000 |
0.000
0.000 | 0.000 |
|
| 3 spectra, SVISYK |
0.946 |
|
0.054 |
|
0.000 |
0.000 |
0.000 |
0.000 |
0.000 |
|
| 5 spectra, LTLTFNR |
1.000 |
|
0.000 |
|
0.000 |
0.000 |
0.000 |
0.000 |
0.000 |
|
| 1 spectrum, QAVITK |
0.854 |
|
0.111 |
|
0.000 |
0.000 |
0.000 |
0.035 |
0.000 |
|
| 1 spectrum, ELKPAR |
0.996 |
|
0.000 |
|
0.000 |
0.000 |
0.000 |
0.000 |
0.004 |
|
| 5 spectra, ESTTSEQSAR |
0.979 |
|
0.000 |
|
0.000 |
0.000 |
0.000 |
0.000 |
0.021 |
|
| 3 spectra, GLCGAIHSSVAK |
0.714 |
|
0.186 |
|
0.000 |
0.000 |
0.000 |
0.100 |
0.000 |
|
| 4 spectra, THSDQFLVSFK |
0.928 |
|
0.000 |
|
0.072 |
0.000 |
0.000 |
0.000 |
0.000 |
|
| 11 spectra, HLIIGVSSDR |
0.868 |
|
0.094 |
|
0.038 |
0.000 |
0.000 |
0.000 |
0.000 |
|
| 3 spectra, NDMAALTAAGK |
0.961 |
|
0.000 |
|
0.000 |
0.000 |
0.039 |
0.000 |
0.000 |
|
| 14 spectra, EVMIVGIGEK |
0.804 |
|
0.061 |
|
0.000 |
0.059 |
0.076 |
0.000 |
0.000 |
|
| 5 spectra, VYGTGSLALYEK |
1.000 |
|
0.000 |
|
0.000 |
0.000 |
0.000 |
0.000 |
0.000 |
|
| | | Plot |
|
Lyso |
|
|
|
|
|
|
|
Other |
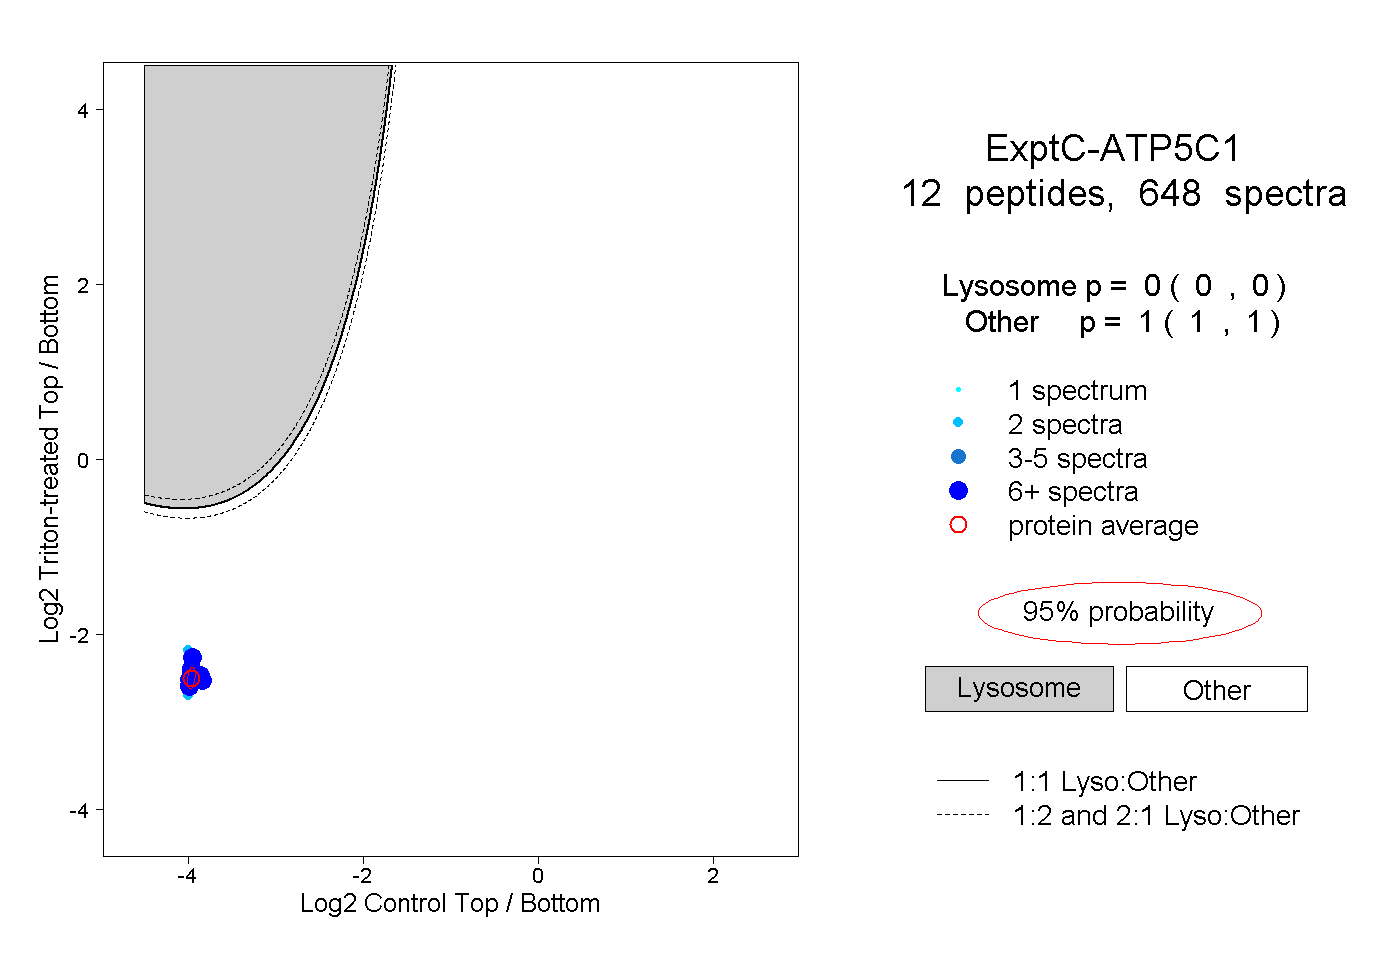
| Expt C |
12
peptides |
648
spectra |
 |
|
0.000
0.000 | 0.000 |
|
|
|
|
|
|
|
1.000
1.000 | 1.000 |
| | | Plot |
|
Lyso |
|
|
|
|
|
|
|
Other |
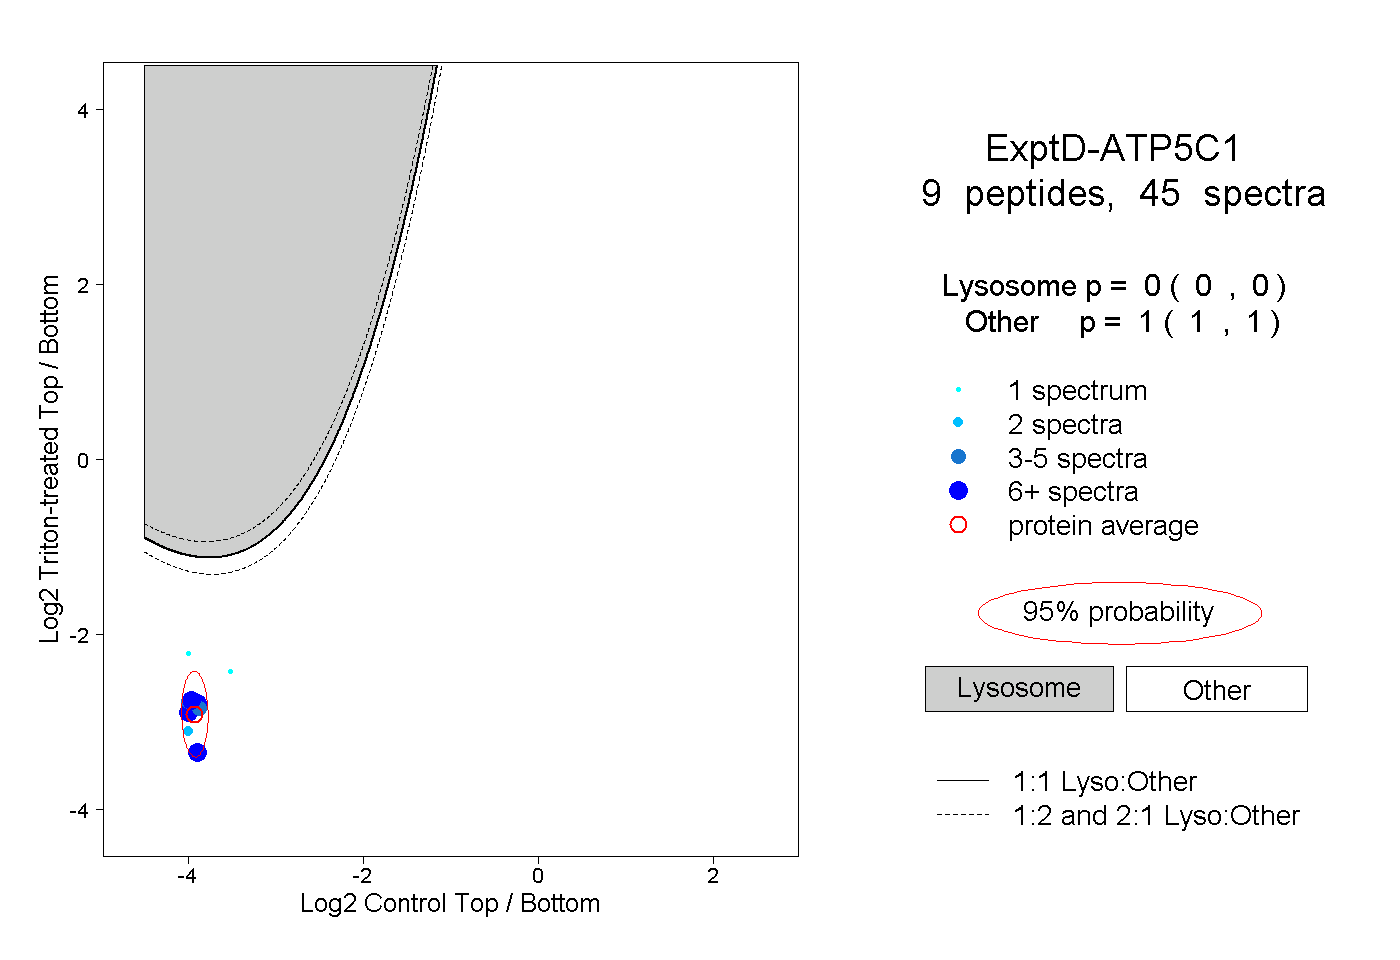
| Expt D |
9
peptides |
45
spectra |
 |
|
0.000
0.000 | 0.000 |
|
|
|
|
|
|
|
1.000
1.000 | 1.000 |