 13
13peptides
spectra
0.825 | 0.833
0.000 | 0.000
0.000 | 0.000
0.040 | 0.056
0.000 | 0.000
0.113 | 0.130
0.000 | 0.000
0.000 | 0.000
| Plot | Mito | Lyso | Perox | ER | Golgi | PM | Cytosol | Nucleus | |||||
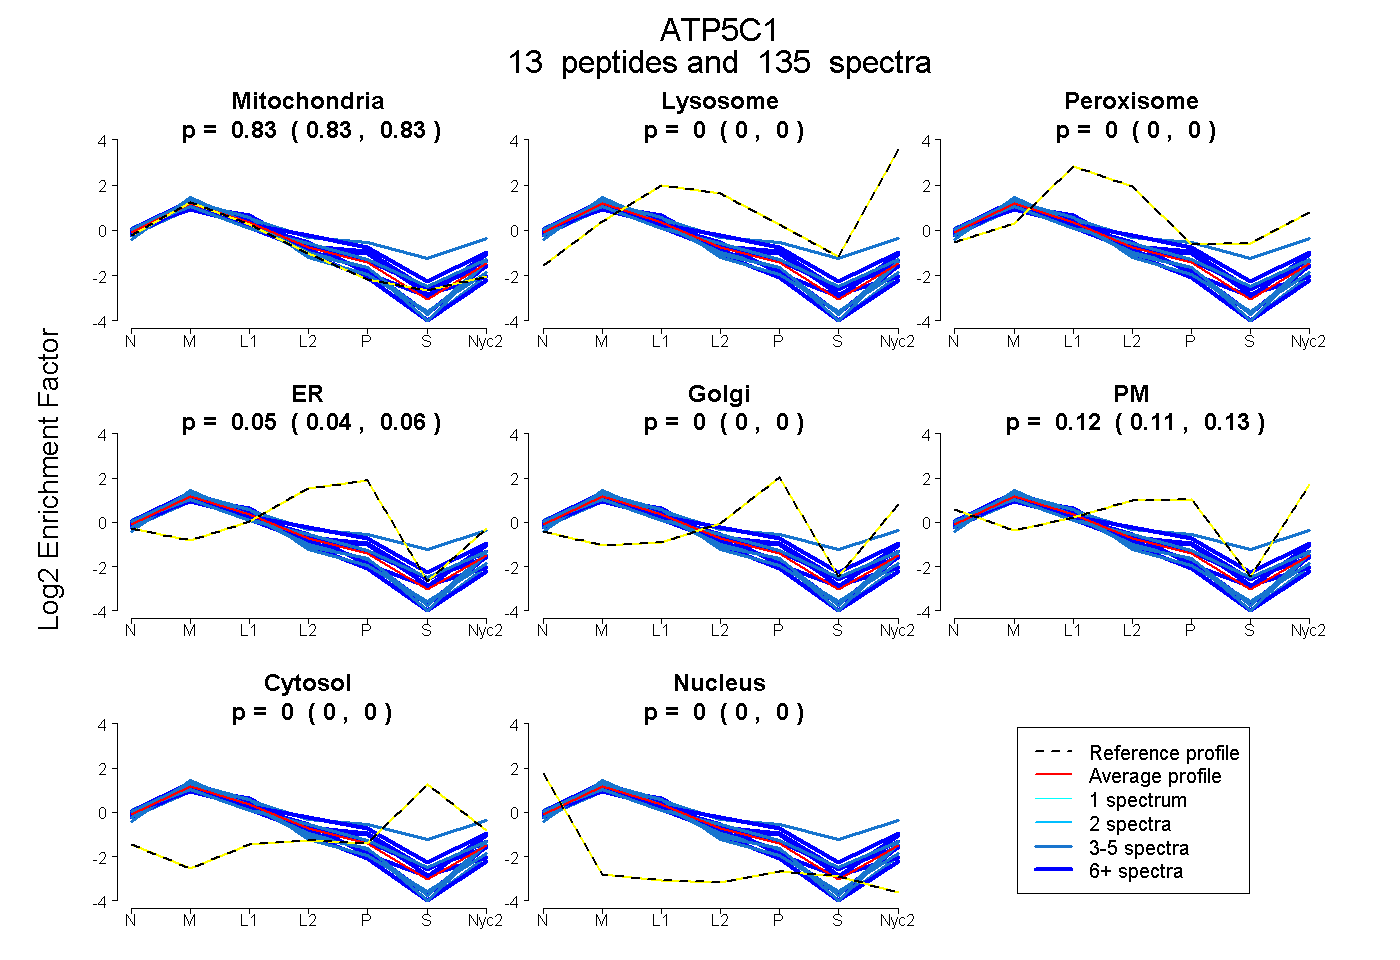
| Expt A |
13 peptides |
135 spectra |
|
0.830 0.825 | 0.833 |
0.000 0.000 | 0.000 |
0.000 0.000 | 0.000 |
0.049 0.040 | 0.056 |
0.000 0.000 | 0.000 |
0.122 0.113 | 0.130 |
0.000 0.000 | 0.000 |
0.000 0.000 | 0.000 |
| 5 spectra, SVISYK | 0.967 | 0.000 | 0.000 | 0.000 | 0.000 | 0.033 | 0.000 | 0.000 | ||
| 19 spectra, LTLTFNR | 0.895 | 0.000 | 0.000 | 0.005 | 0.012 | 0.089 | 0.000 | 0.000 | ||
| 14 spectra, MTAMDNASK | 0.748 | 0.039 | 0.000 | 0.104 | 0.080 | 0.028 | 0.000 | 0.000 | ||
| 3 spectra, QAVITK | 0.884 | 0.000 | 0.000 | 0.000 | 0.005 | 0.111 | 0.000 | 0.000 | ||
| 3 spectra, ELKPAR | 0.927 | 0.000 | 0.000 | 0.073 | 0.000 | 0.000 | 0.000 | 0.000 | ||
| 23 spectra, ESTTSEQSAR | 0.990 | 0.000 | 0.000 | 0.000 | 0.000 | 0.000 | 0.000 | 0.010 | ||
| 9 spectra, GLCGAIHSSVAK | 0.819 | 0.000 | 0.000 | 0.181 | 0.000 | 0.000 | 0.000 | 0.000 | ||
| 13 spectra, THSDQFLVSFK | 0.627 | 0.000 | 0.053 | 0.089 | 0.036 | 0.194 | 0.000 | 0.000 | ||
| 3 spectra, NASDMIDK | 0.894 | 0.000 | 0.000 | 0.000 | 0.023 | 0.083 | 0.000 | 0.000 | ||
| 5 spectra, HLIIGVSSDR | 0.471 | 0.099 | 0.195 | 0.000 | 0.164 | 0.000 | 0.071 | 0.000 | ||
| 17 spectra, NDMAALTAAGK | 0.823 | 0.038 | 0.000 | 0.000 | 0.000 | 0.139 | 0.000 | 0.000 | ||
| 17 spectra, EVMIVGIGEK | 0.808 | 0.000 | 0.017 | 0.102 | 0.022 | 0.051 | 0.000 | 0.000 | ||
| 4 spectra, VYGTGSLALYEK | 0.769 | 0.000 | 0.000 | 0.026 | 0.028 | 0.177 | 0.000 | 0.000 |
| Plot | Mito | Lyso or Perox | ER | Golgi | PM | Cytosol | Nucleus | ||||||
| Expt B |
11 peptides |
55 spectra |
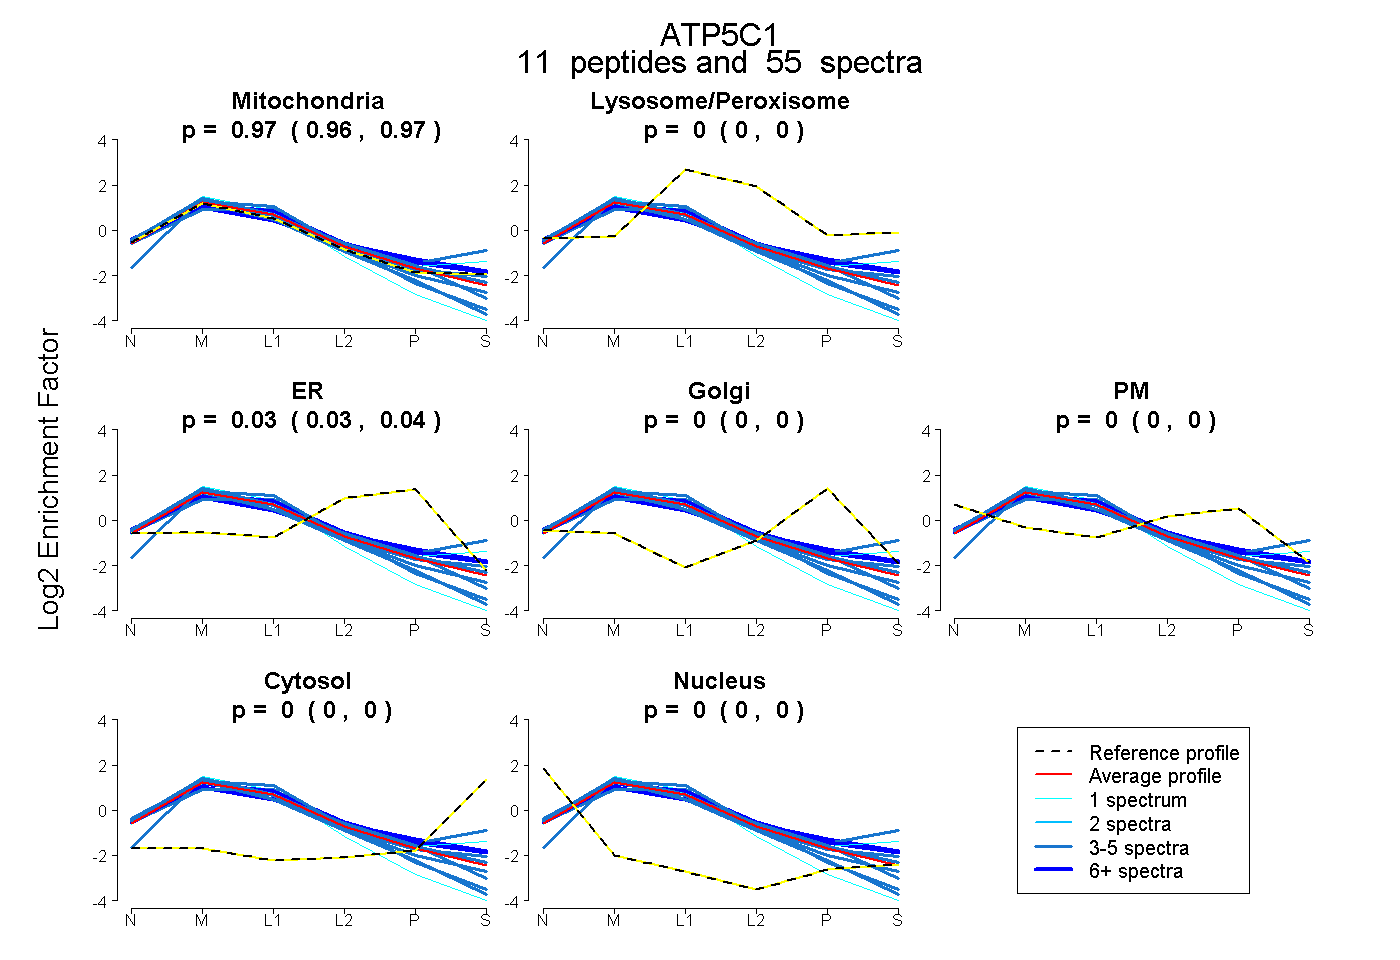 |
0.967 0.960 | 0.973 |
0.000 0.000 | 0.000 |
0.033 0.026 | 0.039 |
0.000 0.000 | 0.000 |
0.000 0.000 | 0.000 |
0.000 0.000 | 0.000 |
0.000 0.000 | 0.000 |
|||
| Plot | Lyso | Other | |||||||||||
| Expt C |
12 peptides |
648 spectra |
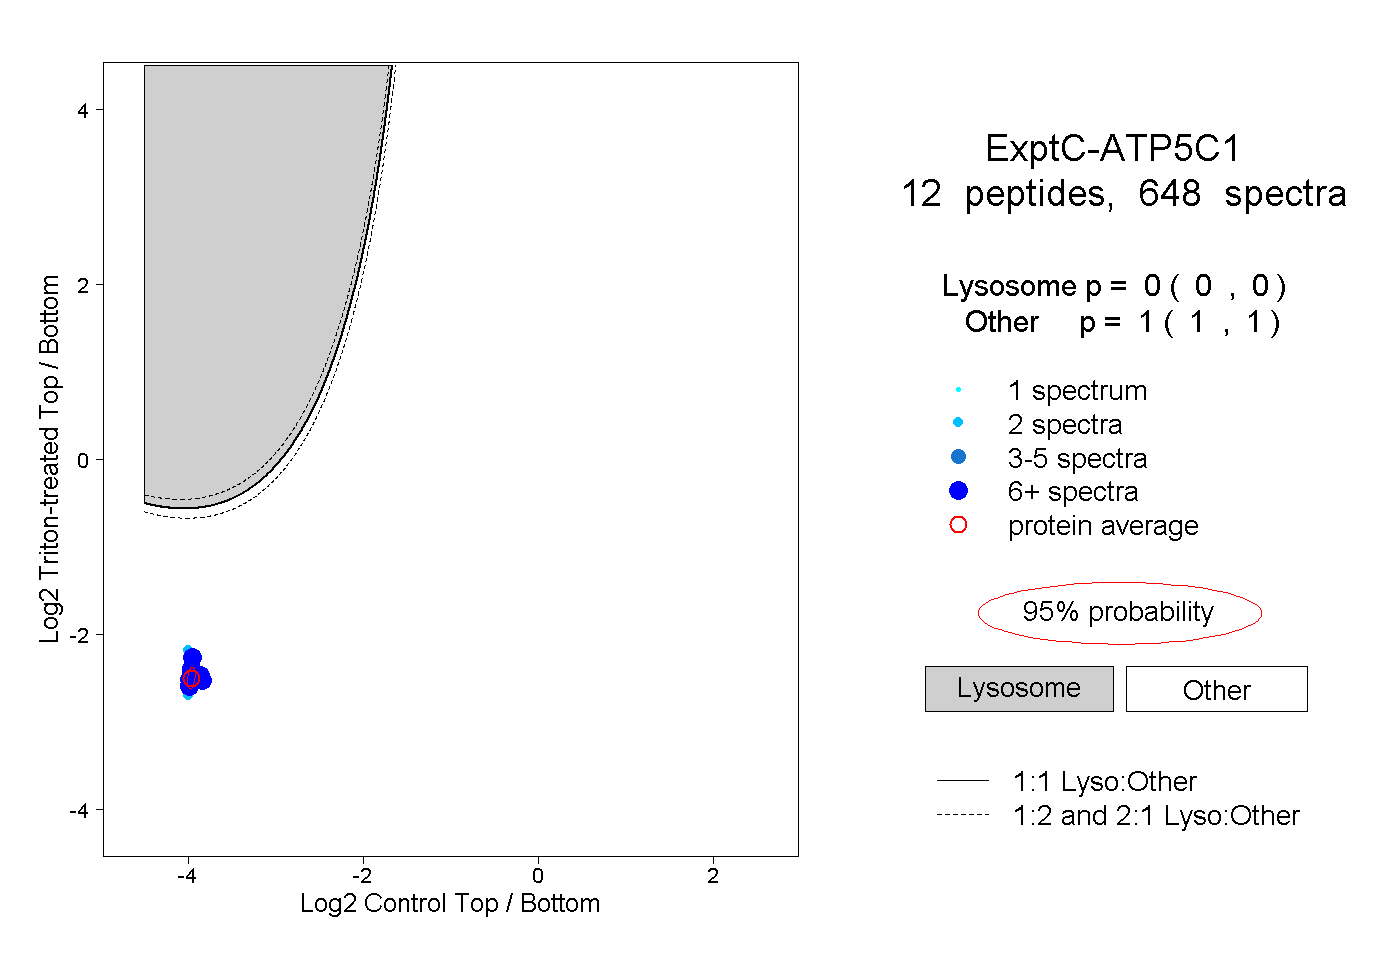 |
0.000 0.000 | 0.000 |
1.000 1.000 | 1.000 |
||||||||
| Plot | Lyso | Other | |||||||||||
| Expt D |
9 peptides |
45 spectra |
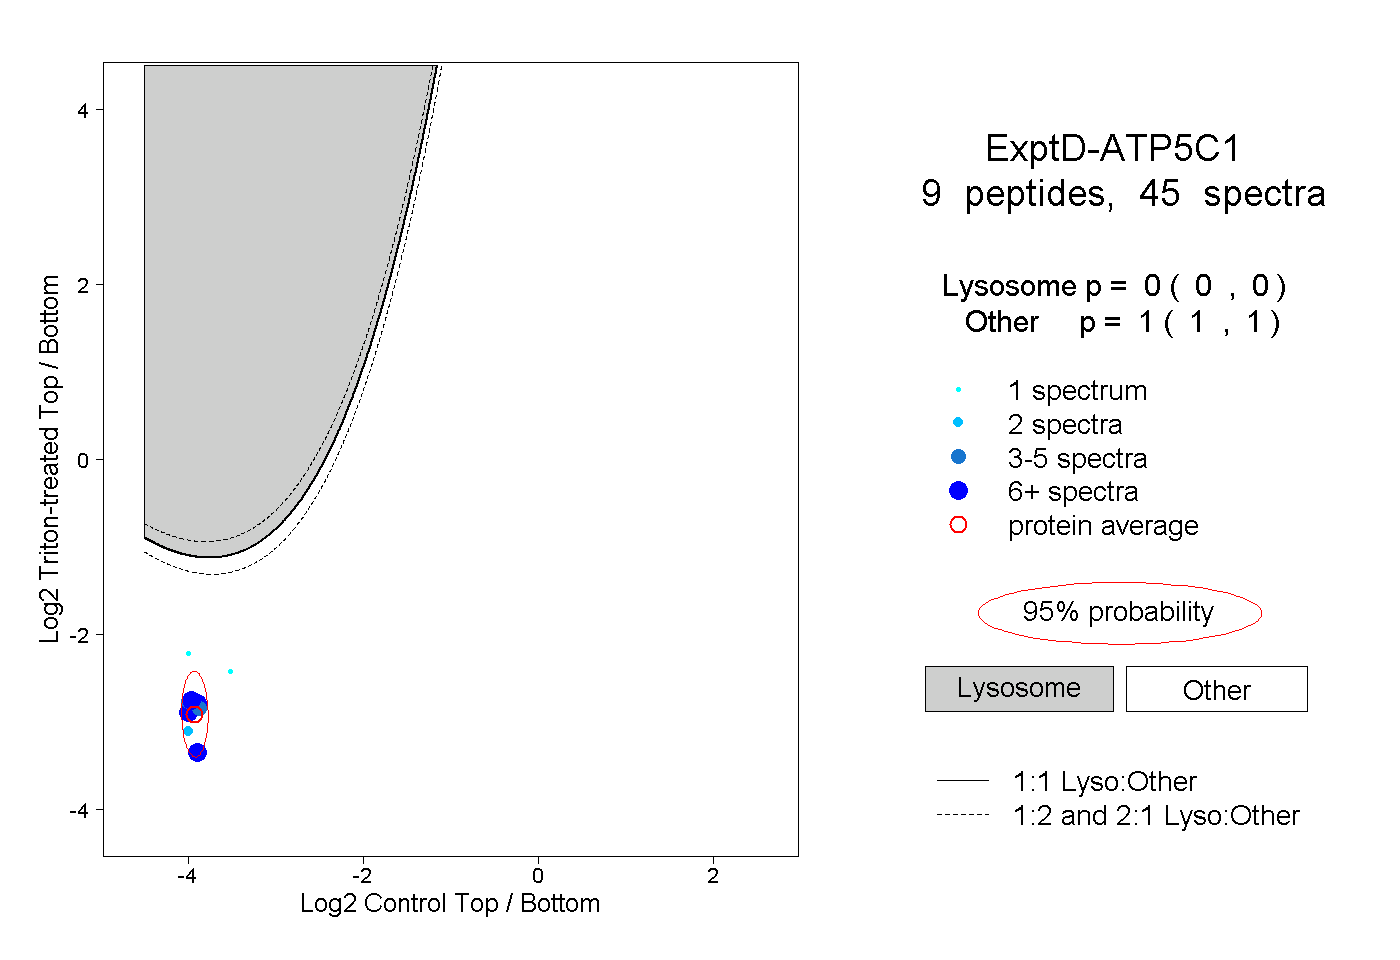 |
0.000 0.000 | 0.000 |
1.000 1.000 | 1.000 |