 25
25peptides
spectra
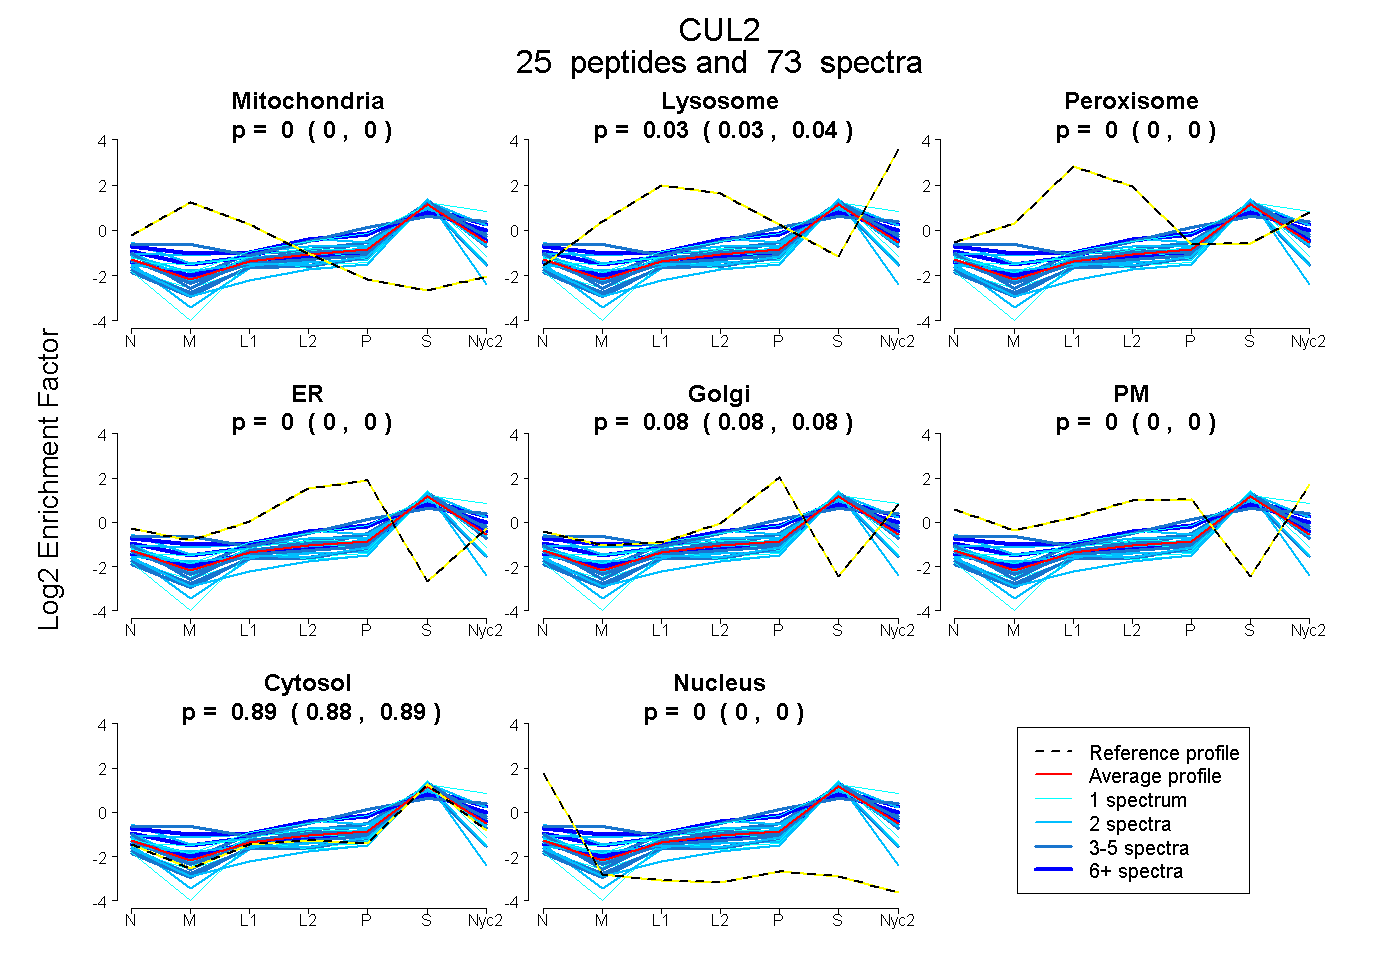
0.000 | 0.000
0.030 | 0.039
0.000 | 0.000
0.000 | 0.000
0.075 | 0.084
0.000 | 0.000
0.882 | 0.888
0.000 | 0.000
8peptides
spectra
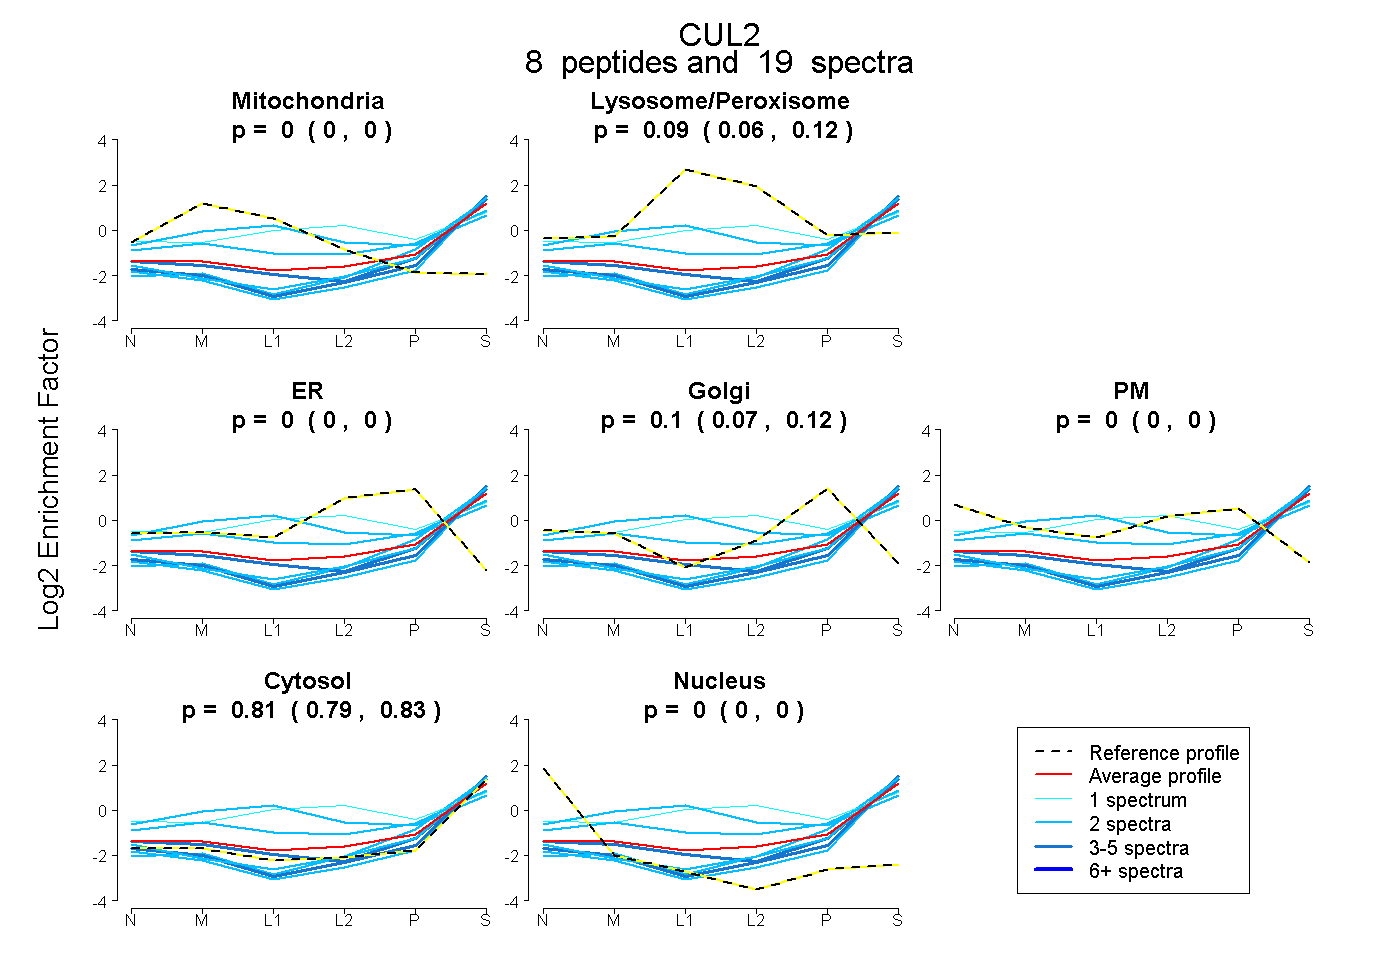
0.000 | 0.000
0.057 | 0.118
0.000 | 0.000
0.073 | 0.121
0.000 | 0.004
0.790 | 0.827
0.000 | 0.000
22peptides
spectra
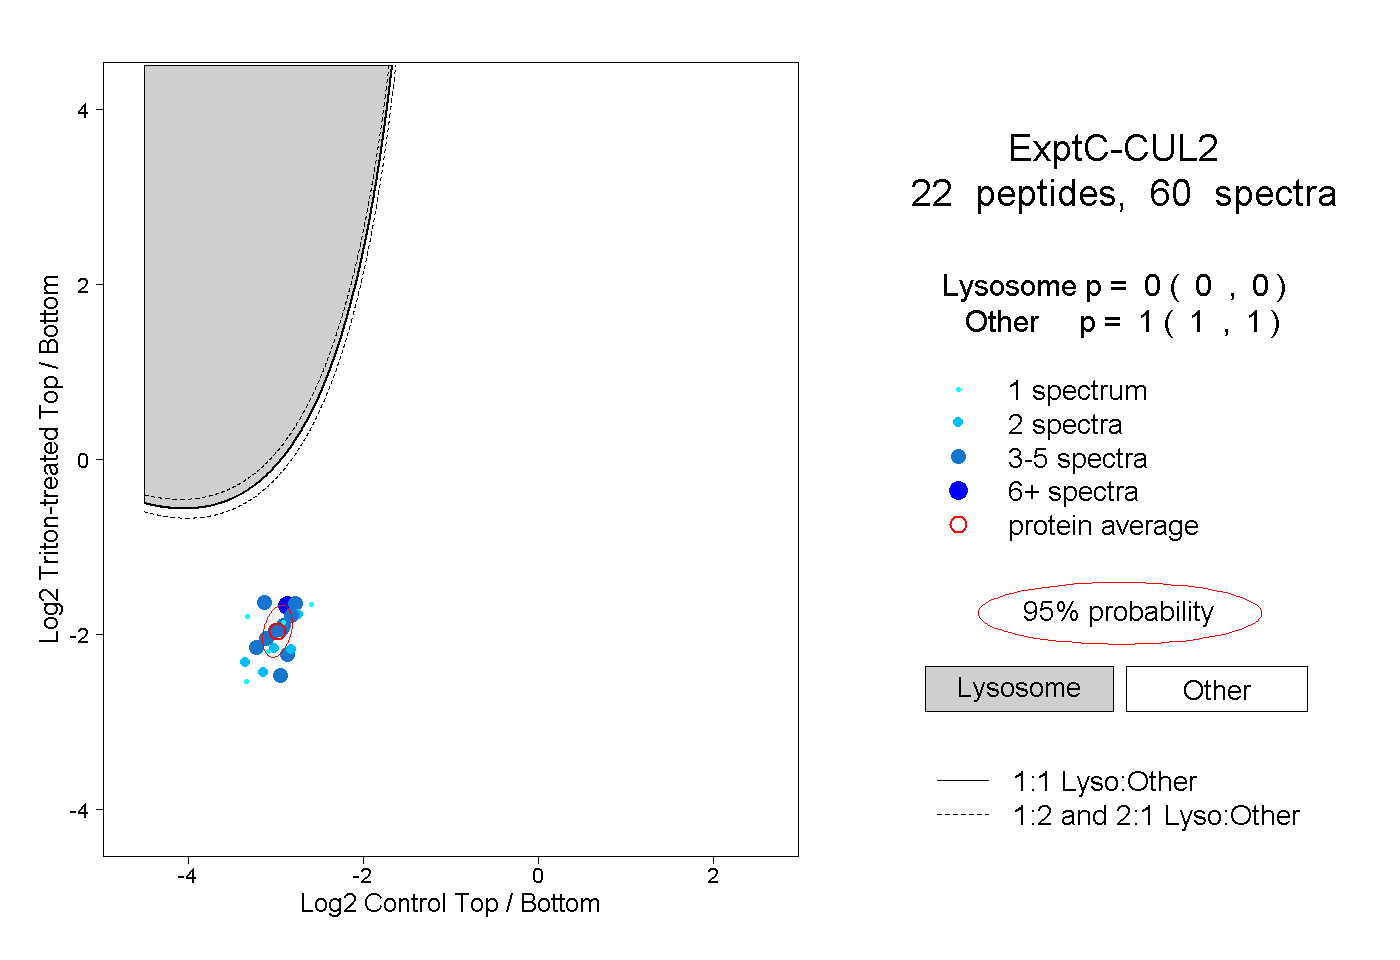
0.000 | 0.000
1.000 | 1.000
2peptides
spectra
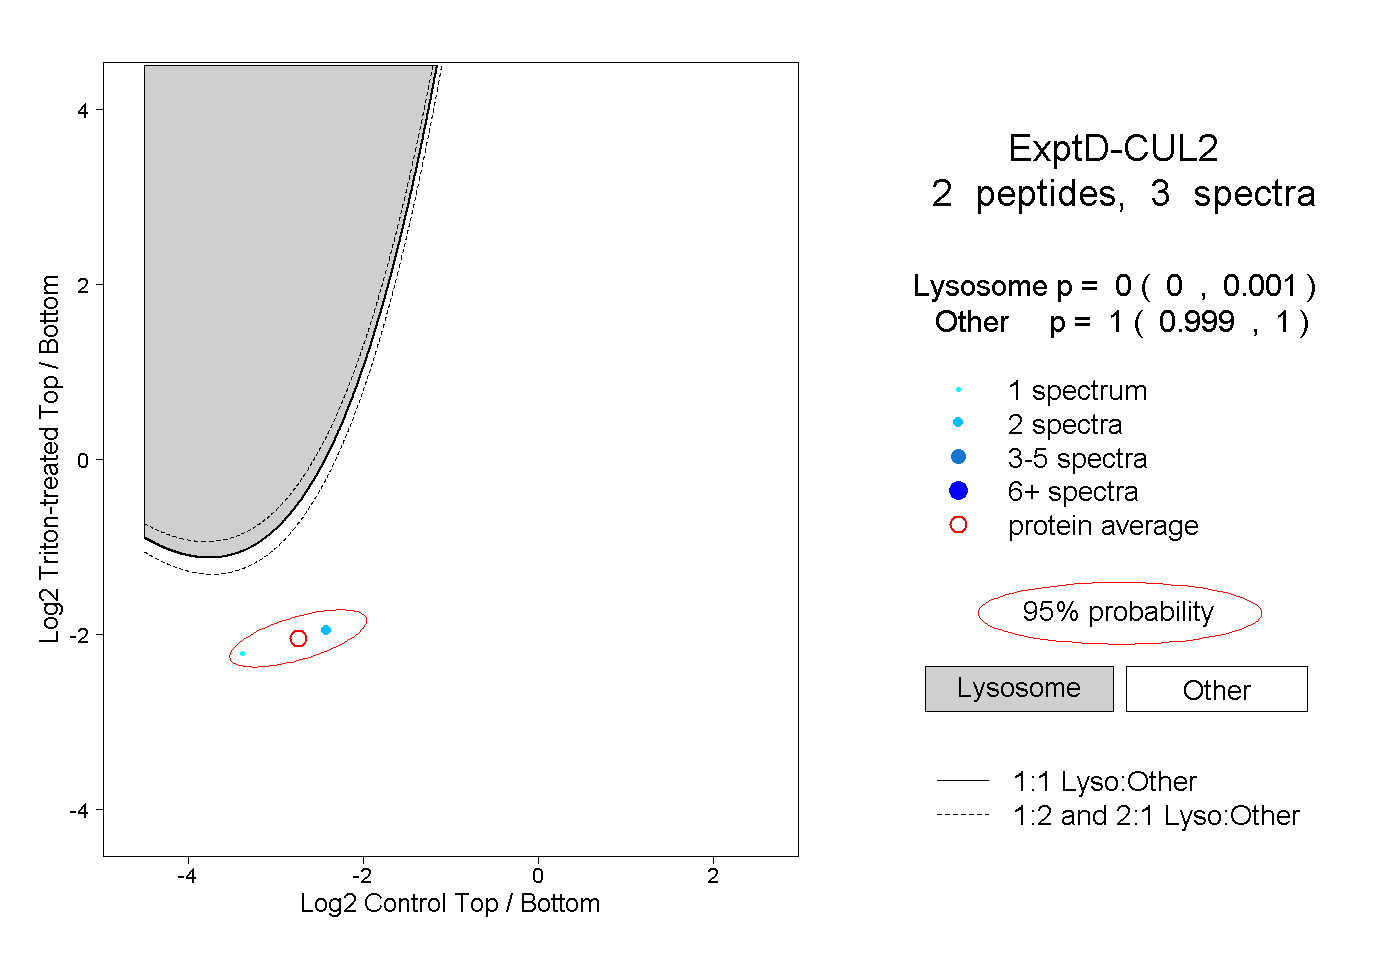
0.000 | 0.001
0.999 | 1.000