CUL2
[ENSRNOP00000061765]
Main page
| | | Plot |
Mito |
Lyso |
|
Perox |
ER |
Golgi |
PM |
Cytosol |
Nucleus |
|
| Expt A |
 25
25
peptides |
73
spectra |
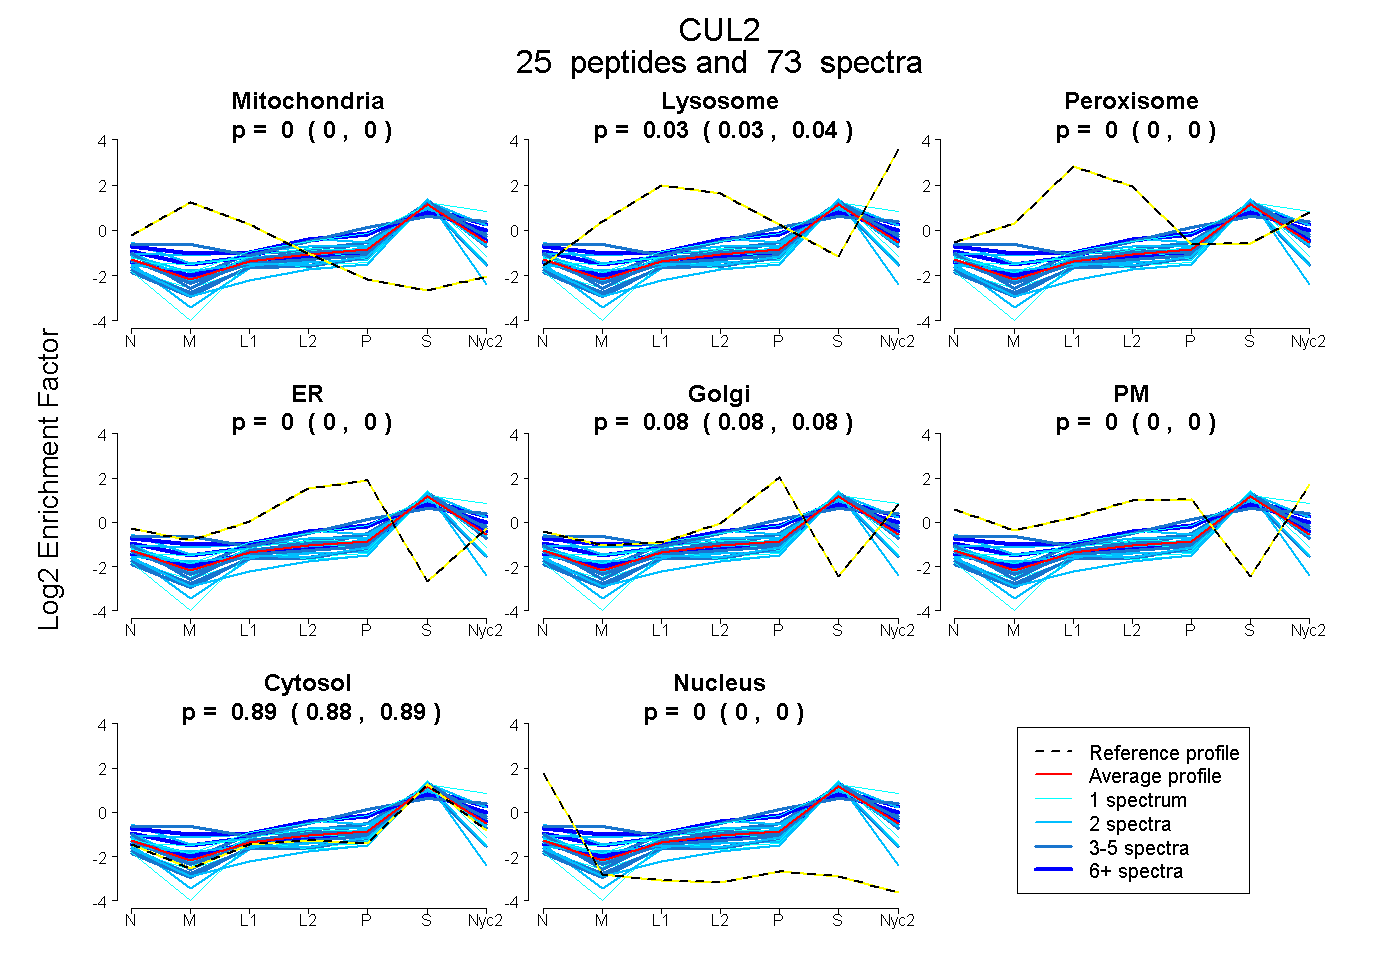 |
0.000
0.000 | 0.000 |
0.035
0.030 | 0.039 |
|
0.000
0.000 | 0.000 |
0.000
0.000 | 0.000 |
0.080
0.075 | 0.084 |
0.000
0.000 | 0.000 |
0.885
0.882 | 0.888 |
0.000
0.000 | 0.000 |
|
| | | Plot |
Mito |
|
Lyso or Perox |
|
ER |
Golgi |
PM |
Cytosol |
Nucleus |
|
| Expt B |
8
peptides |
19
spectra |
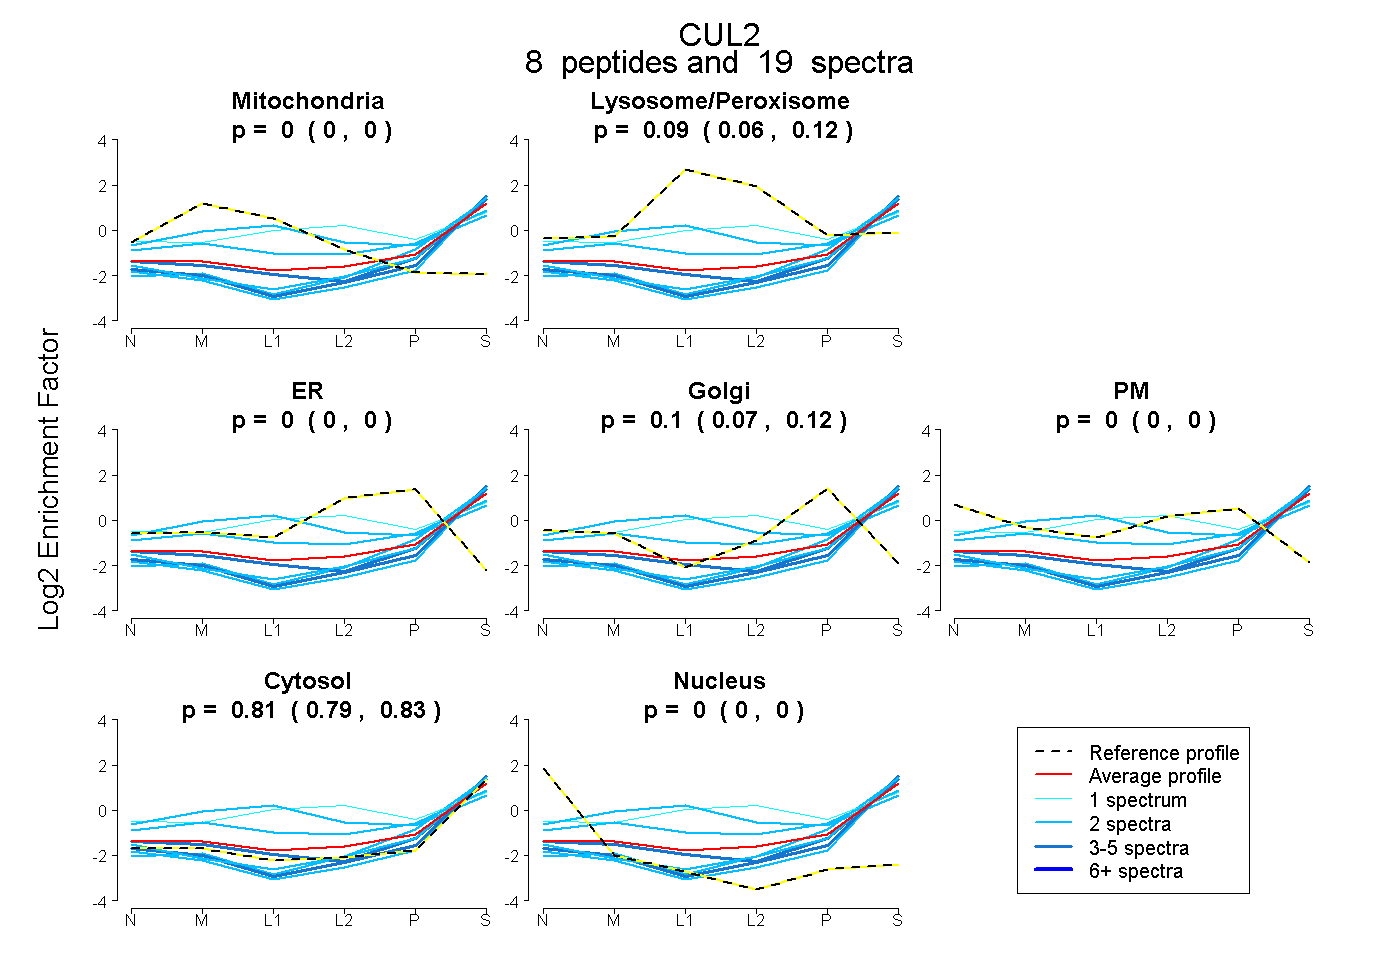 |
0.000
0.000 | 0.000 |
|
0.091
0.057 | 0.118 |
|
0.000
0.000 | 0.000 |
0.099
0.073 | 0.121 |
0.000
0.000 | 0.004 |
0.809
0.790 | 0.827 |
0.000
0.000 | 0.000 |
|
| 5 spectra, MYLQAAIVR |
0.000 |
|
0.000 |
|
0.000 |
0.000 |
0.000 |
0.995 |
0.005 |
|
| 2 spectra, FNNFIR |
0.000 |
|
0.000 |
|
0.000 |
0.000 |
0.000 |
0.996 |
0.004 |
|
| 2 spectra, VVDFDETWNK |
0.000 |
|
0.000 |
|
0.000 |
0.047 |
0.000 |
0.953 |
0.000 |
|
| 1 spectrum, HIHDEGLR |
0.000 |
|
0.461 |
|
0.000 |
0.016 |
0.124 |
0.399 |
0.000 |
|
| 3 spectra, DTPQELEQTR |
0.000 |
|
0.017 |
|
0.000 |
0.068 |
0.000 |
0.913 |
0.002 |
|
| 2 spectra, HNALIQEVISQSR |
0.147 |
|
0.398 |
|
0.000 |
0.051 |
0.000 |
0.404 |
0.000 |
|
| 2 spectra, AVVMLEYVER |
0.000 |
|
0.000 |
|
0.000 |
0.083 |
0.000 |
0.917 |
0.000 |
|
| 2 spectra, IFLENHVR |
0.014 |
|
0.237 |
|
0.000 |
0.159 |
0.010 |
0.580 |
0.000 |
|
| | | Plot |
|
Lyso |
|
|
|
|
|
|
|
Other |
| Expt C |
22
peptides |
60
spectra |
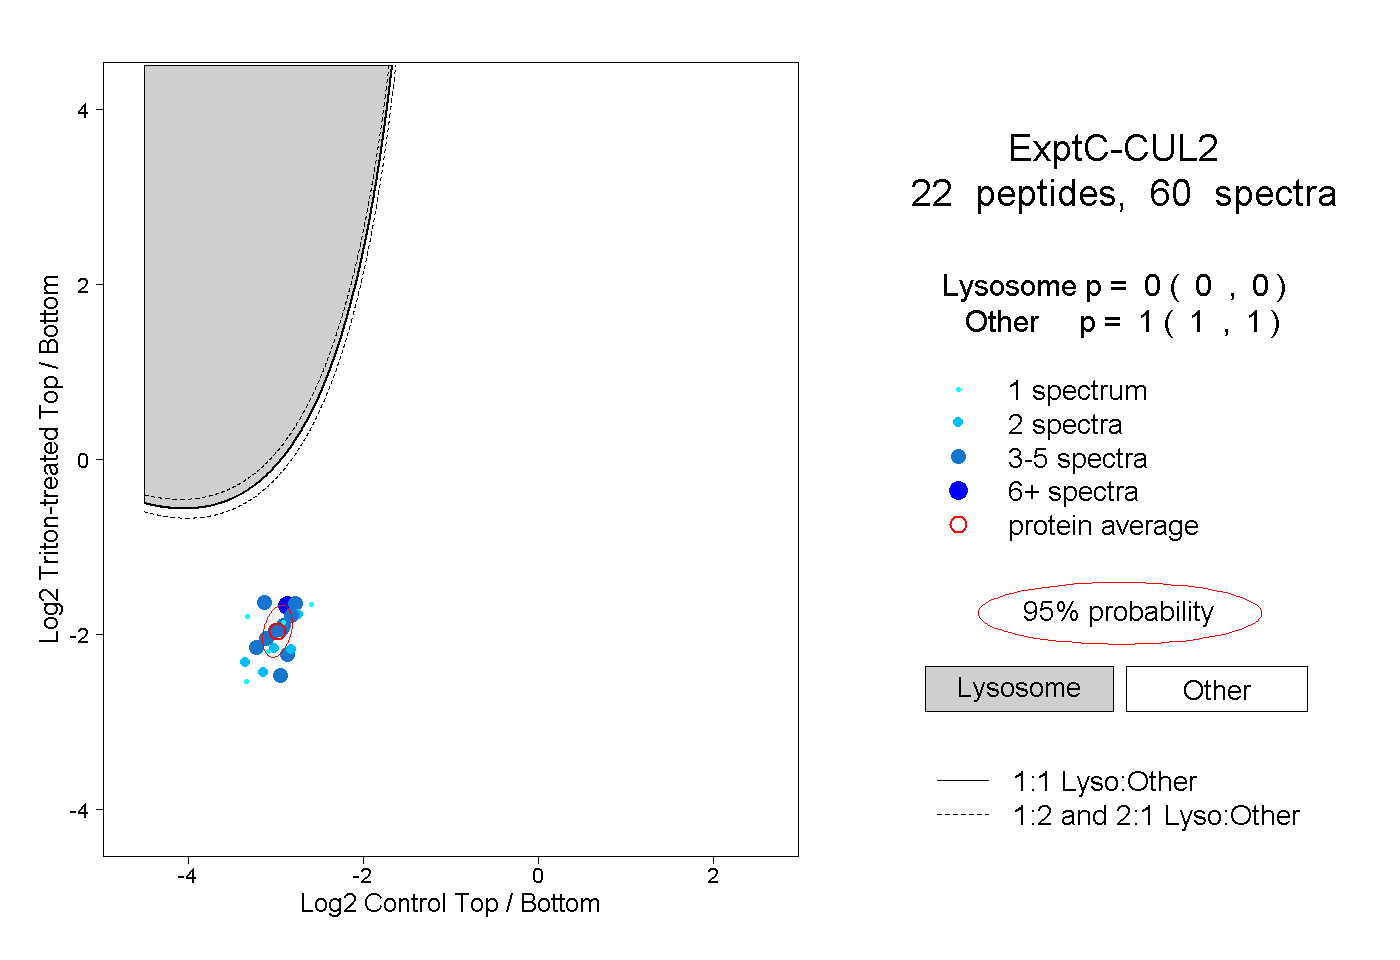 |
|
0.000
0.000 | 0.000 |
|
|
|
|
|
|
|
1.000
1.000 | 1.000 |
| | | Plot |
|
Lyso |
|
|
|
|
|
|
|
Other |
| Expt D |
2
peptides |
3
spectra |
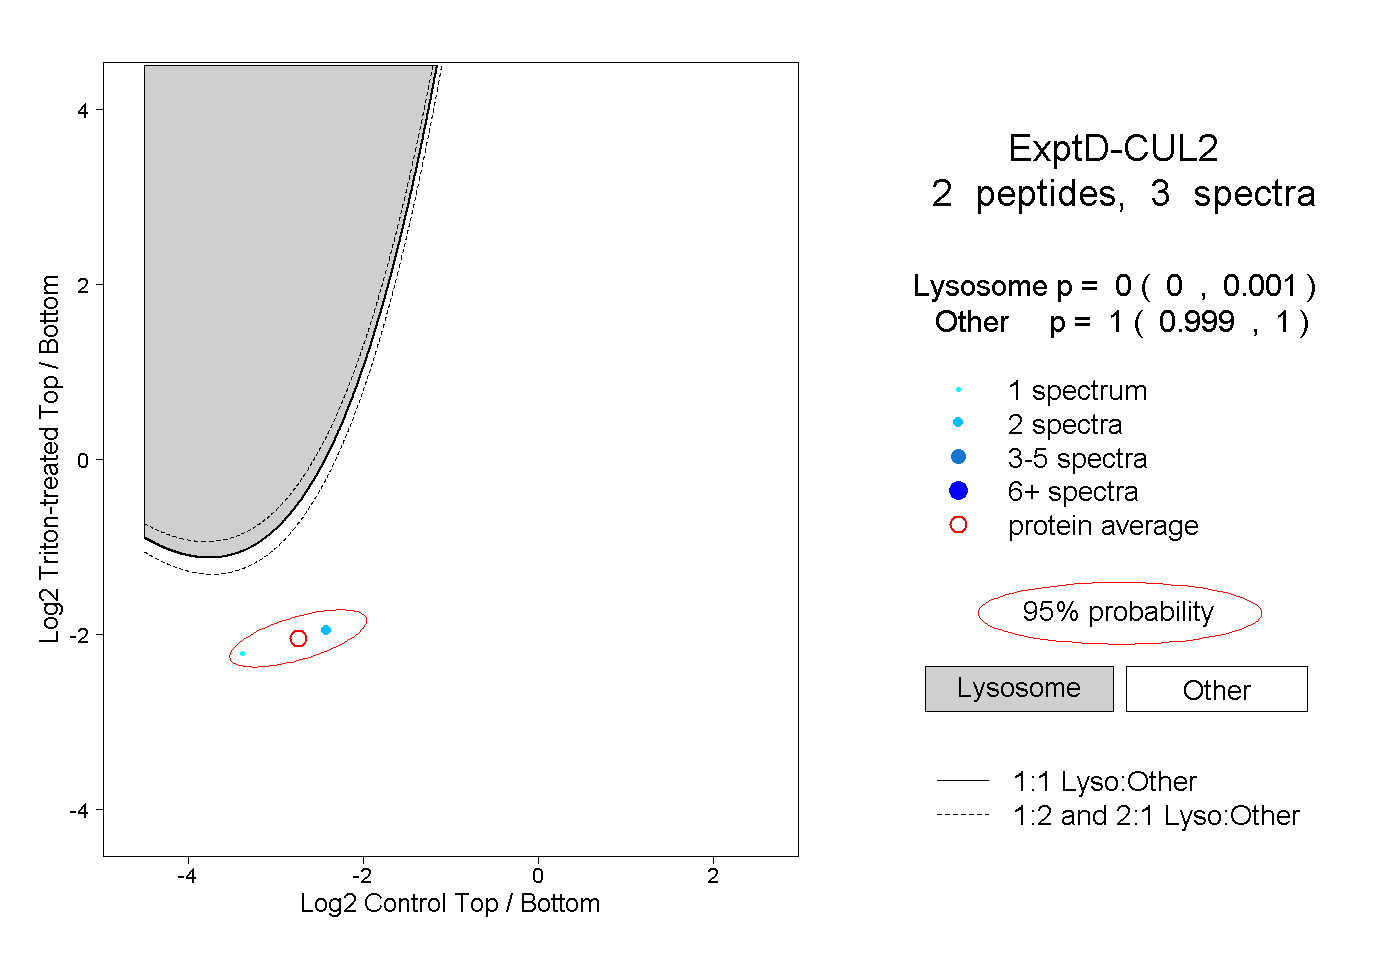 |
|
0.000
0.000 | 0.001 |
|
|
|
|
|
|
|
1.000
0.999 | 1.000 |