 9
9peptides
spectra
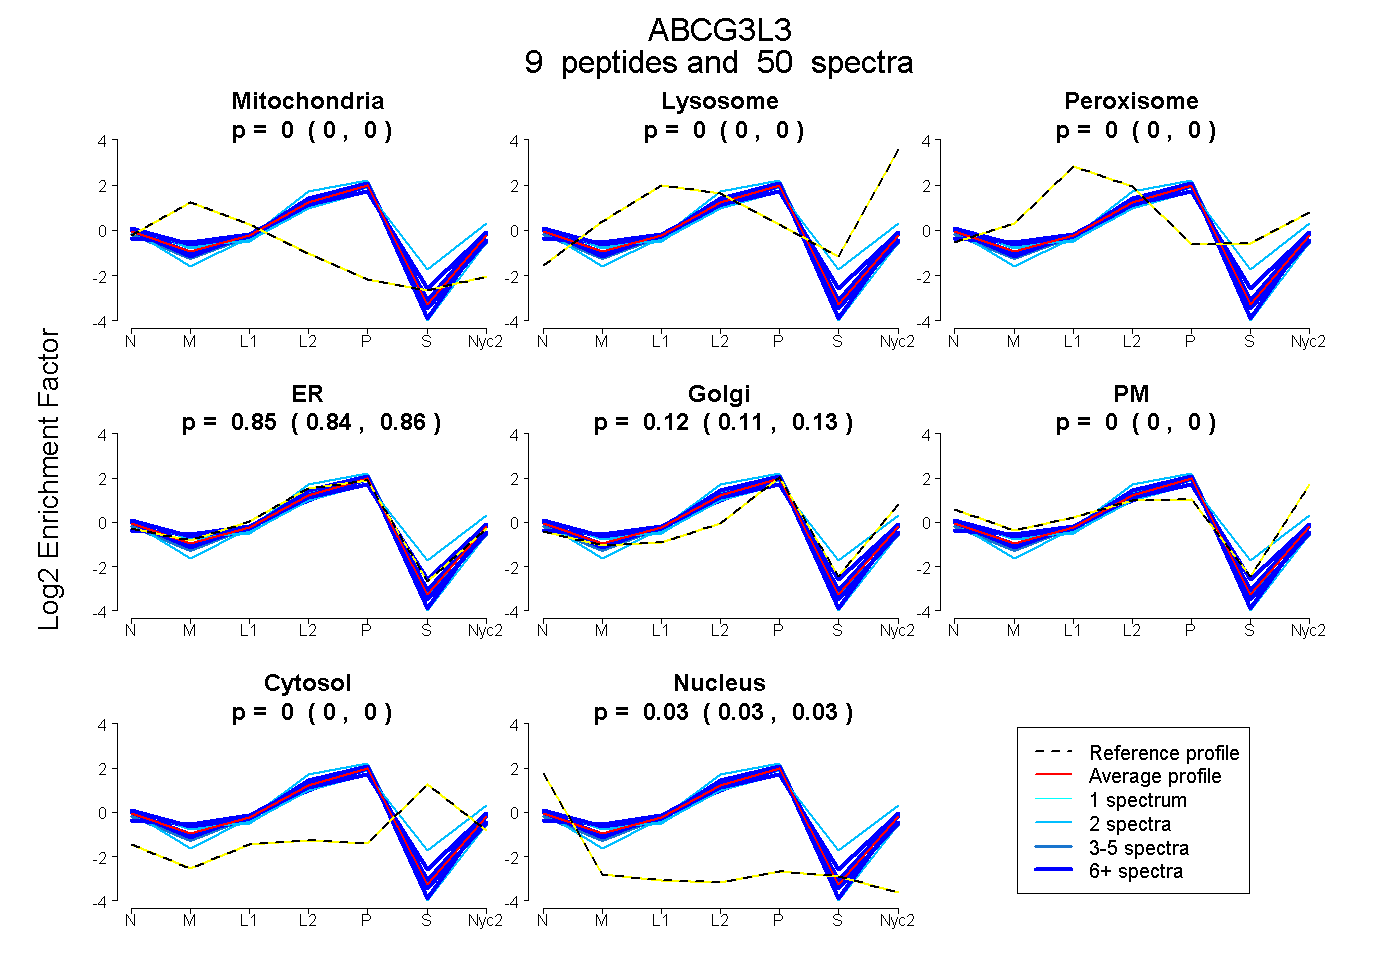
0.000 | 0.000
0.000 | 0.000
0.000 | 0.000
0.841 | 0.857
0.112 | 0.131
0.000 | 0.000
0.000 | 0.000
0.026 | 0.030
6peptides
spectra
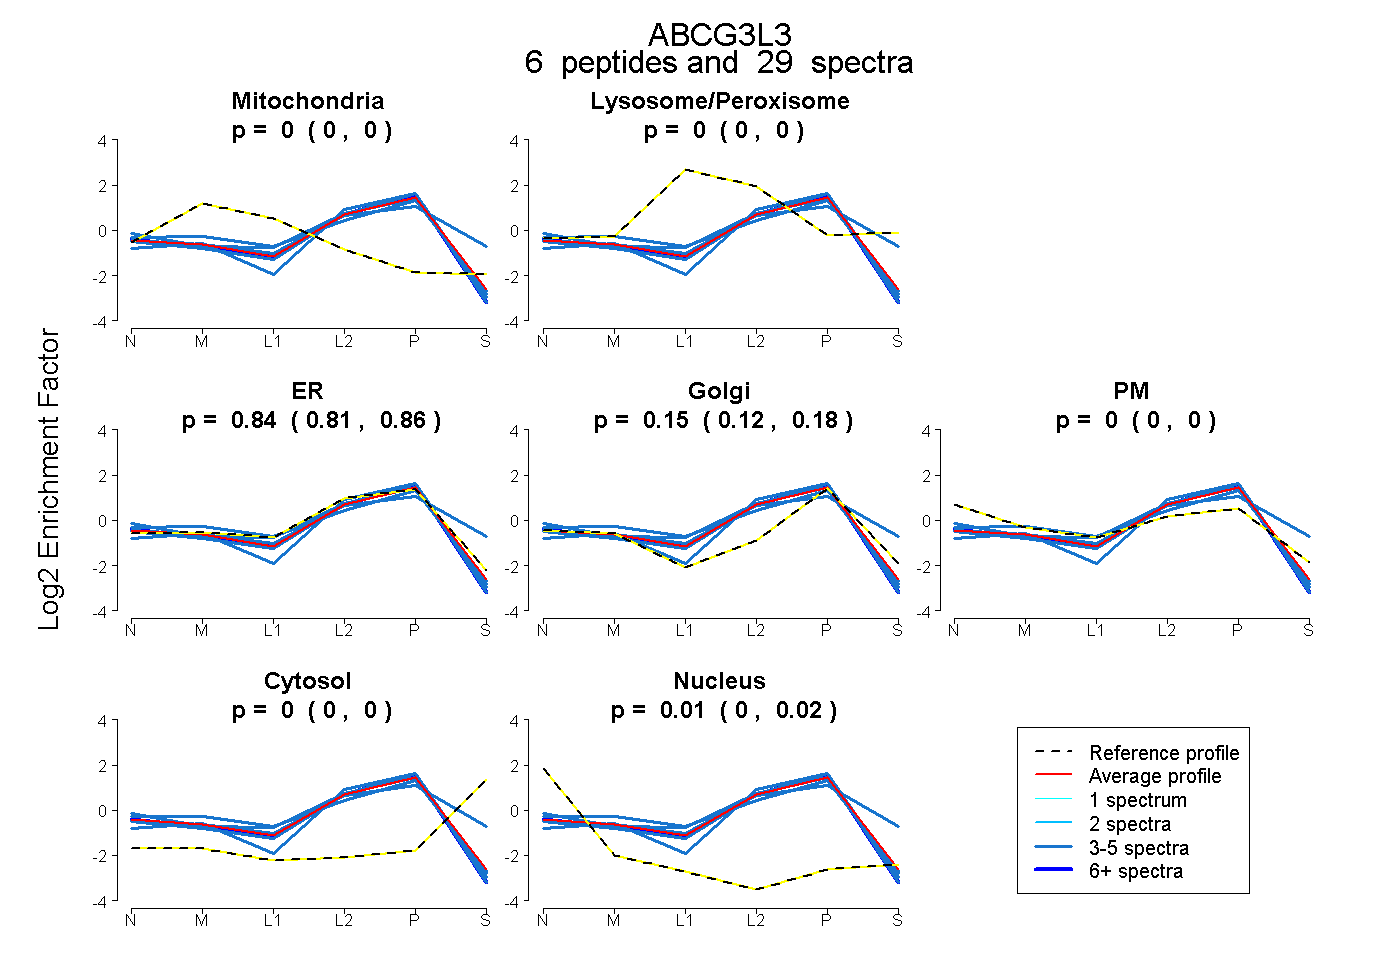
0.000 | 0.000
0.000 | 0.000
0.810 | 0.856
0.120 | 0.178
0.000 | 0.000
0.000 | 0.000
0.004 | 0.020
8peptides
spectra
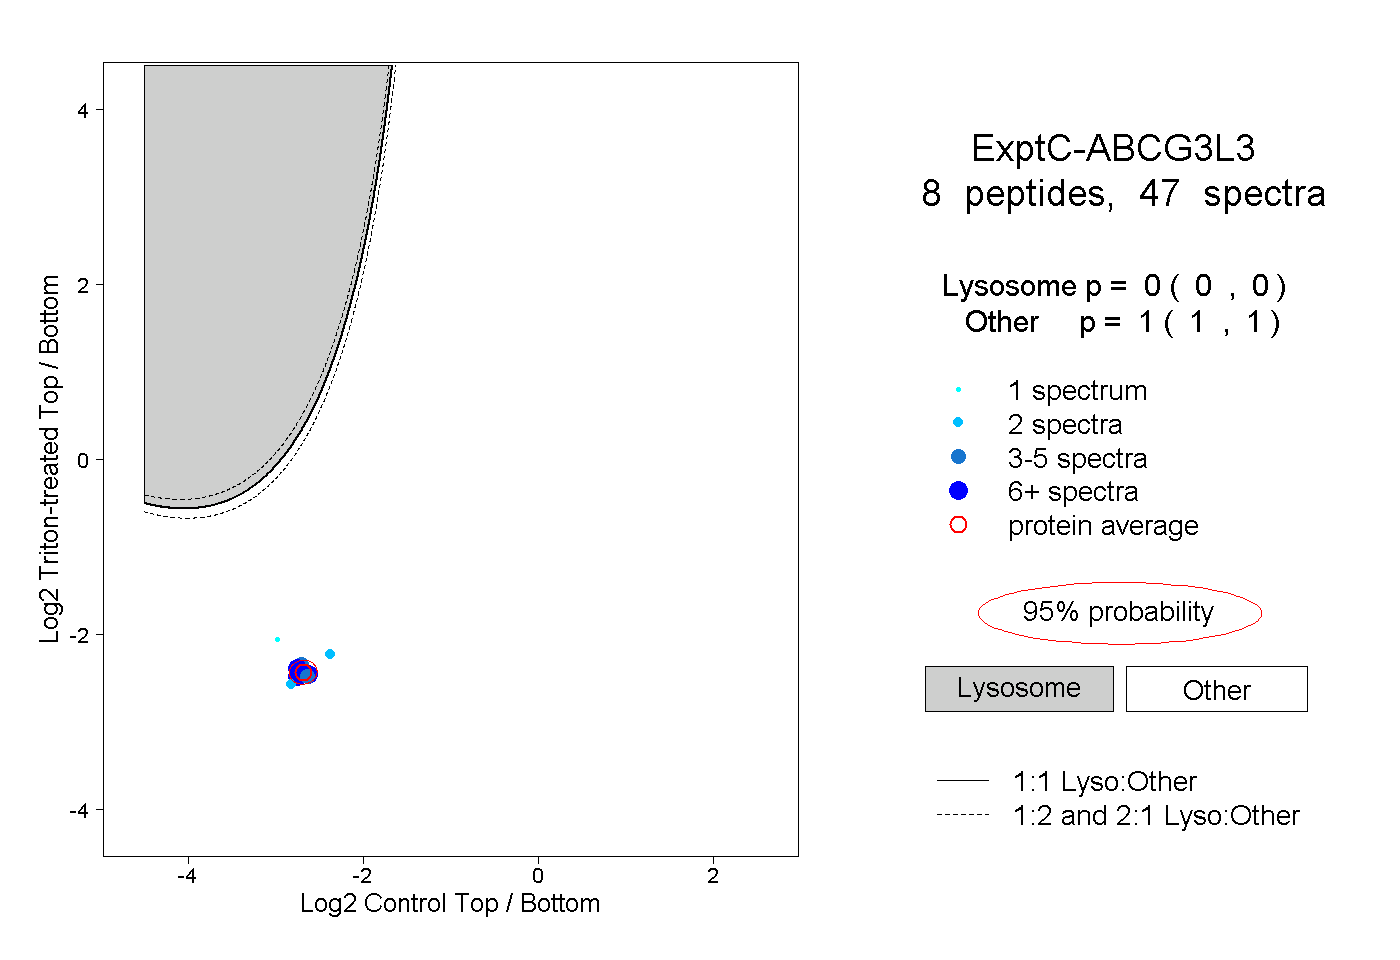
0.000 | 0.000
1.000 | 1.000
4peptides
spectra
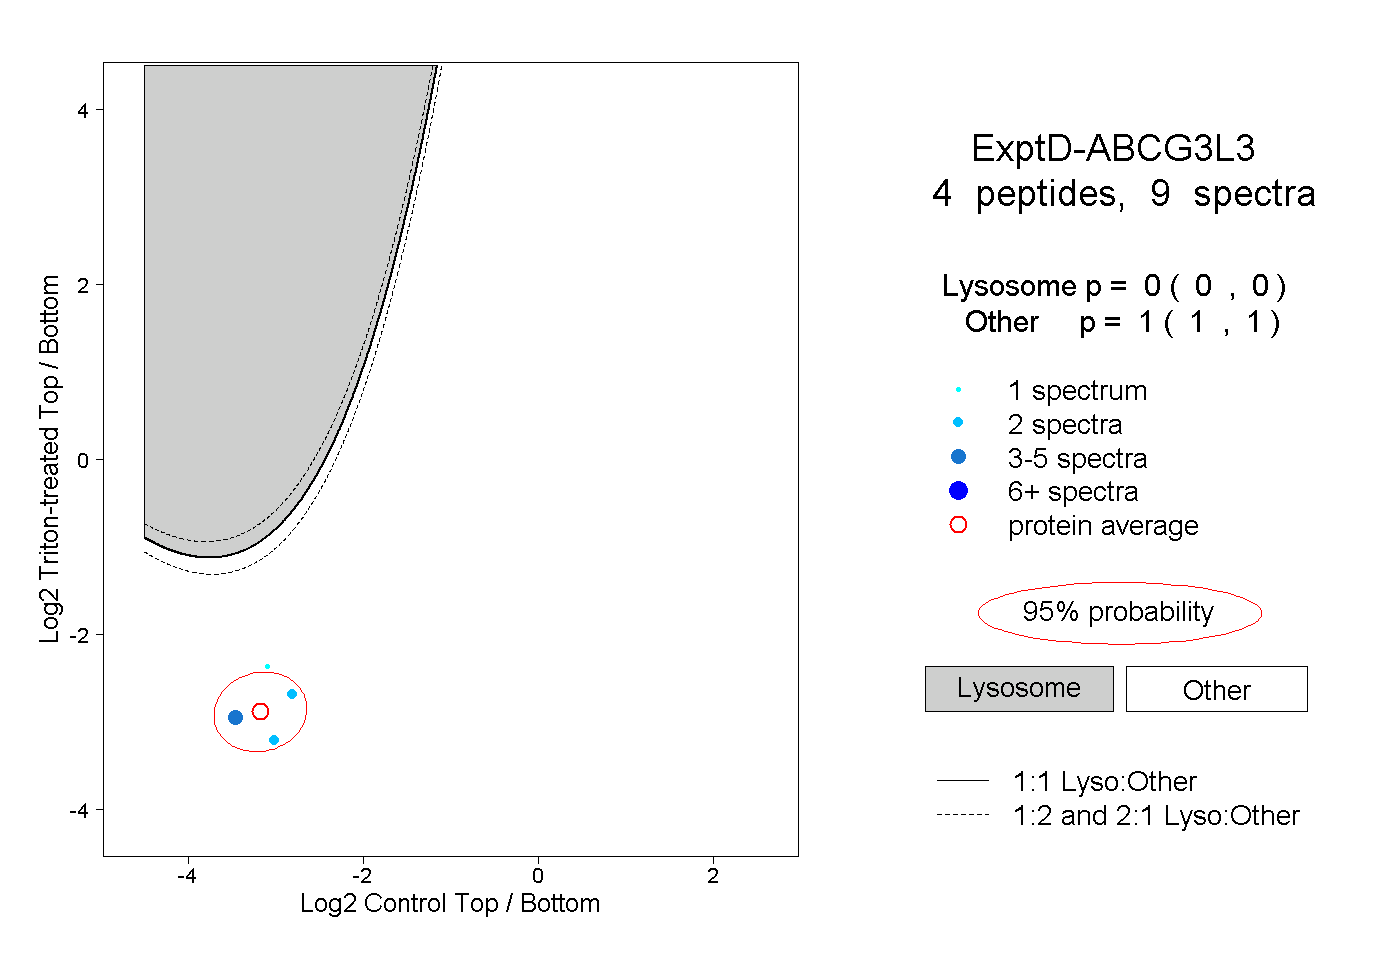
0.000 | 0.000
1.000 | 1.000