ABCG3L3
[ENSRNOP00000057979]
Main page
| | | Plot |
Mito |
Lyso |
|
Perox |
ER |
Golgi |
PM |
Cytosol |
Nucleus |
|
| Expt A |
 9
9
peptides |
50
spectra |
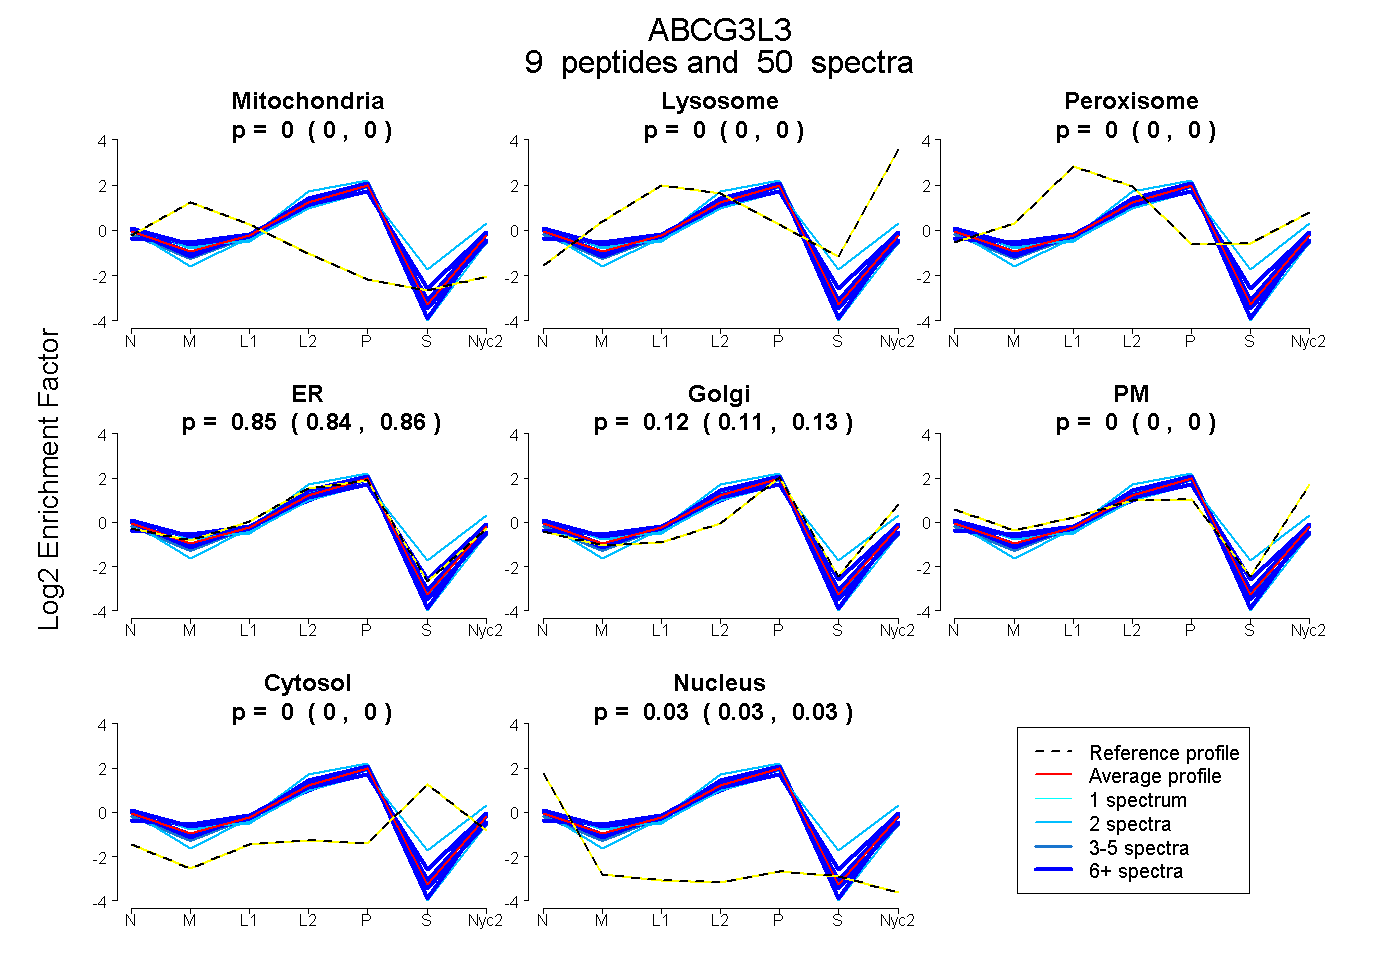 |
0.000
0.000 | 0.000 |
0.000
0.000 | 0.000 |
|
0.000
0.000 | 0.000 |
0.850
0.841 | 0.857 |
0.122
0.112 | 0.131 |
0.000
0.000 | 0.000 |
0.000
0.000 | 0.000 |
0.028
0.026 | 0.030 |
|
| | | Plot |
Mito |
|
Lyso or Perox |
|
ER |
Golgi |
PM |
Cytosol |
Nucleus |
|
| Expt B |
6
peptides |
29
spectra |
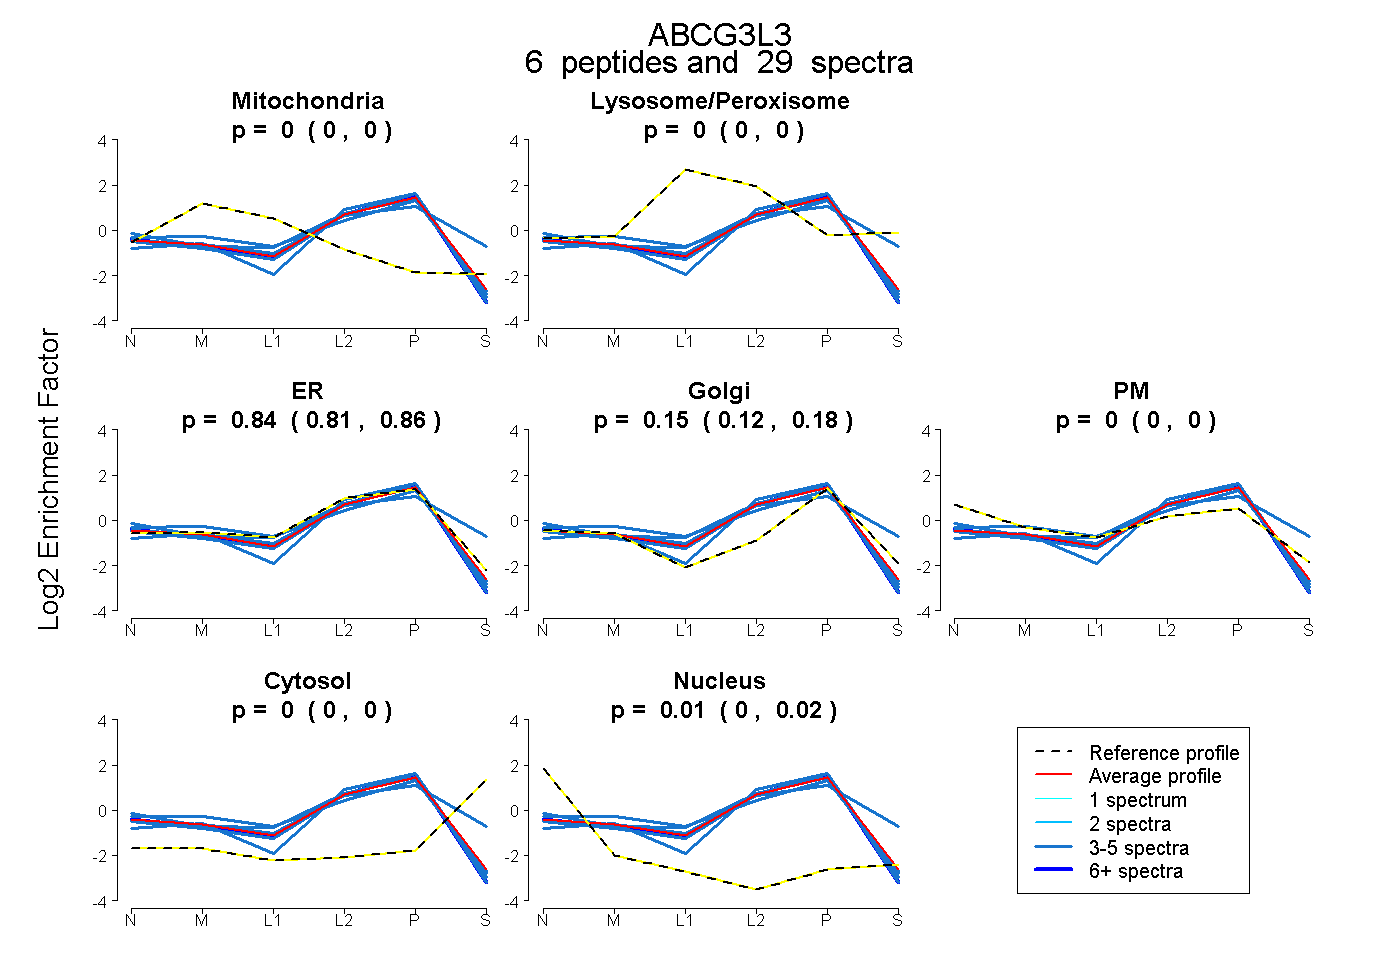 |
0.000
0.000 | 0.000 |
|
0.000
0.000 | 0.000 |
|
0.836
0.810 | 0.856 |
0.151
0.120 | 0.178 |
0.000
0.000 | 0.000 |
0.000
0.000 | 0.000 |
0.013
0.004 | 0.020 |
|
| 4 spectra, LPMTITR |
0.000 |
|
0.000 |
|
0.732 |
0.268 |
0.000 |
0.000 |
0.000 |
|
| 5 spectra, LLAELIPR |
0.000 |
|
0.000 |
|
0.938 |
0.000 |
0.019 |
0.000 |
0.044 |
|
| 5 spectra, SLLLDVLAAR |
0.000 |
|
0.000 |
|
0.816 |
0.184 |
0.000 |
0.000 |
0.000 |
|
| 6 spectra, DNLEFSAALR |
0.000 |
|
0.000 |
|
0.875 |
0.106 |
0.000 |
0.000 |
0.019 |
|
| 4 spectra, FFDSLTLMASGK |
0.000 |
|
0.131 |
|
0.559 |
0.151 |
0.000 |
0.160 |
0.000 |
|
| 5 spectra, ETVQSGFPLR |
0.050 |
|
0.000 |
|
0.738 |
0.104 |
0.107 |
0.000 |
0.000 |
|
| | | Plot |
|
Lyso |
|
|
|
|
|
|
|
Other |
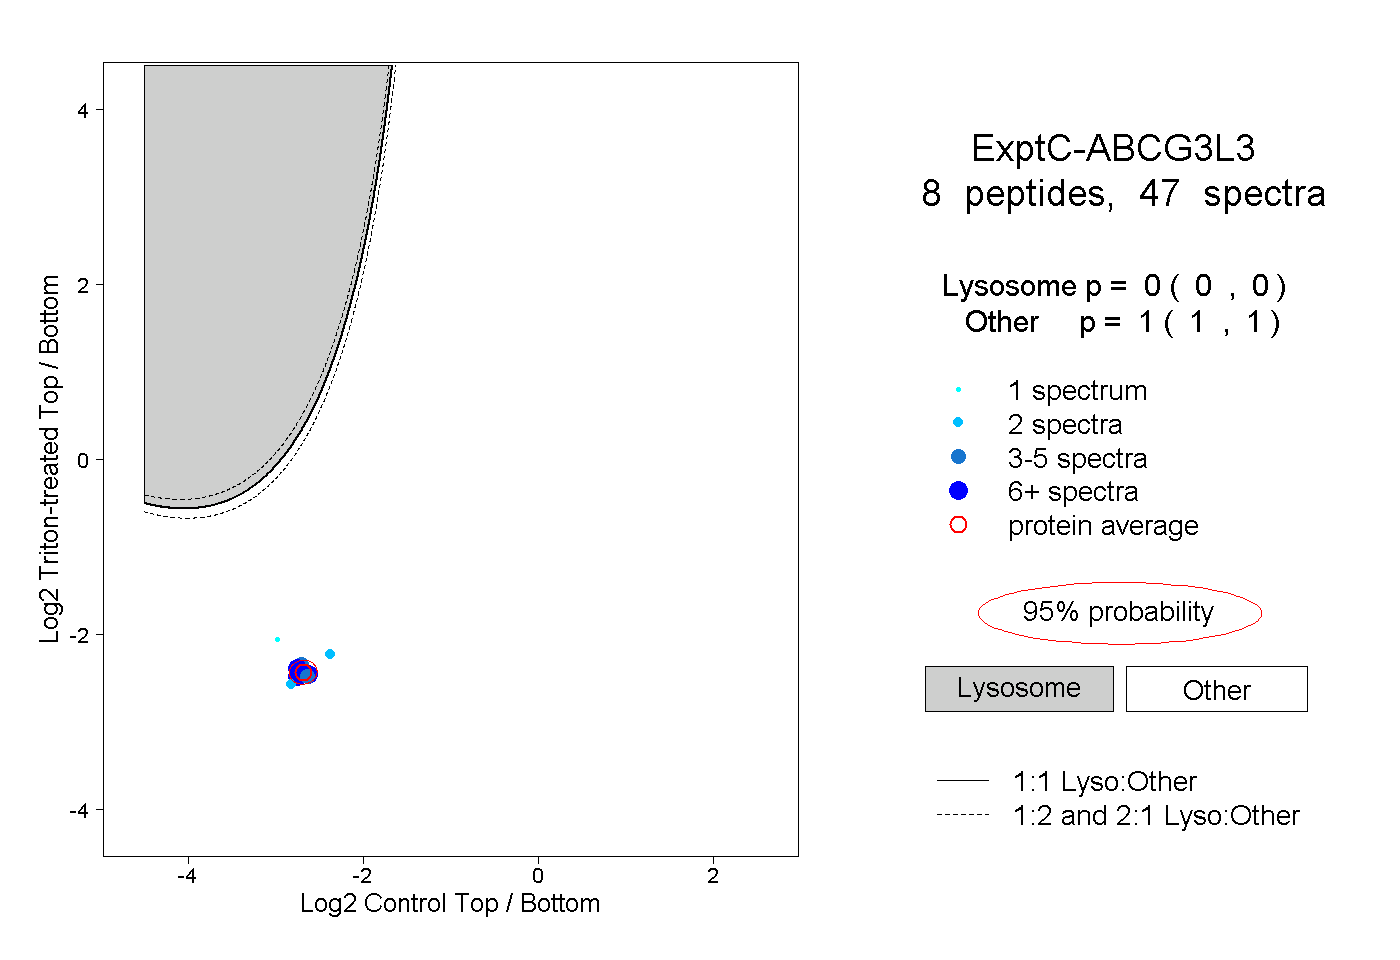
| Expt C |
8
peptides |
47
spectra |
 |
|
0.000
0.000 | 0.000 |
|
|
|
|
|
|
|
1.000
1.000 | 1.000 |
| | | Plot |
|
Lyso |
|
|
|
|
|
|
|
Other |
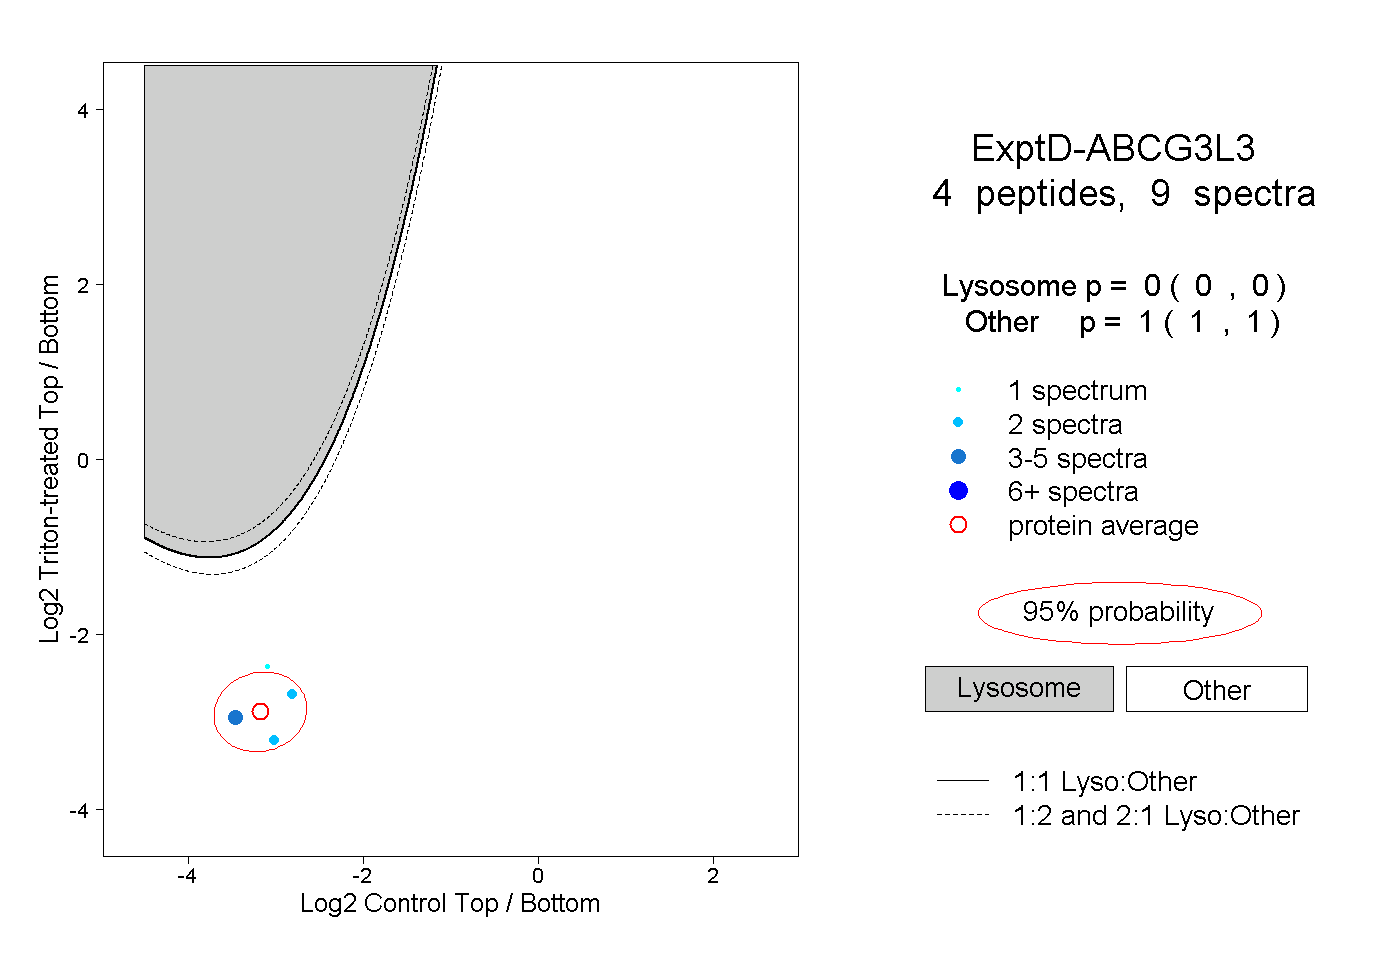
| Expt D |
4
peptides |
9
spectra |
 |
|
0.000
0.000 | 0.000 |
|
|
|
|
|
|
|
1.000
1.000 | 1.000 |