 9
9peptides
spectra
0.000 | 0.000
0.000 | 0.000
0.000 | 0.000
0.841 | 0.857
0.112 | 0.131
0.000 | 0.000
0.000 | 0.000
0.026 | 0.030
| Plot | Mito | Lyso | Perox | ER | Golgi | PM | Cytosol | Nucleus | |||||
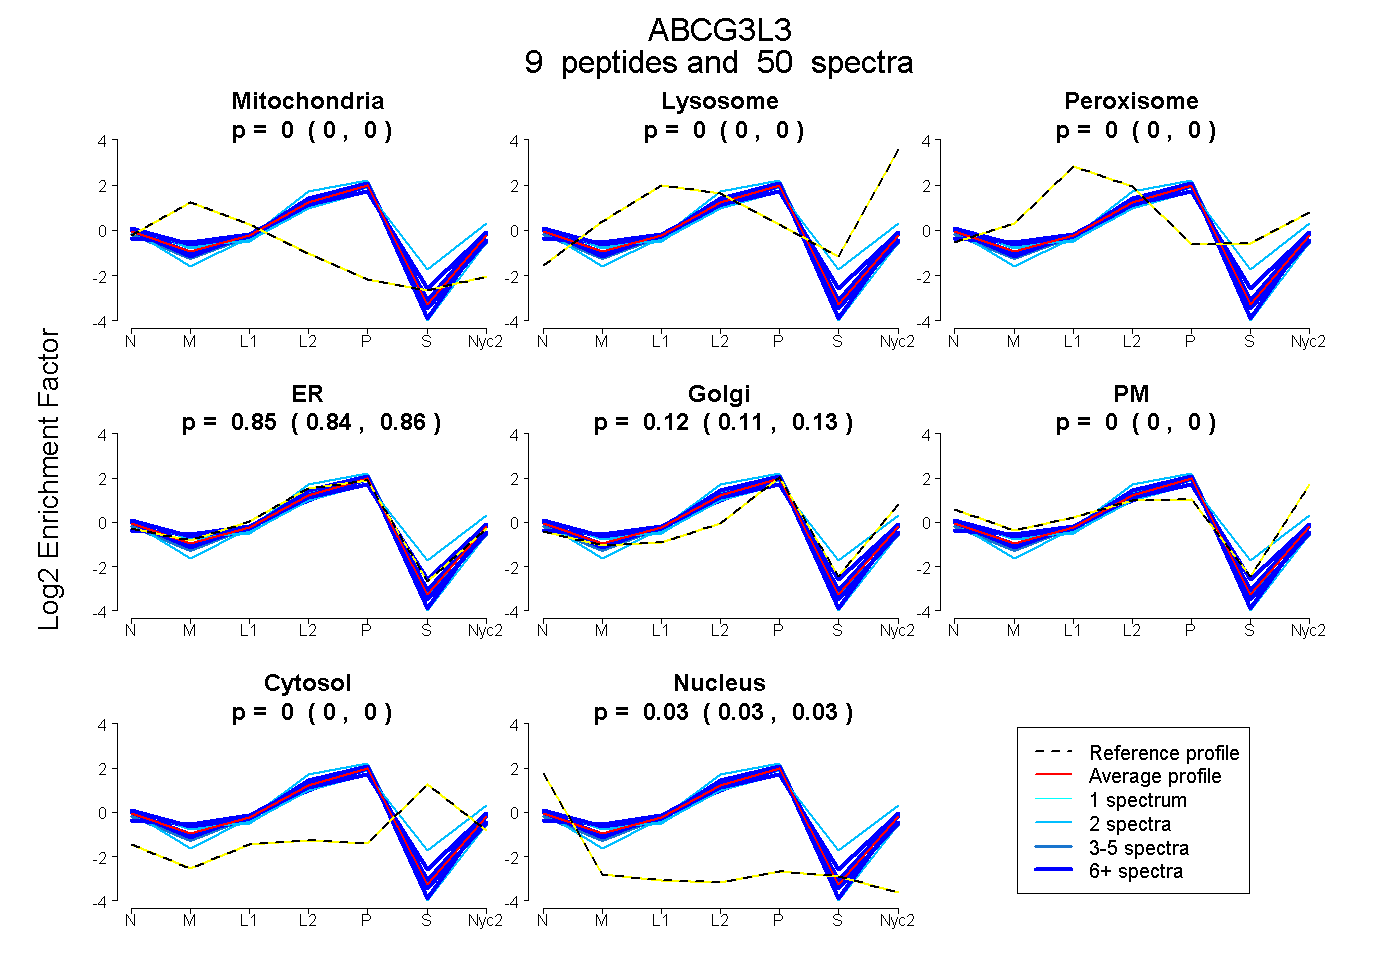
| Expt A |
9 peptides |
50 spectra |
|
0.000 0.000 | 0.000 |
0.000 0.000 | 0.000 |
0.000 0.000 | 0.000 |
0.850 0.841 | 0.857 |
0.122 0.112 | 0.131 |
0.000 0.000 | 0.000 |
0.000 0.000 | 0.000 |
0.028 0.026 | 0.030 |
| 12 spectra, LPMTITR | 0.048 | 0.000 | 0.000 | 0.818 | 0.125 | 0.000 | 0.000 | 0.009 | ||
| 9 spectra, LLAELIPR | 0.000 | 0.000 | 0.000 | 0.924 | 0.059 | 0.000 | 0.000 | 0.017 | ||
| 10 spectra, SLLLDVLAAR | 0.000 | 0.000 | 0.000 | 0.829 | 0.152 | 0.000 | 0.000 | 0.020 | ||
| 2 spectra, DNLEFSAALR | 0.000 | 0.000 | 0.000 | 0.953 | 0.000 | 0.000 | 0.000 | 0.047 | ||
| 2 spectra, FFDSLTLMASGK | 0.000 | 0.000 | 0.000 | 0.957 | 0.036 | 0.000 | 0.000 | 0.007 | ||
| 4 spectra, ETVQSGFPLR | 0.000 | 0.000 | 0.000 | 0.897 | 0.058 | 0.000 | 0.000 | 0.045 | ||
| 2 spectra, EQNTKPR | 0.000 | 0.000 | 0.000 | 0.734 | 0.161 | 0.066 | 0.000 | 0.039 | ||
| 2 spectra, TTTDIIAVLR | 0.000 | 0.000 | 0.000 | 0.482 | 0.177 | 0.242 | 0.099 | 0.000 | ||
| 7 spectra, VSSYFFGK | 0.005 | 0.000 | 0.000 | 0.709 | 0.097 | 0.150 | 0.000 | 0.040 |
| Plot | Mito | Lyso or Perox | ER | Golgi | PM | Cytosol | Nucleus | ||||||
| Expt B |
6 peptides |
29 spectra |
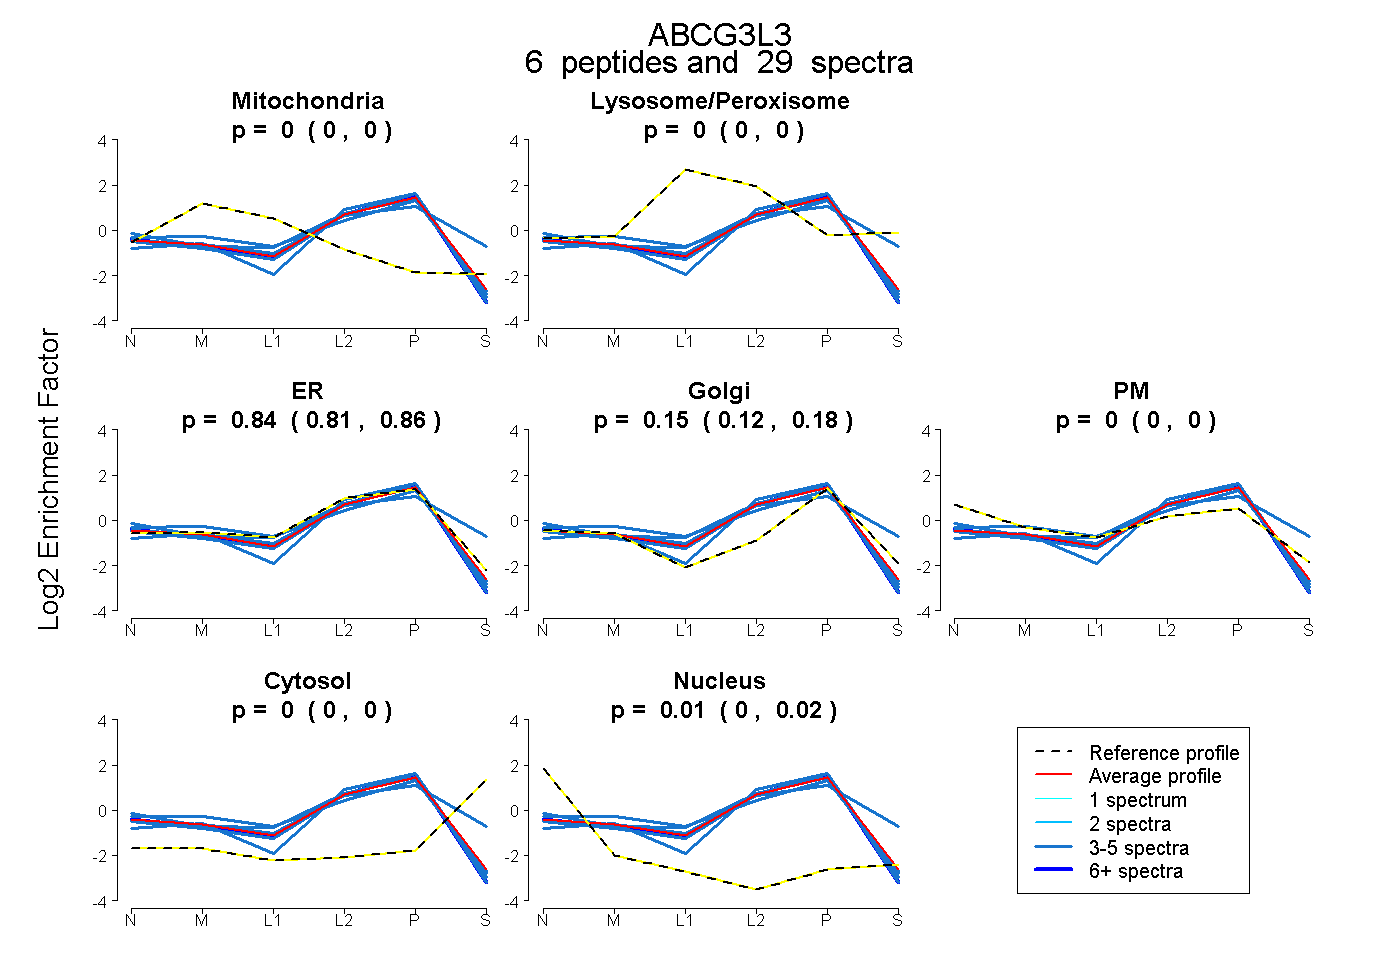 |
0.000 0.000 | 0.000 |
0.000 0.000 | 0.000 |
0.836 0.810 | 0.856 |
0.151 0.120 | 0.178 |
0.000 0.000 | 0.000 |
0.000 0.000 | 0.000 |
0.013 0.004 | 0.020 |
|||
| Plot | Lyso | Other | |||||||||||
| Expt C |
8 peptides |
47 spectra |
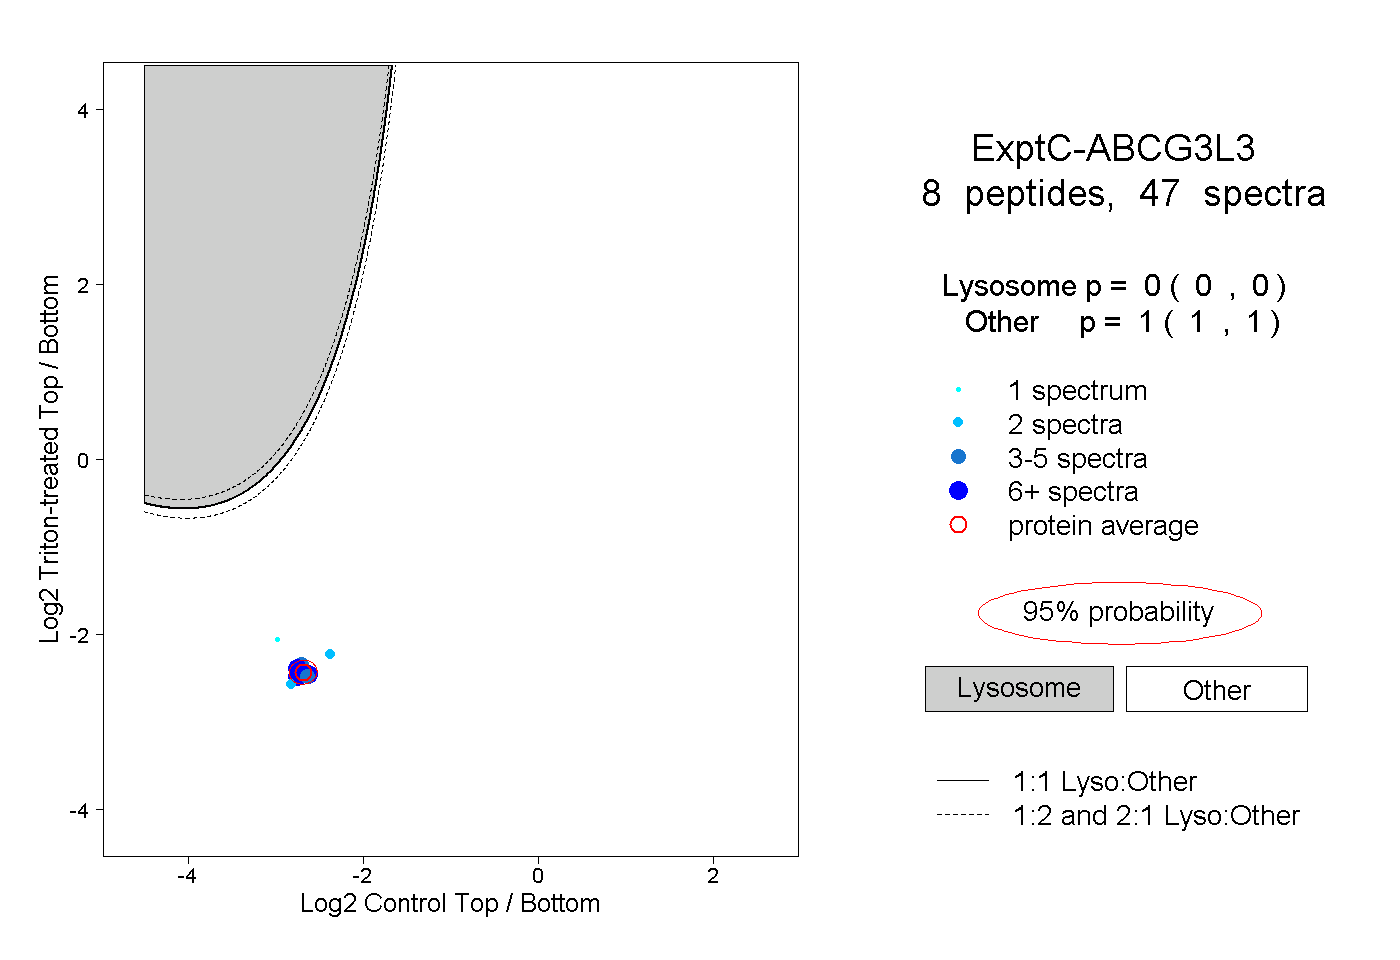 |
0.000 0.000 | 0.000 |
1.000 1.000 | 1.000 |
||||||||
| Plot | Lyso | Other | |||||||||||
| Expt D |
4 peptides |
9 spectra |
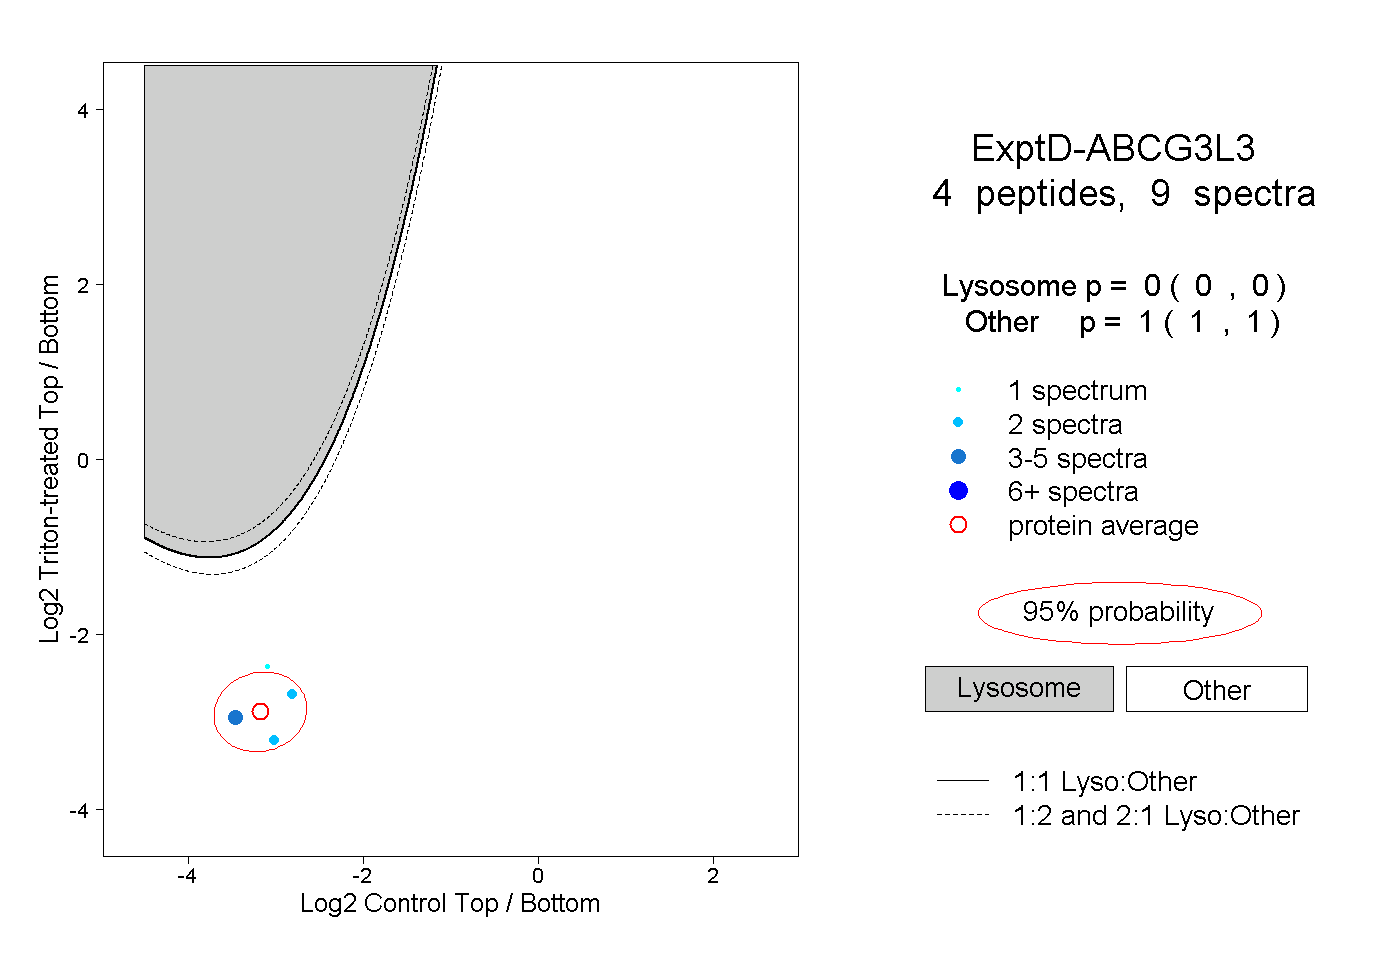 |
0.000 0.000 | 0.000 |
1.000 1.000 | 1.000 |