 9
9peptides
spectra
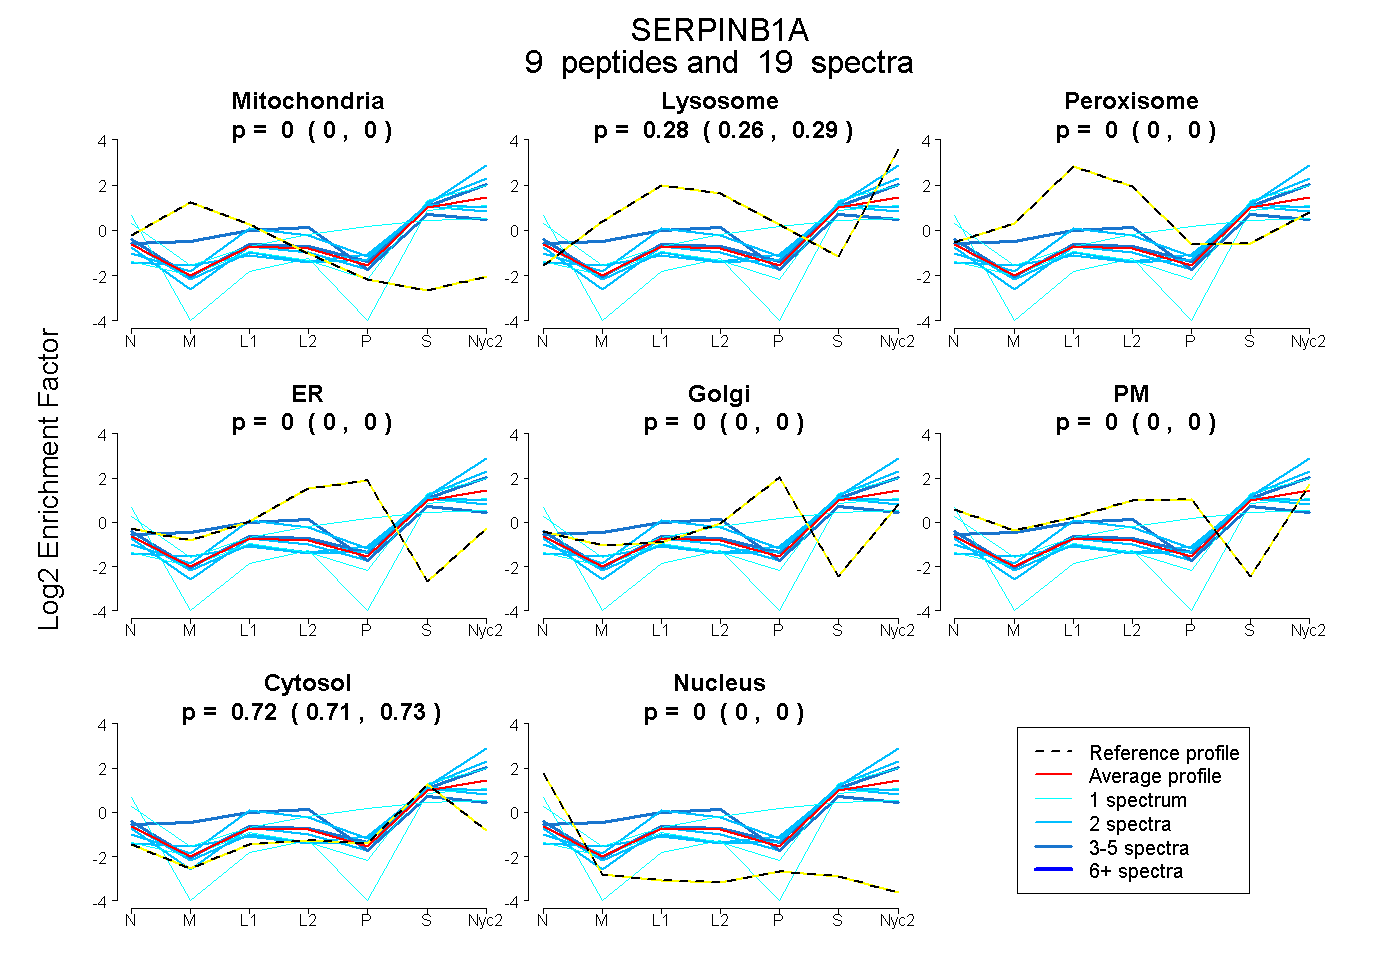
0.000 | 0.000
0.263 | 0.290
0.000 | 0.000
0.000 | 0.000
0.000 | 0.000
0.000 | 0.000
0.707 | 0.734
0.000 | 0.004
1peptide
spectrum
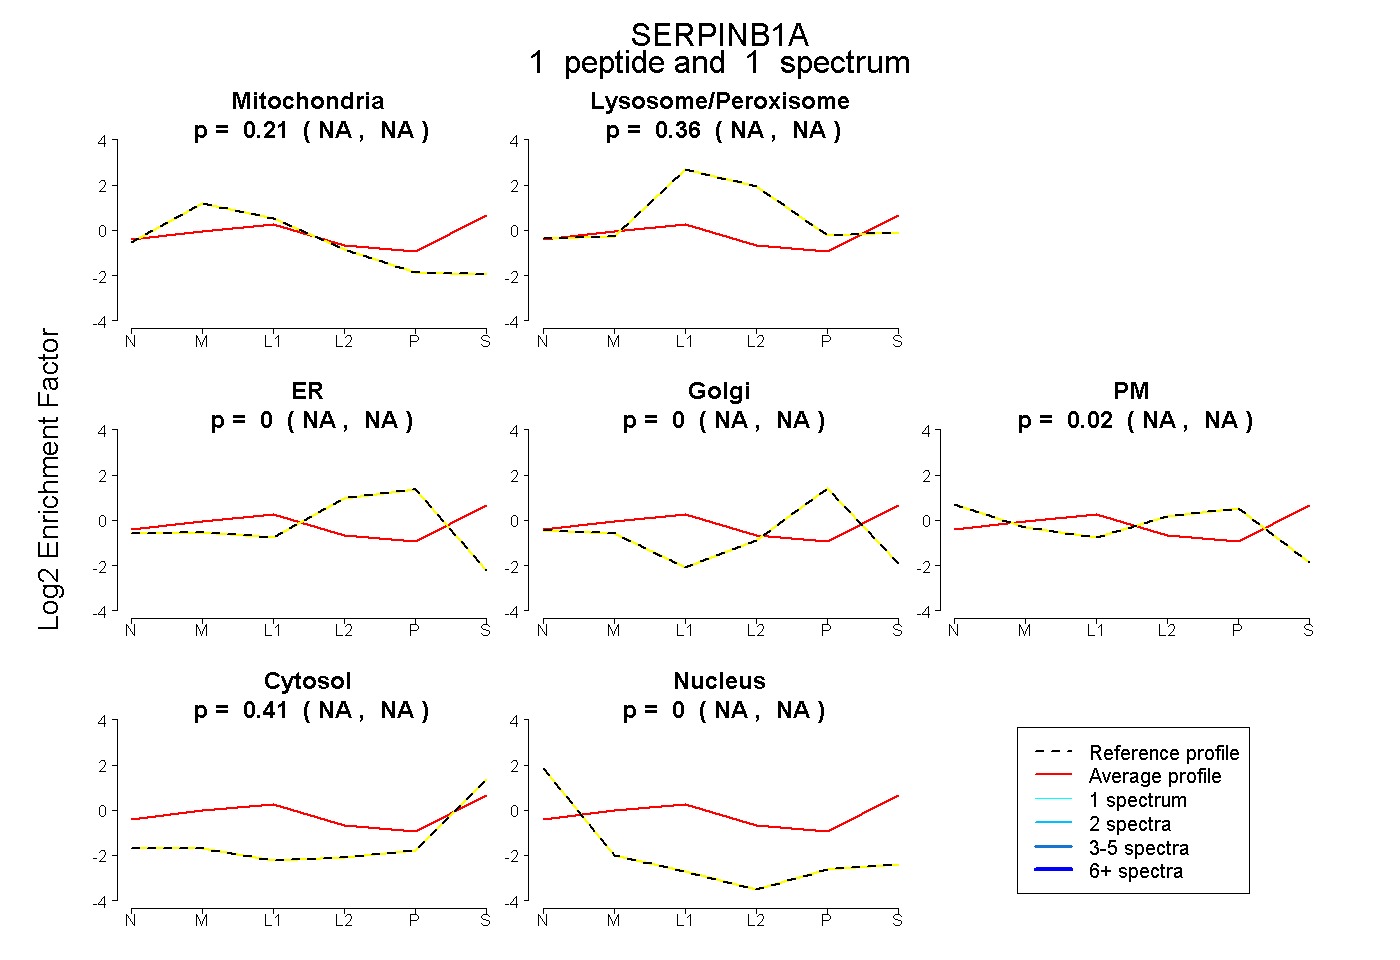
NA | NA
NA | NA
NA | NA
NA | NA
NA | NA
NA | NA
NA | NA
8peptides
spectra
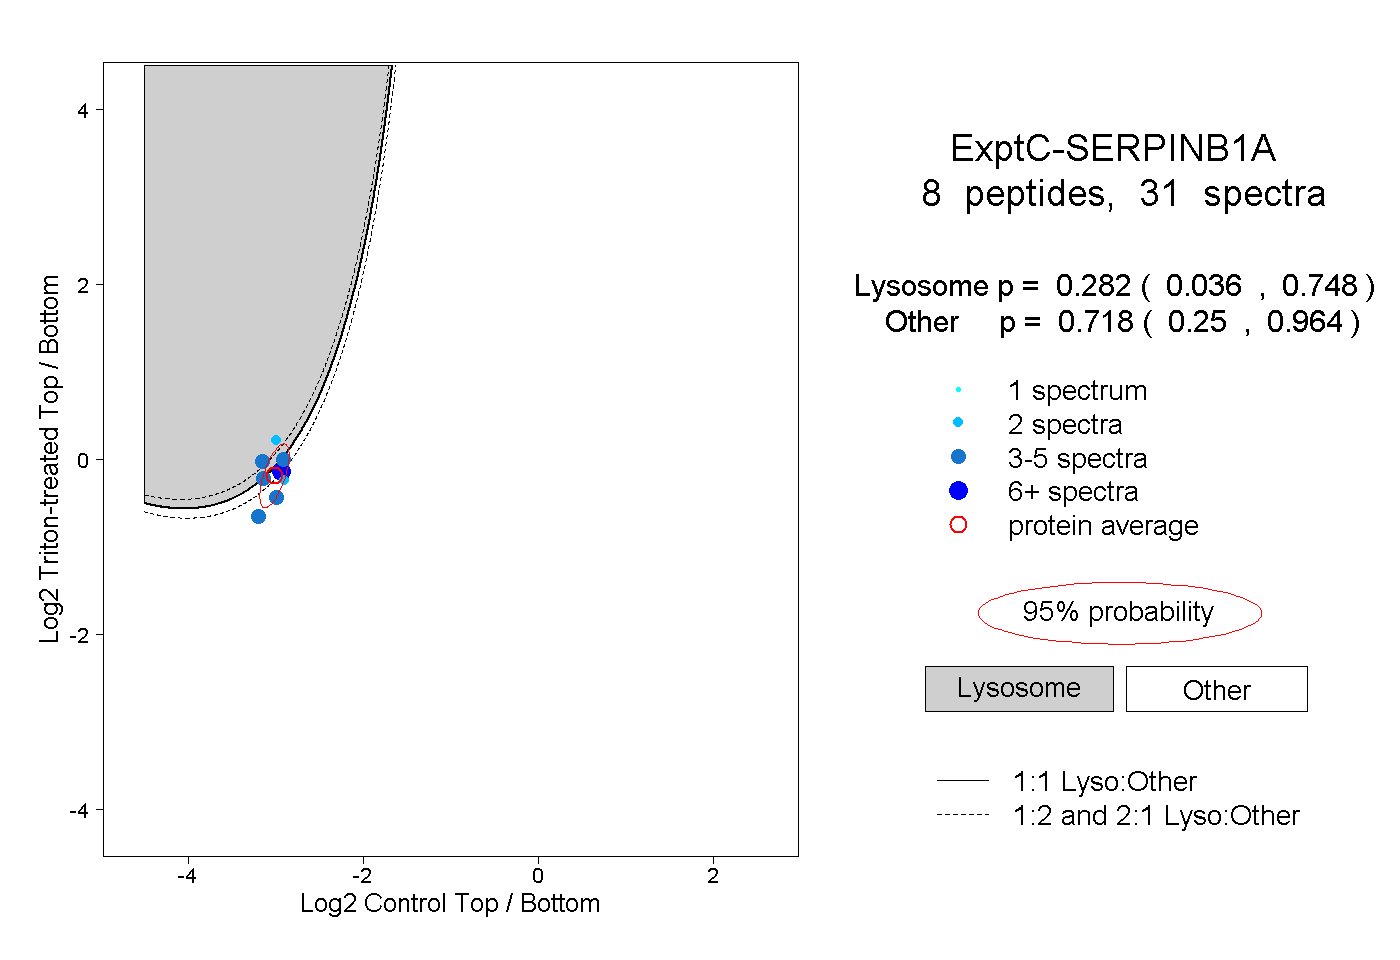
0.036 | 0.748
0.250 | 0.964