 9
9peptides
spectra
0.000 | 0.000
0.263 | 0.290
0.000 | 0.000
0.000 | 0.000
0.000 | 0.000
0.000 | 0.000
0.707 | 0.734
0.000 | 0.004
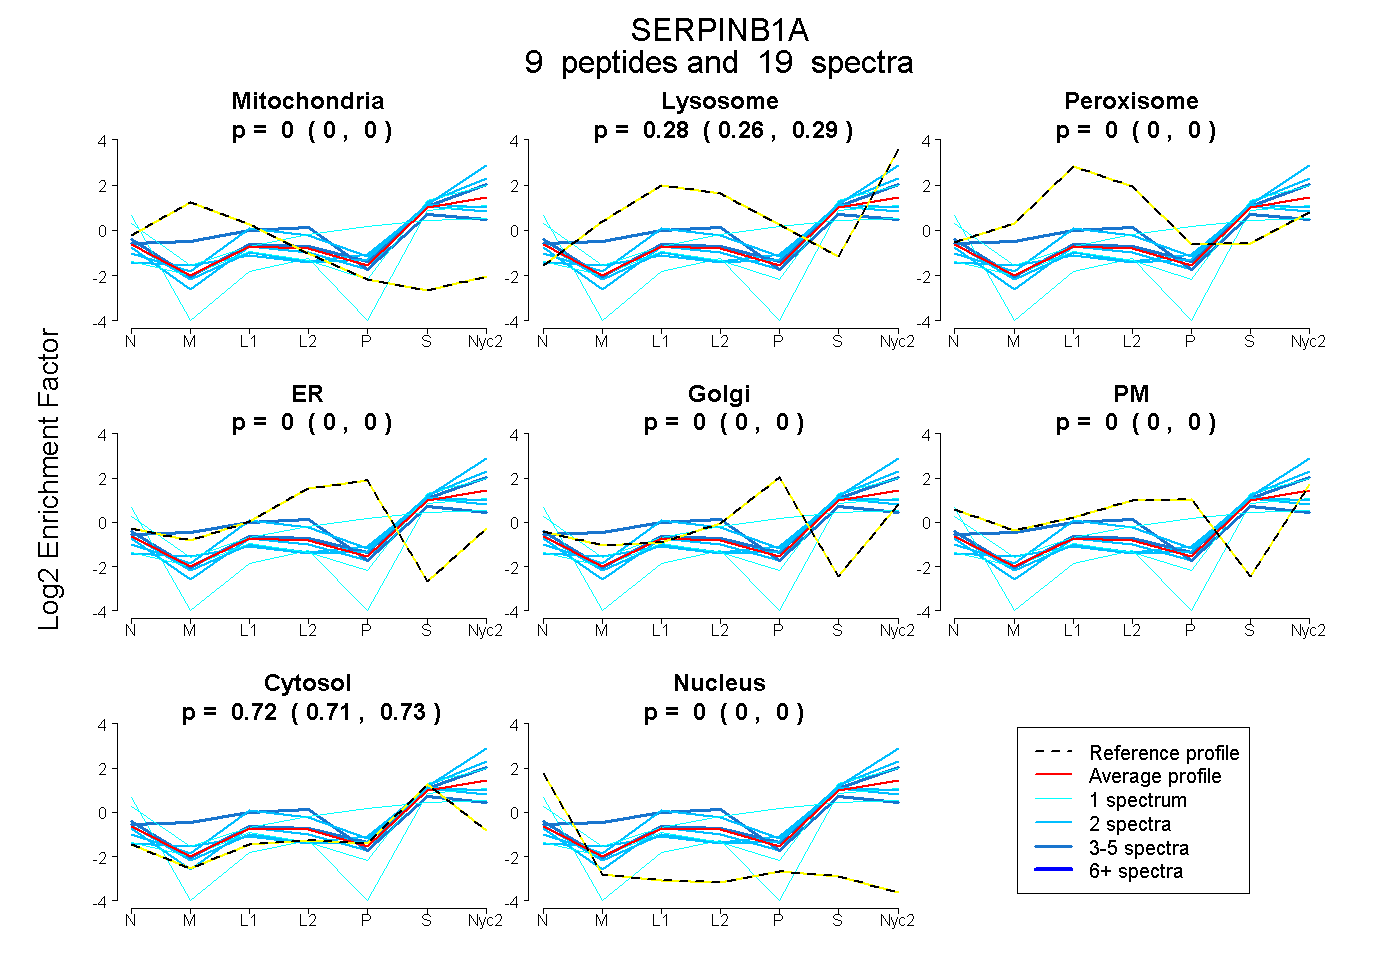
| Plot | Mito | Lyso | Perox | ER | Golgi | PM | Cytosol | Nucleus | |||||
| Expt A |
9 peptides |
19 spectra |
|
0.000 0.000 | 0.000 |
0.278 0.263 | 0.290 |
0.000 0.000 | 0.000 |
0.000 0.000 | 0.000 |
0.000 0.000 | 0.000 |
0.000 0.000 | 0.000 |
0.722 0.707 | 0.734 |
0.000 0.000 | 0.004 |
| 2 spectra, FFFGYISDLK | 0.000 | 0.134 | 0.000 | 0.000 | 0.000 | 0.070 | 0.796 | 0.000 | ||
| 1 spectrum, HGASHTLK | 0.000 | 0.040 | 0.000 | 0.000 | 0.000 | 0.000 | 0.777 | 0.183 | ||
| 1 spectrum, LGLQDLFNSSK | 0.000 | 0.247 | 0.000 | 0.000 | 0.000 | 0.000 | 0.753 | 0.000 | ||
| 5 spectra, HNPTANVLFLGR | 0.083 | 0.116 | 0.293 | 0.000 | 0.000 | 0.000 | 0.508 | 0.000 | ||
| 2 spectra, QDTTDAPFR | 0.000 | 0.479 | 0.000 | 0.000 | 0.000 | 0.000 | 0.521 | 0.000 | ||
| 1 spectrum, TFHFDSVEDVHSR | 0.000 | 0.000 | 0.000 | 0.000 | 0.000 | 0.459 | 0.541 | 0.000 | ||
| 2 spectra, IPELLAVGVVDSMTK | 0.000 | 0.214 | 0.000 | 0.000 | 0.000 | 0.000 | 0.786 | 0.000 | ||
| 2 spectra, ADLSGMSGSR | 0.000 | 0.289 | 0.000 | 0.000 | 0.000 | 0.000 | 0.711 | 0.000 | ||
| 3 spectra, ENLENIDVHVK | 0.000 | 0.330 | 0.000 | 0.000 | 0.000 | 0.000 | 0.670 | 0.000 |
| Plot | Mito | Lyso or Perox | ER | Golgi | PM | Cytosol | Nucleus | ||||||
| Expt B |
1 peptide |
1 spectrum |
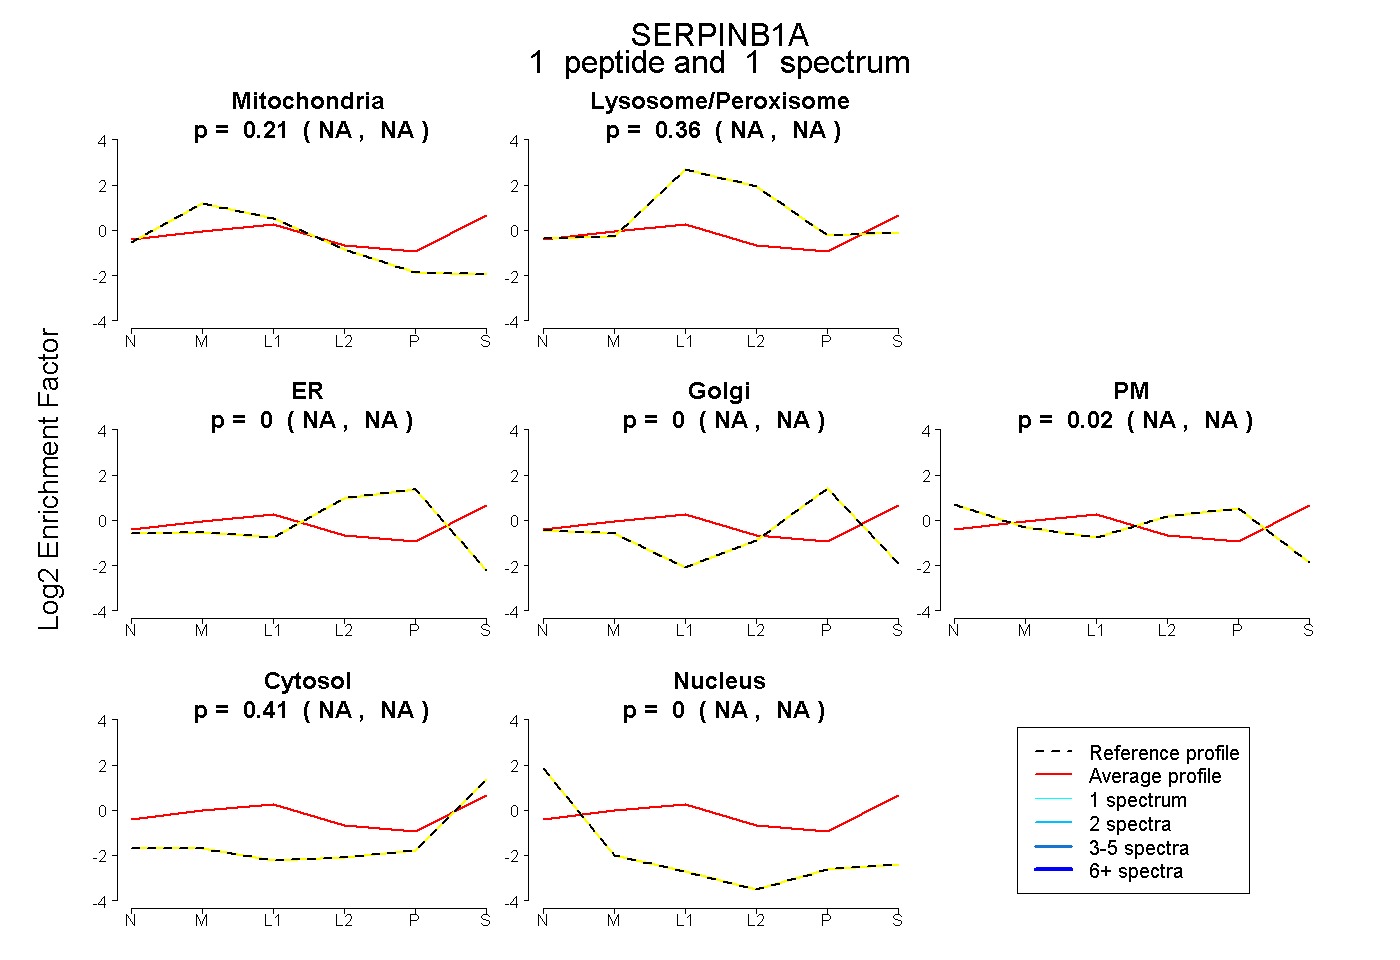 |
0.208 NA | NA |
0.360 NA | NA |
0.000 NA | NA |
0.000 NA | NA |
0.020 NA | NA |
0.411 NA | NA |
0.000 NA | NA |
|||
| Plot | Lyso | Other | |||||||||||
| Expt C |
8 peptides |
31 spectra |
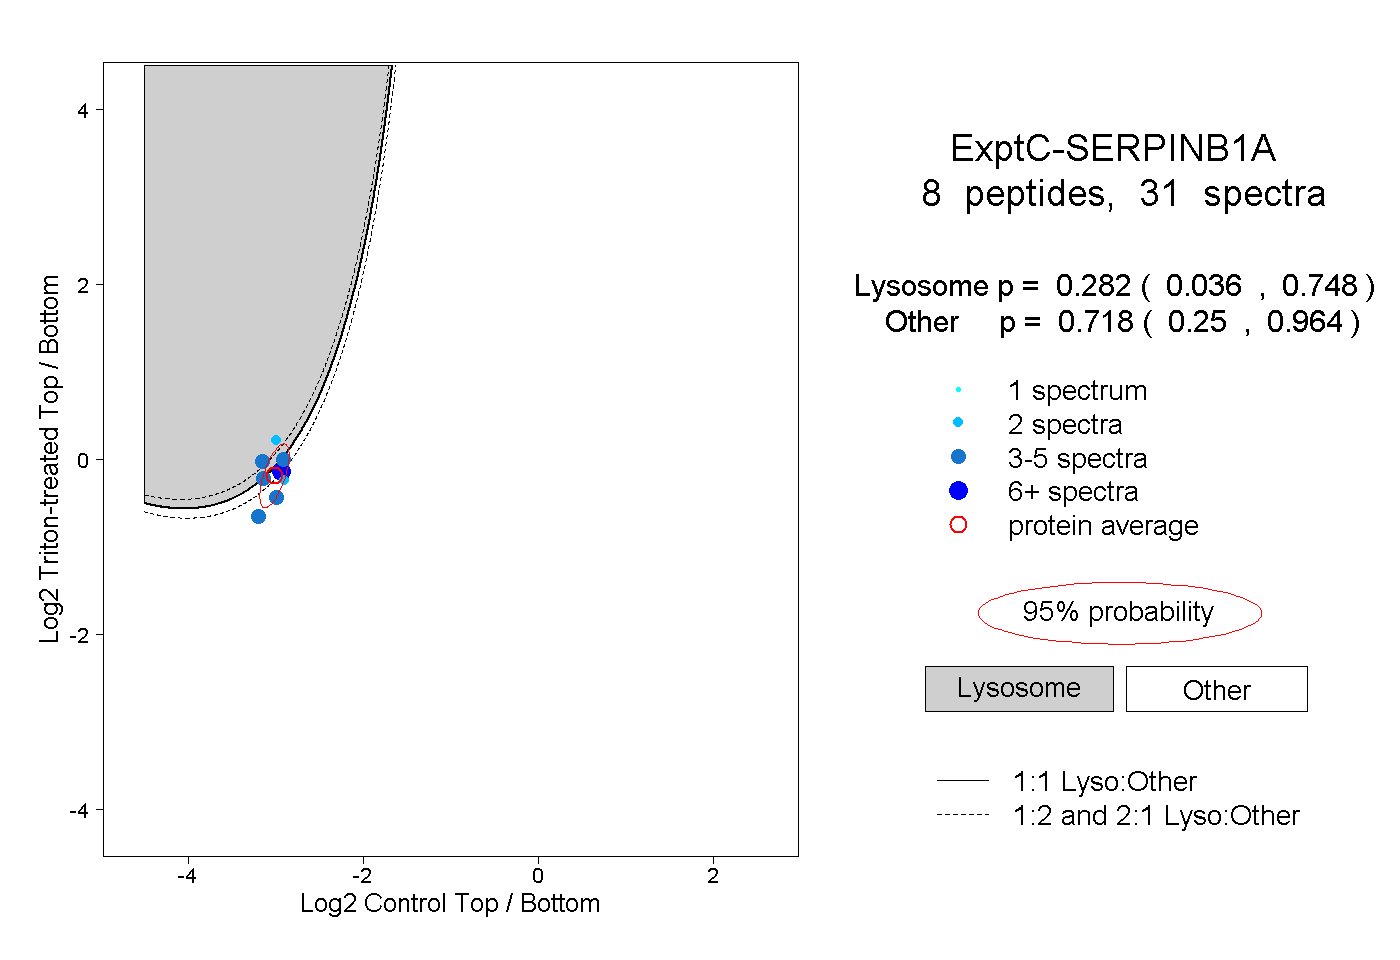 |
0.282 0.036 | 0.748 |
0.718 0.250 | 0.964 |