SERPINB1A
[ENSRNOP00000056600]
Main page
| | | Plot |
Mito |
Lyso |
|
Perox |
ER |
Golgi |
PM |
Cytosol |
Nucleus |
|
| Expt A |
 9
9
peptides |
19
spectra |
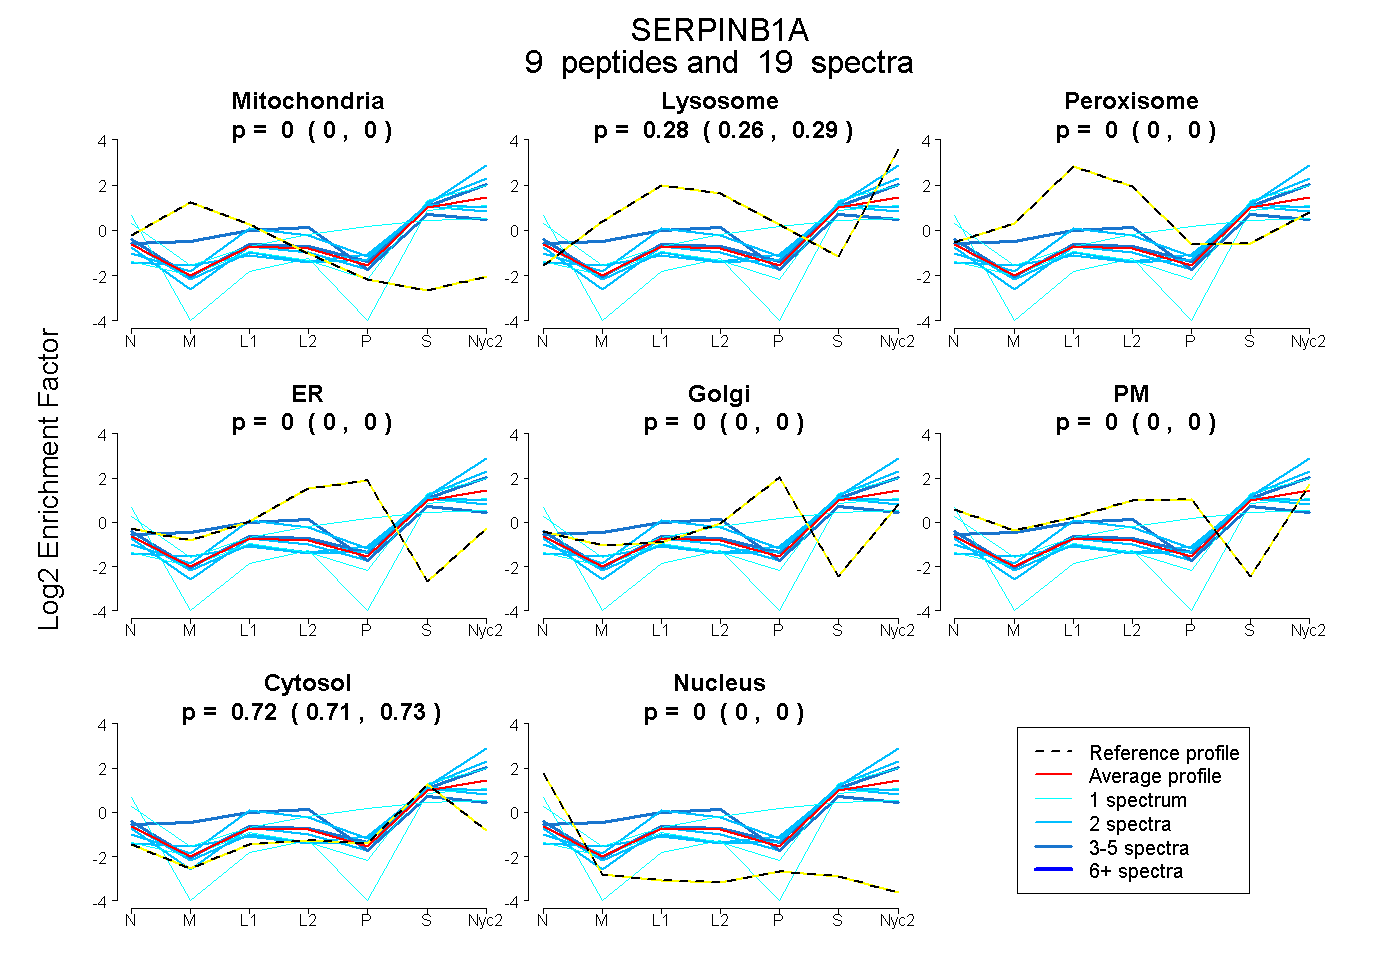 |
0.000
0.000 | 0.000 |
0.278
0.263 | 0.290 |
|
0.000
0.000 | 0.000 |
0.000
0.000 | 0.000 |
0.000
0.000 | 0.000 |
0.000
0.000 | 0.000 |
0.722
0.707 | 0.734 |
0.000
0.000 | 0.004 |
|
| | | Plot |
Mito |
|
Lyso or Perox |
|
ER |
Golgi |
PM |
Cytosol |
Nucleus |
|
| Expt B |
1
peptide |
1
spectrum |
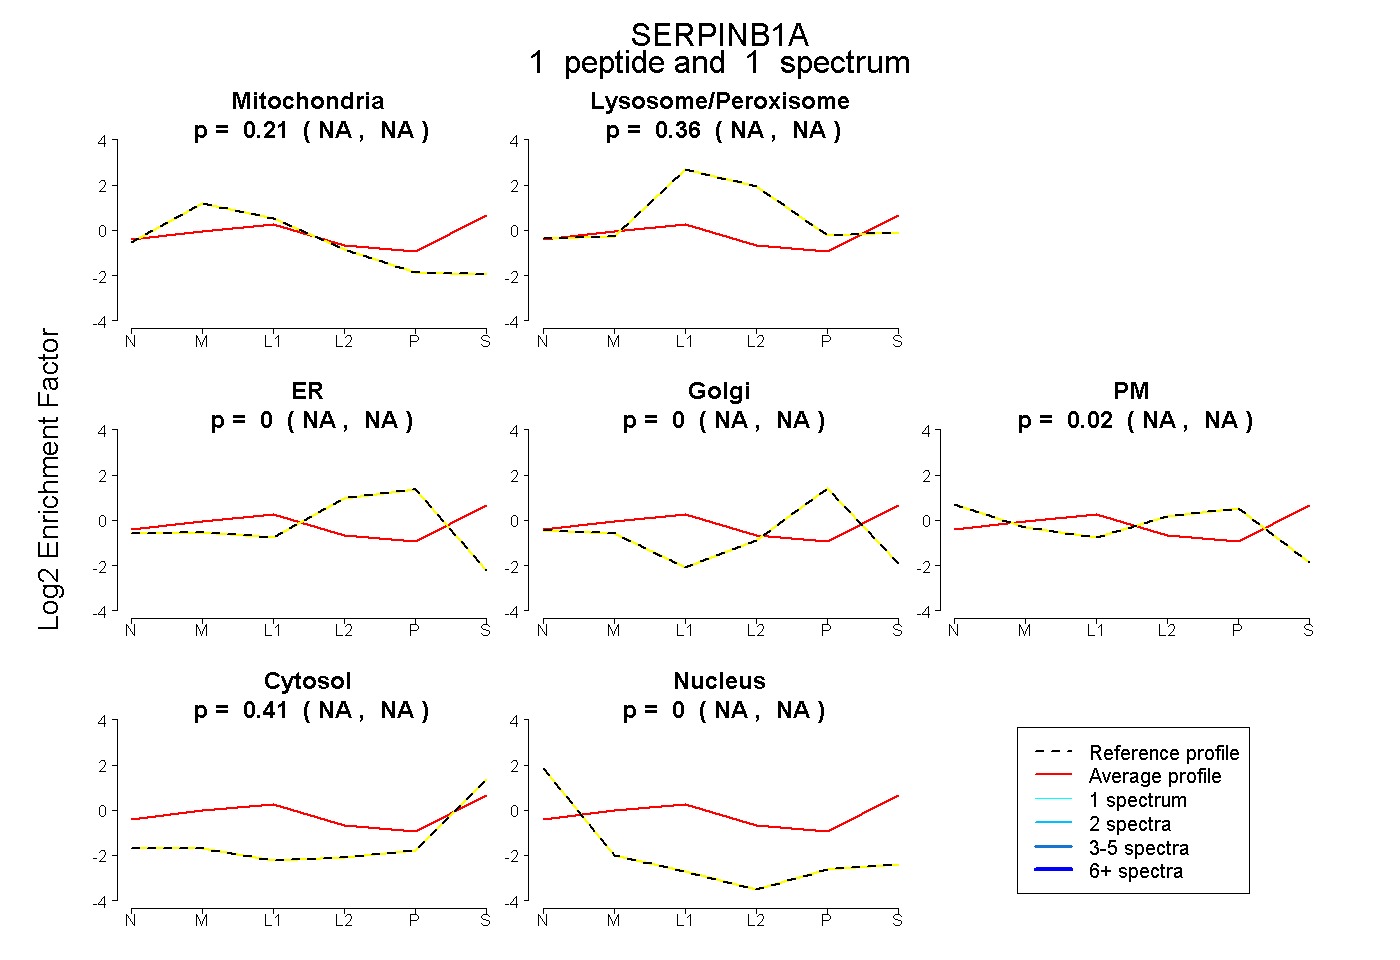 |
0.208
NA | NA |
|
0.360
NA | NA |
|
0.000
NA | NA |
0.000
NA | NA |
0.020
NA | NA |
0.411
NA | NA |
0.000
NA | NA |
|
| | | Plot |
|
Lyso |
|
|
|
|
|
|
|
Other |
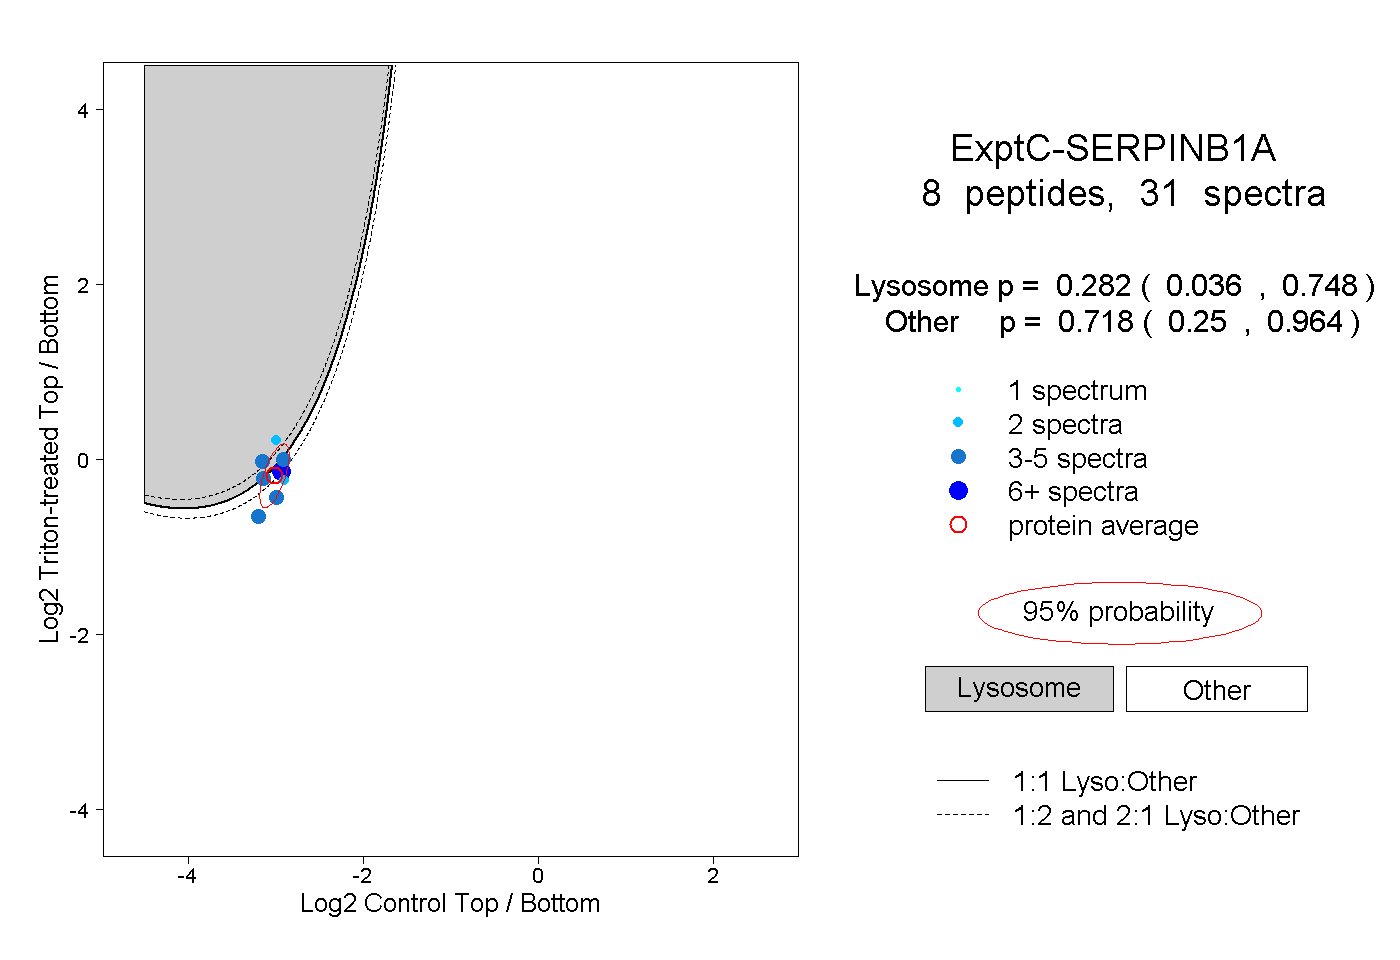
| Expt C |
8
peptides |
31
spectra |
 |
|
0.282
0.036 | 0.748 |
|
|
|
|
|
|
|
0.718
0.250 | 0.964 |
| 3 spectra, GQTEGK |
|
0.019 |
|
|
|
|
|
|
|
0.981 |
| 3 spectra, GTTAAQLSK |
|
0.031 |
|
|
|
|
|
|
|
0.969 |
| 2 spectra, IEEQLTLEK |
|
0.935 |
|
|
|
|
|
|
|
0.065 |
| 3 spectra, LGLQDLFNSSK |
|
0.427 |
|
|
|
|
|
|
|
0.573 |
| 3 spectra, QDTTDAPFR |
|
0.876 |
|
|
|
|
|
|
|
0.124 |
| 2 spectra, FQSLNAEVSK |
|
0.069 |
|
|
|
|
|
|
|
0.931 |
| 11 spectra, ADLSGMSGSR |
|
0.221 |
|
|
|
|
|
|
|
0.779 |
| 4 spectra, ENLENIDVHVK |
|
0.469 |
|
|
|
|
|
|
|
0.531 |