 27
27peptides
spectra
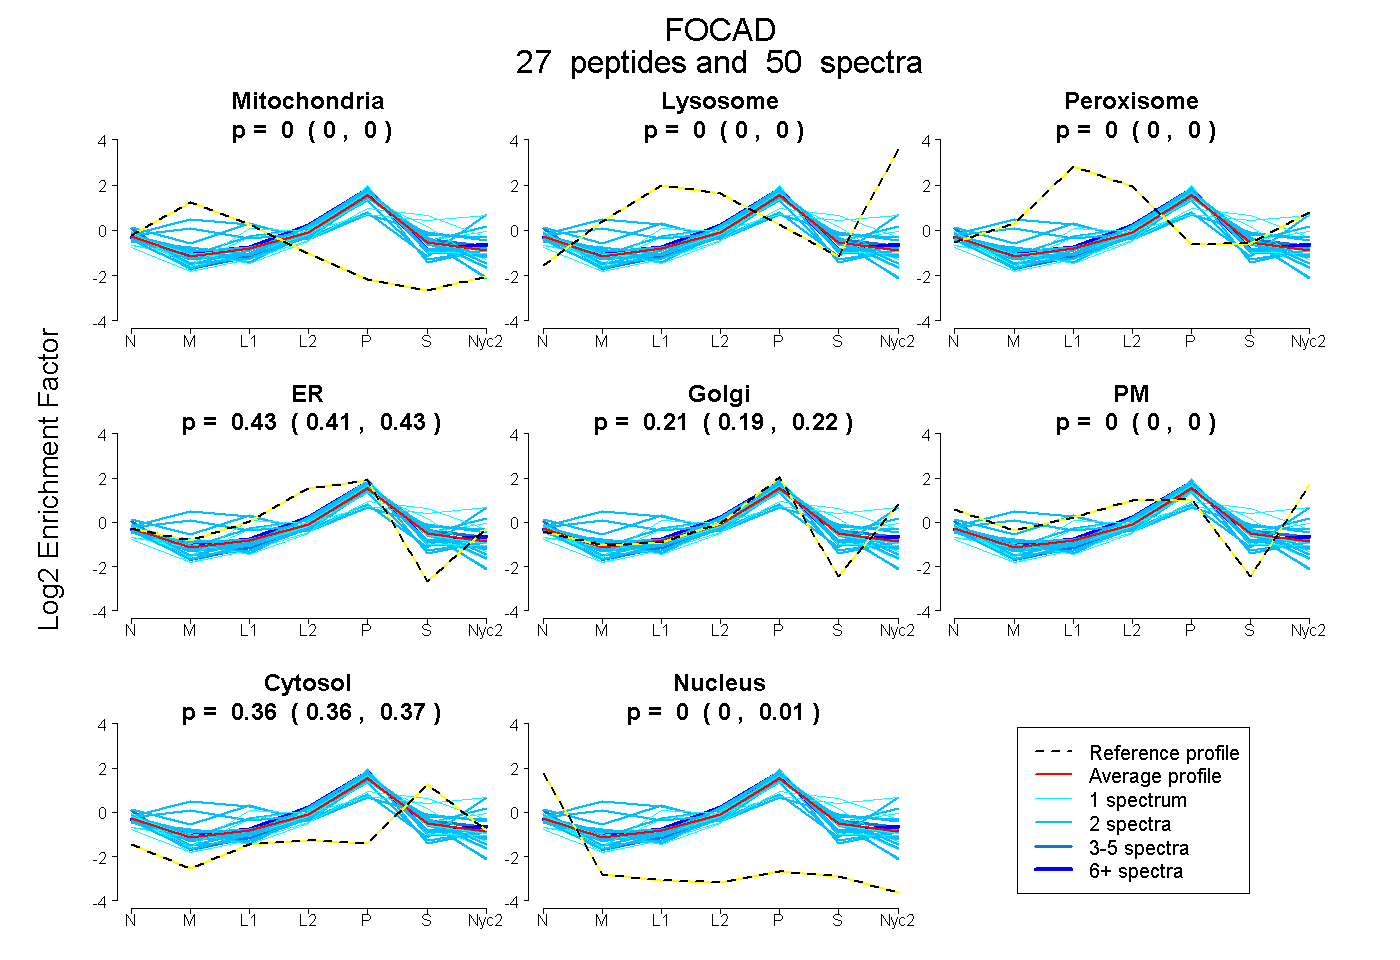
0.000 | 0.000
0.000 | 0.000
0.000 | 0.000
0.415 | 0.435
0.193 | 0.218
0.000 | 0.000
0.360 | 0.368
0.000 | 0.006
11peptides
spectra
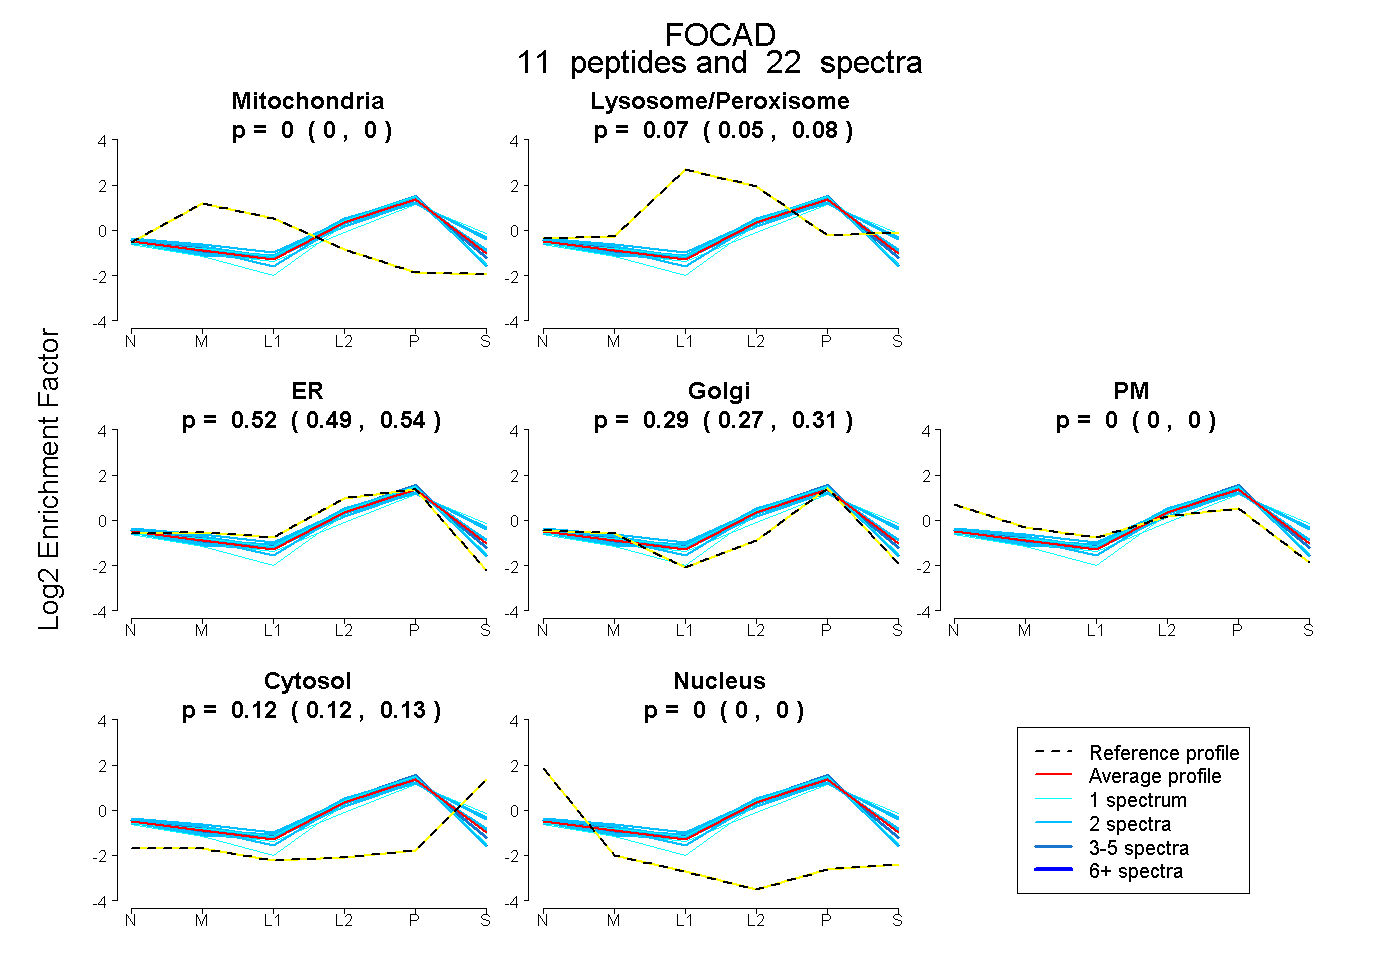
0.000 | 0.000
0.054 | 0.075
0.490 | 0.539
0.273 | 0.309
0.000 | 0.000
0.117 | 0.131
0.000 | 0.000
18peptides
spectra
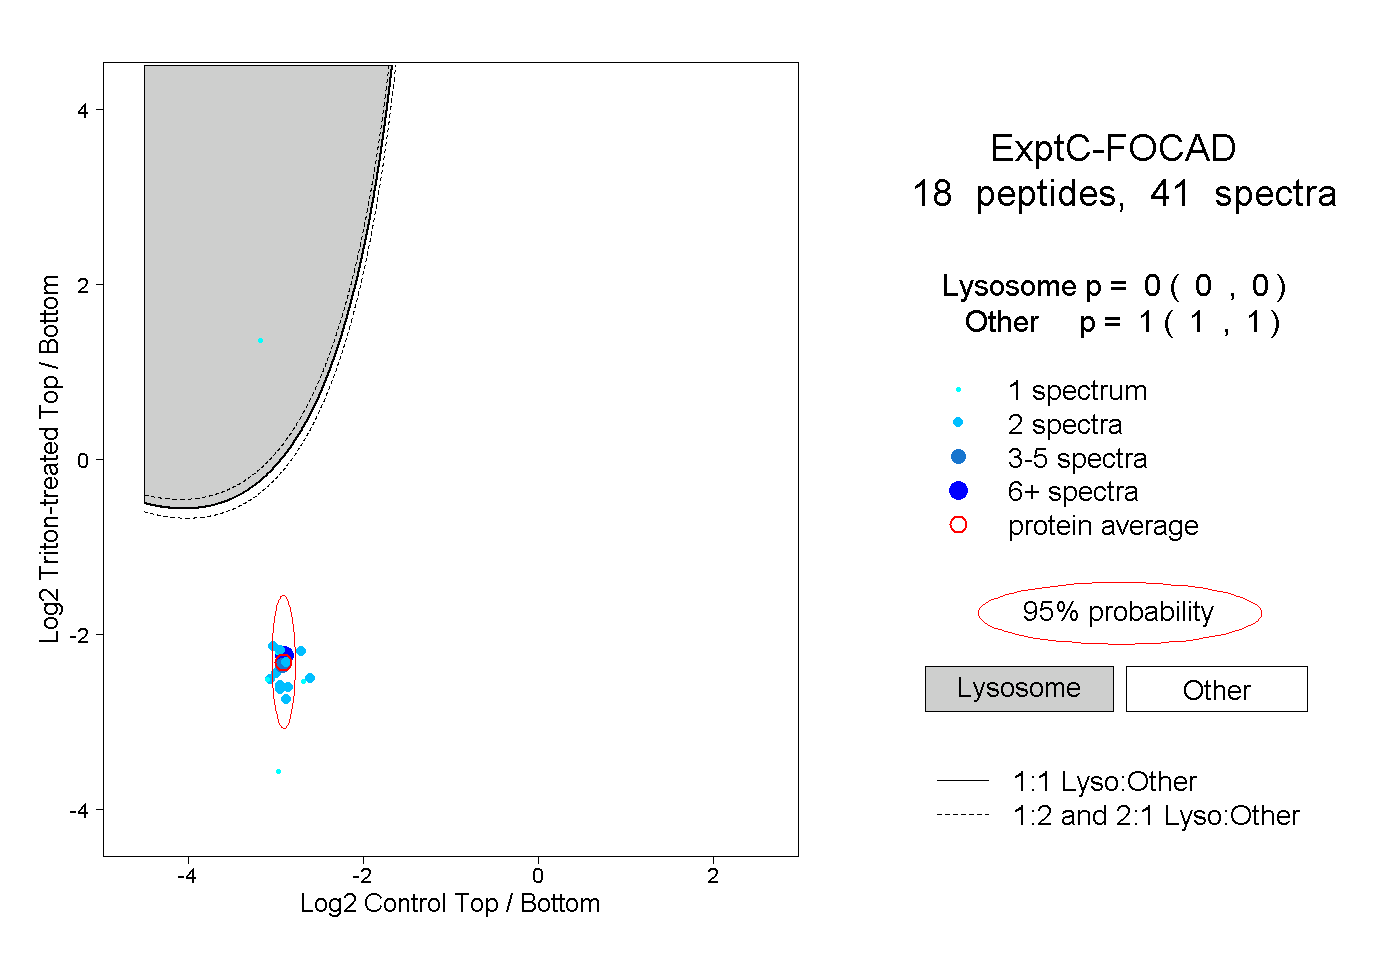
0.000 | 0.000
1.000 | 1.000
9peptides
spectra
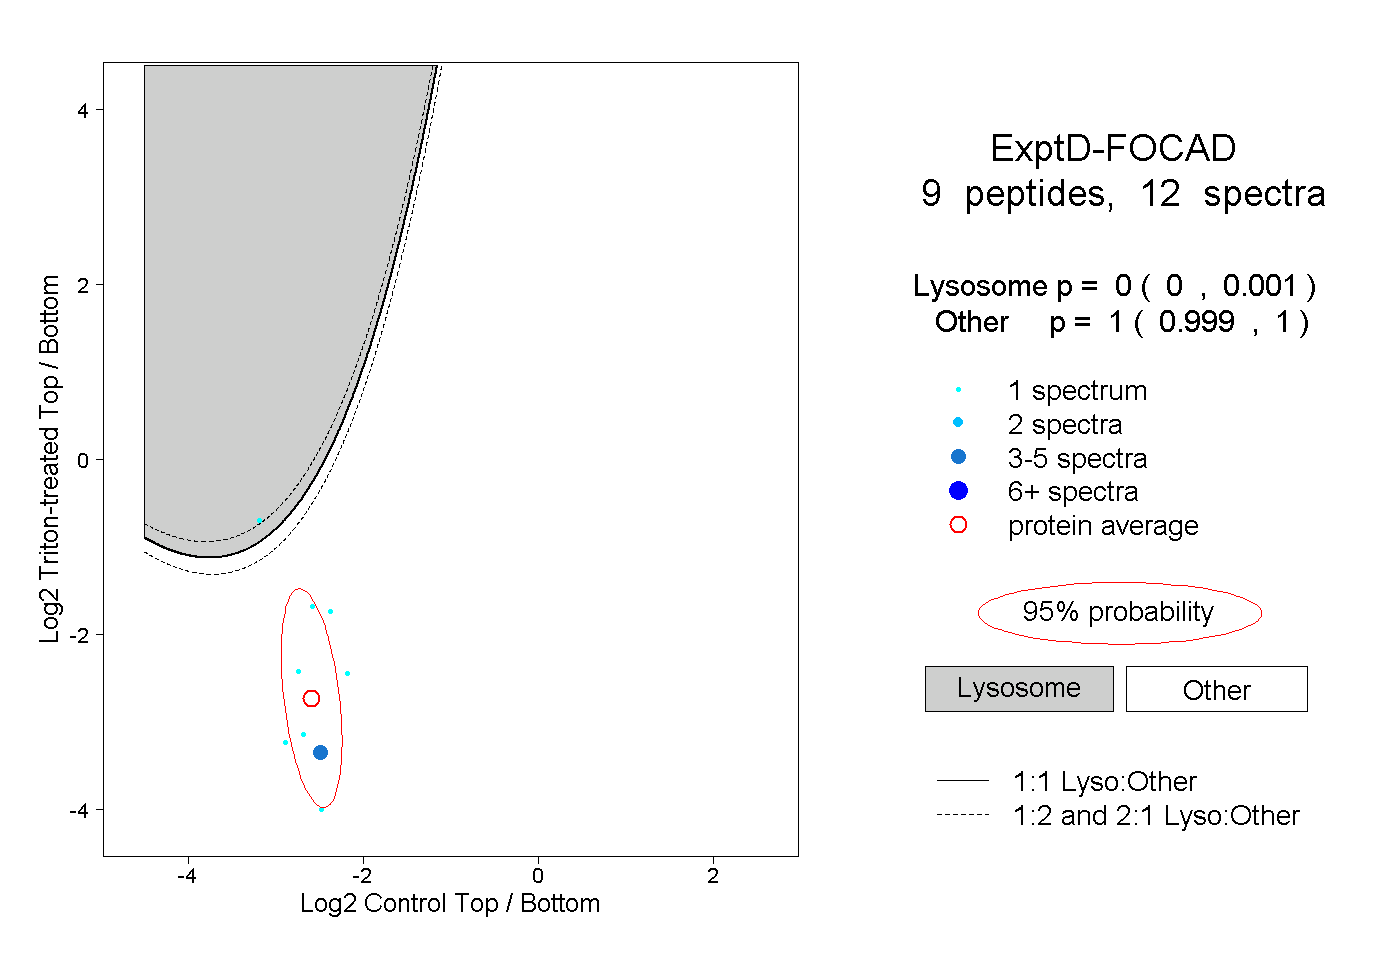
0.000 | 0.001
0.999 | 1.000