 27
27peptides
spectra
0.000 | 0.000
0.000 | 0.000
0.000 | 0.000
0.415 | 0.435
0.193 | 0.218
0.000 | 0.000
0.360 | 0.368
0.000 | 0.006
| Plot | Mito | Lyso | Perox | ER | Golgi | PM | Cytosol | Nucleus | |||||
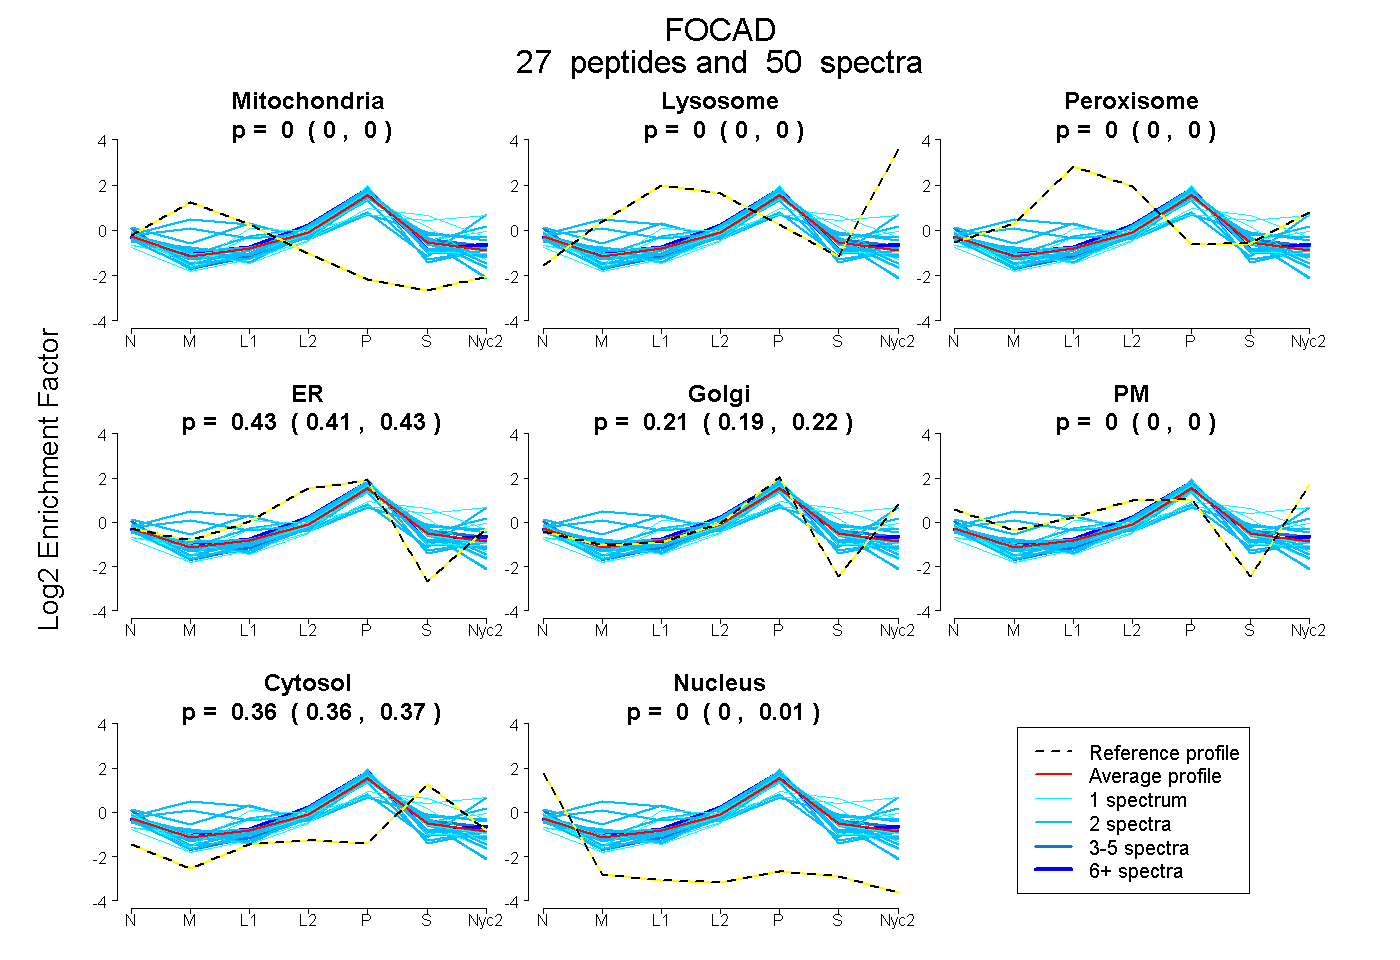
| Expt A |
27 peptides |
50 spectra |
|
0.000 0.000 | 0.000 |
0.000 0.000 | 0.000 |
0.000 0.000 | 0.000 |
0.425 0.415 | 0.435 |
0.207 0.193 | 0.218 |
0.000 0.000 | 0.000 |
0.364 0.360 | 0.368 |
0.003 0.000 | 0.006 |
| 2 spectra, LLTSLWEK | 0.000 | 0.000 | 0.000 | 0.521 | 0.173 | 0.000 | 0.256 | 0.050 | ||
| 1 spectrum, EHGASEK | 0.000 | 0.000 | 0.000 | 0.581 | 0.012 | 0.000 | 0.396 | 0.012 | ||
| 2 spectra, LSCDMRPLILK | 0.000 | 0.000 | 0.000 | 0.579 | 0.000 | 0.000 | 0.349 | 0.071 | ||
| 1 spectrum, AAIGFFITGGK | 0.000 | 0.000 | 0.000 | 0.465 | 0.117 | 0.000 | 0.359 | 0.058 | ||
| 1 spectrum, YLLVSMPLWAK | 0.000 | 0.043 | 0.138 | 0.000 | 0.139 | 0.248 | 0.433 | 0.000 | ||
| 2 spectra, SYSGENTASAIAR | 0.000 | 0.000 | 0.000 | 0.337 | 0.278 | 0.000 | 0.324 | 0.060 | ||
| 1 spectrum, TTGECSSLIQLLER | 0.000 | 0.000 | 0.000 | 0.488 | 0.000 | 0.000 | 0.512 | 0.000 | ||
| 2 spectra, DLQDLYSIR | 0.000 | 0.000 | 0.000 | 0.369 | 0.282 | 0.000 | 0.349 | 0.000 | ||
| 2 spectra, VHVAASLR | 0.000 | 0.000 | 0.000 | 0.441 | 0.272 | 0.000 | 0.287 | 0.000 | ||
| 2 spectra, VLPEFK | 0.000 | 0.000 | 0.000 | 0.347 | 0.271 | 0.000 | 0.383 | 0.000 | ||
| 1 spectrum, ELQWEK | 0.000 | 0.000 | 0.056 | 0.269 | 0.383 | 0.000 | 0.292 | 0.000 | ||
| 2 spectra, LLSLTEGQR | 0.219 | 0.000 | 0.000 | 0.357 | 0.285 | 0.000 | 0.139 | 0.000 | ||
| 2 spectra, LSDMSGQQMSLLLMK | 0.000 | 0.000 | 0.000 | 0.551 | 0.004 | 0.000 | 0.376 | 0.069 | ||
| 6 spectra, LLQMQASR | 0.000 | 0.000 | 0.000 | 0.476 | 0.251 | 0.000 | 0.274 | 0.000 | ||
| 2 spectra, IFDLLPNR | 0.000 | 0.000 | 0.000 | 0.303 | 0.459 | 0.000 | 0.154 | 0.084 | ||
| 1 spectrum, VYPELQR | 0.000 | 0.000 | 0.000 | 0.462 | 0.192 | 0.000 | 0.336 | 0.009 | ||
| 2 spectra, AYHAILQGR | 0.211 | 0.177 | 0.111 | 0.000 | 0.436 | 0.010 | 0.055 | 0.000 | ||
| 1 spectrum, QEMVNMPR | 0.000 | 0.000 | 0.000 | 0.075 | 0.344 | 0.000 | 0.581 | 0.000 | ||
| 3 spectra, ATLLSLR | 0.000 | 0.000 | 0.000 | 0.240 | 0.362 | 0.000 | 0.368 | 0.031 | ||
| 2 spectra, VLLQPR | 0.000 | 0.000 | 0.000 | 0.529 | 0.034 | 0.000 | 0.417 | 0.020 | ||
| 2 spectra, VIQLLGTTPR | 0.000 | 0.000 | 0.000 | 0.446 | 0.269 | 0.000 | 0.265 | 0.020 | ||
| 1 spectrum, TSVPTDYSYLPEGSFIR | 0.000 | 0.000 | 0.000 | 0.186 | 0.509 | 0.000 | 0.257 | 0.047 | ||
| 2 spectra, DMLTDEITK | 0.036 | 0.000 | 0.309 | 0.000 | 0.337 | 0.000 | 0.277 | 0.041 | ||
| 1 spectrum, LRPSWIK | 0.000 | 0.000 | 0.000 | 0.559 | 0.009 | 0.000 | 0.362 | 0.070 | ||
| 2 spectra, SCSDNVVVR | 0.000 | 0.000 | 0.000 | 0.543 | 0.000 | 0.000 | 0.362 | 0.094 | ||
| 2 spectra, AEDLGNR | 0.000 | 0.000 | 0.130 | 0.122 | 0.505 | 0.000 | 0.243 | 0.000 | ||
| 2 spectra, EGPEEVQYK | 0.000 | 0.000 | 0.000 | 0.452 | 0.145 | 0.000 | 0.380 | 0.024 |
| Plot | Mito | Lyso or Perox | ER | Golgi | PM | Cytosol | Nucleus | ||||||
| Expt B |
11 peptides |
22 spectra |
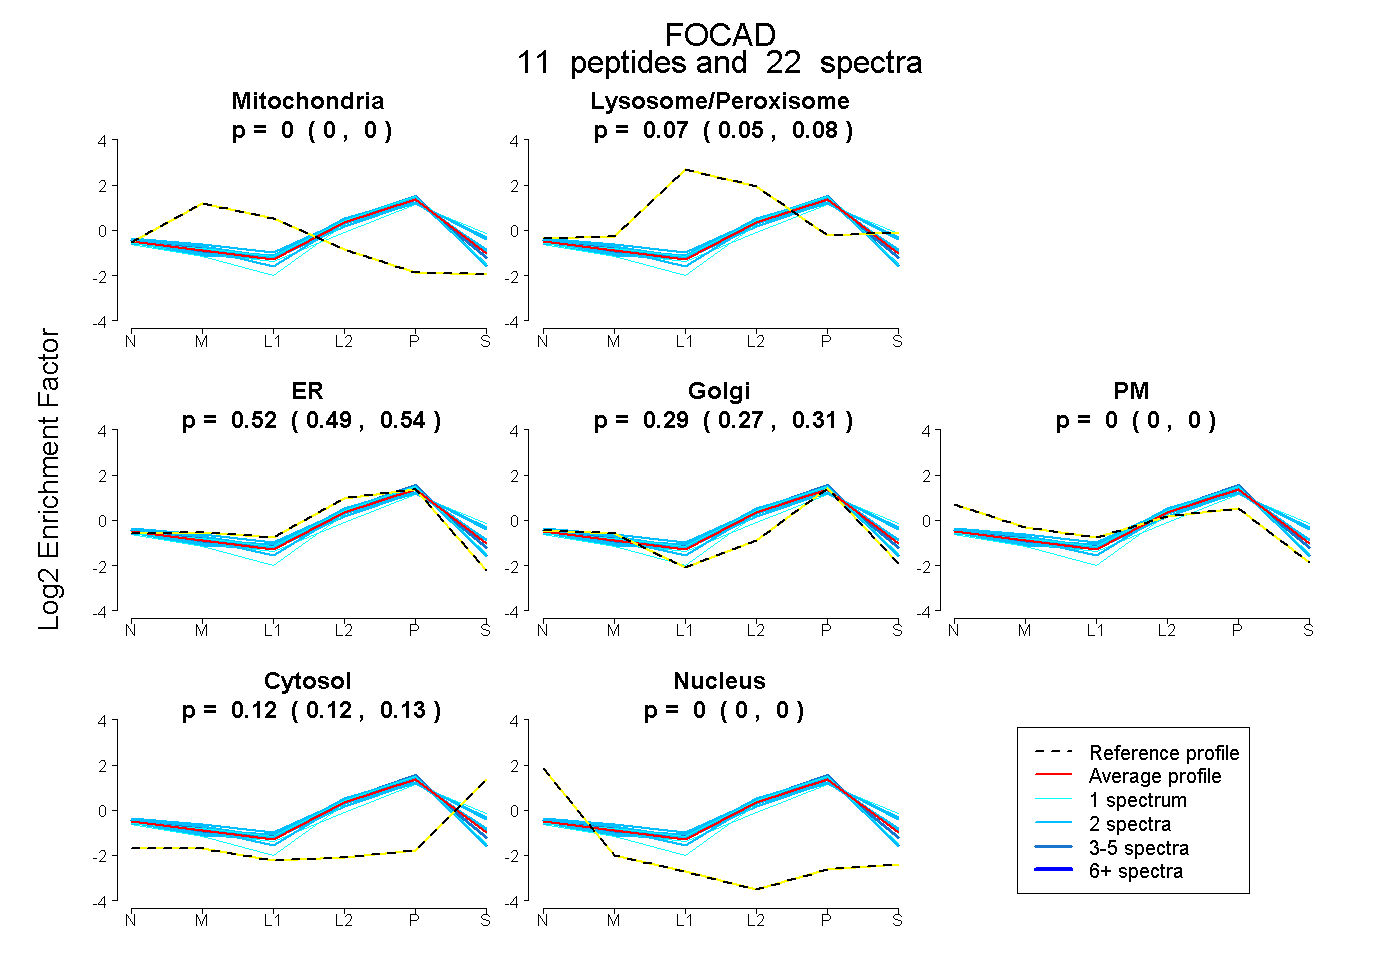 |
0.000 0.000 | 0.000 |
0.065 0.054 | 0.075 |
0.517 0.490 | 0.539 |
0.293 0.273 | 0.309 |
0.000 0.000 | 0.000 |
0.125 0.117 | 0.131 |
0.000 0.000 | 0.000 |
|||
| Plot | Lyso | Other | |||||||||||
| Expt C |
18 peptides |
41 spectra |
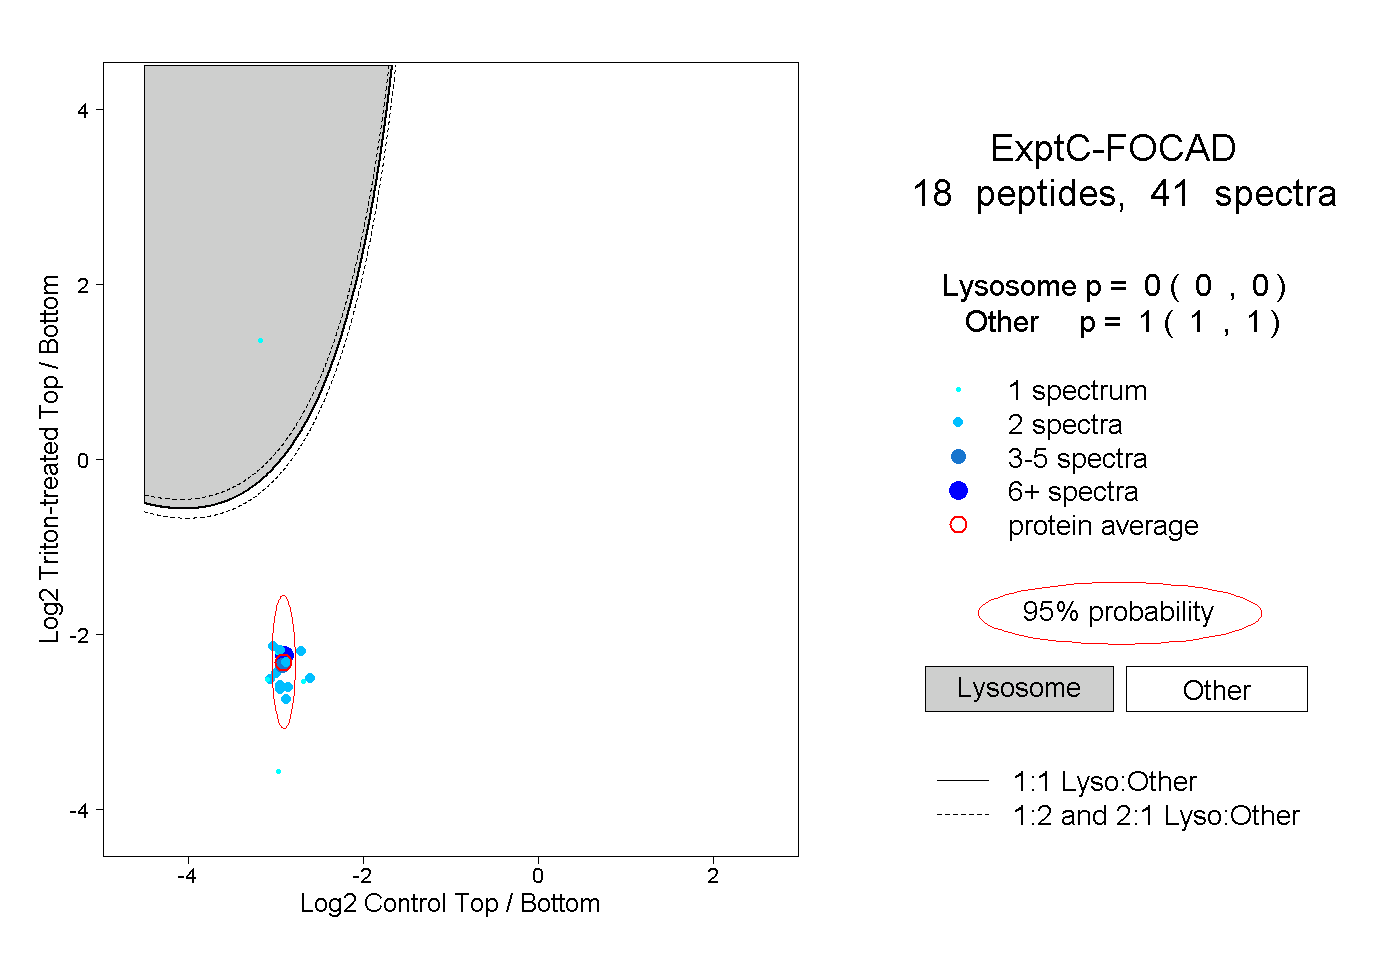 |
0.000 0.000 | 0.000 |
1.000 1.000 | 1.000 |
||||||||
| Plot | Lyso | Other | |||||||||||
| Expt D |
9 peptides |
12 spectra |
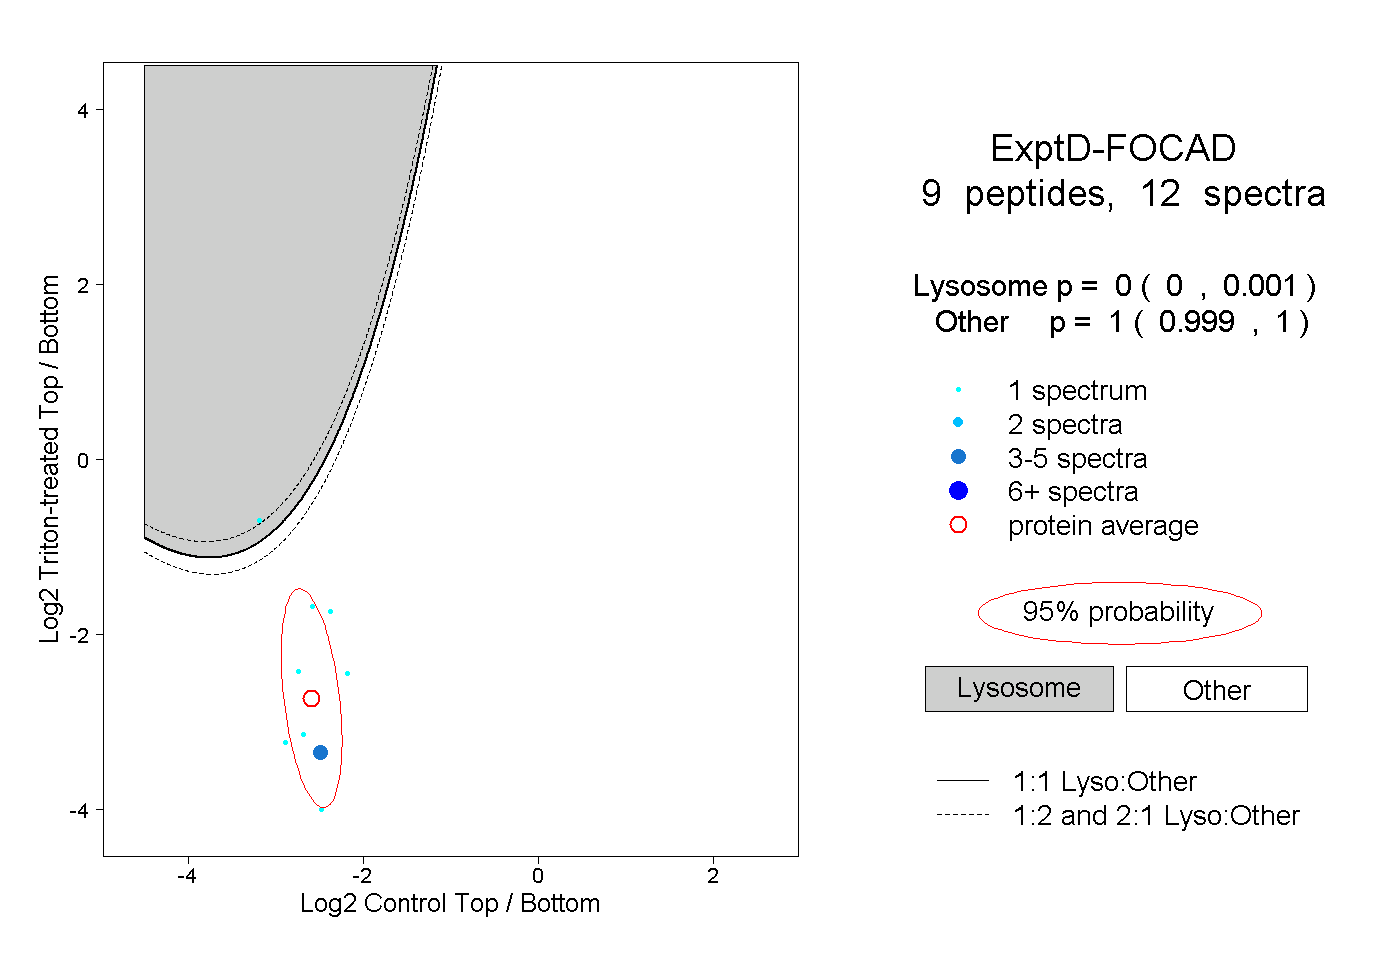 |
0.000 0.000 | 0.001 |
1.000 0.999 | 1.000 |