FOCAD
[ENSRNOP00000055189]
Main page
| | | Plot |
Mito |
Lyso |
|
Perox |
ER |
Golgi |
PM |
Cytosol |
Nucleus |
|
| Expt A |
 27
27
peptides |
50
spectra |
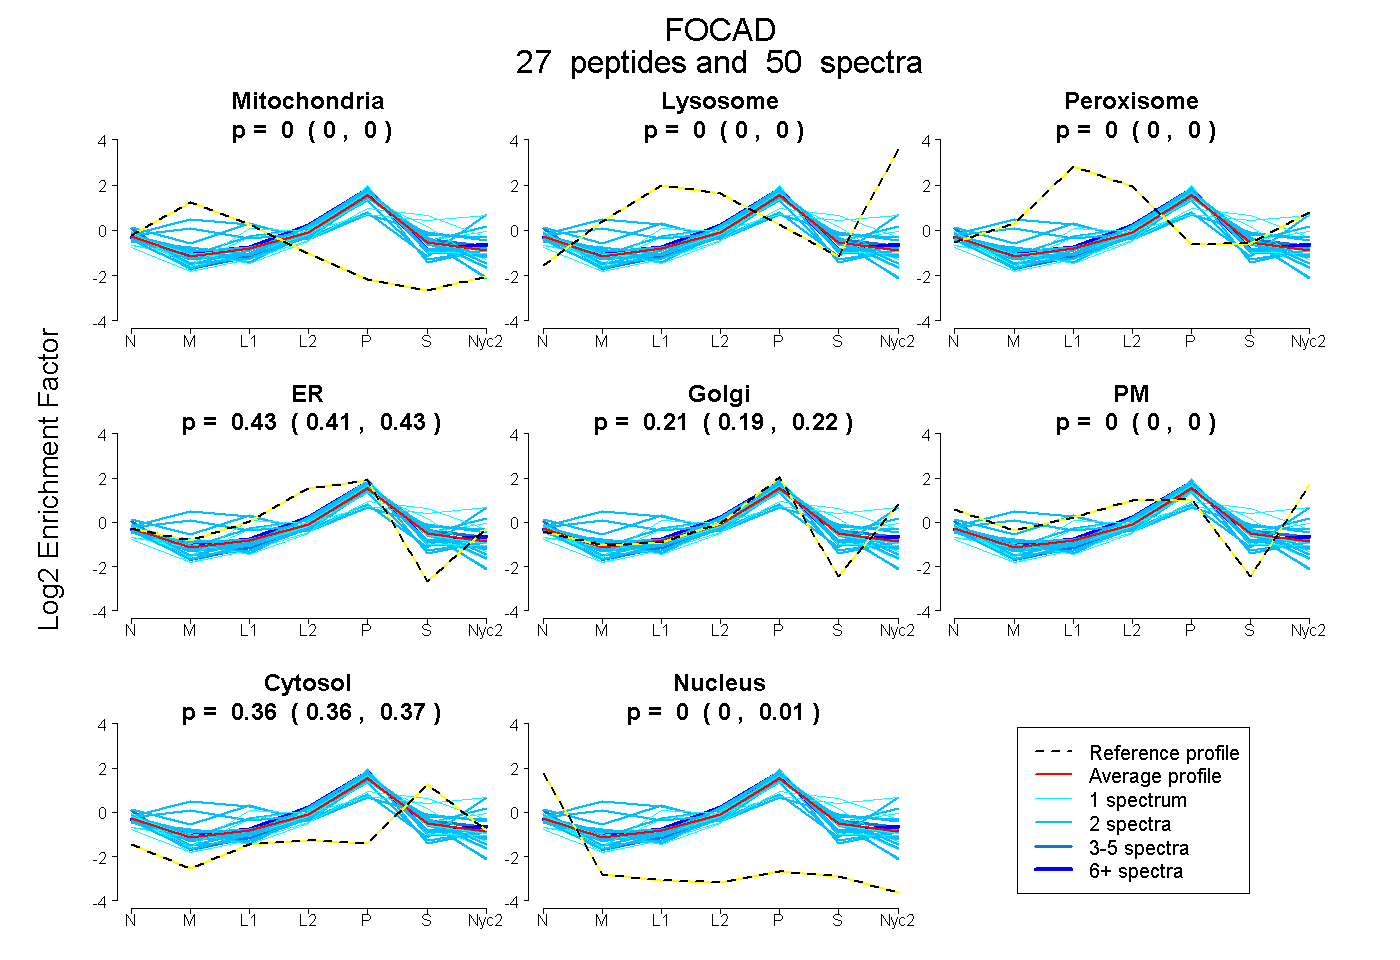 |
0.000
0.000 | 0.000 |
0.000
0.000 | 0.000 |
|
0.000
0.000 | 0.000 |
0.425
0.415 | 0.435 |
0.207
0.193 | 0.218 |
0.000
0.000 | 0.000 |
0.364
0.360 | 0.368 |
0.003
0.000 | 0.006 |
|
| | | Plot |
Mito |
|
Lyso or Perox |
|
ER |
Golgi |
PM |
Cytosol |
Nucleus |
|
| Expt B |
11
peptides |
22
spectra |
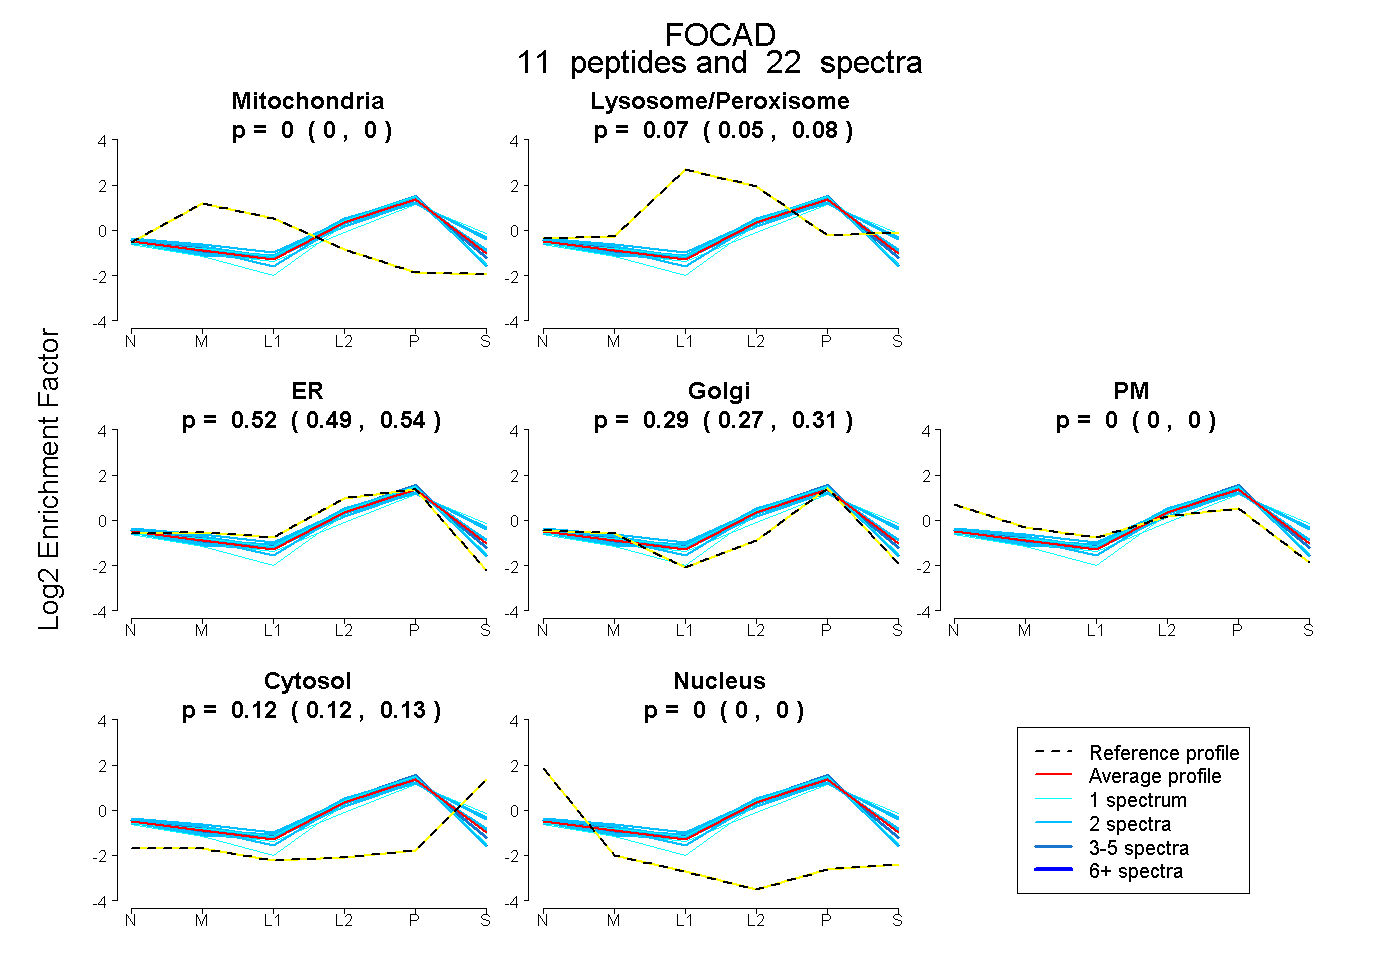 |
0.000
0.000 | 0.000 |
|
0.065
0.054 | 0.075 |
|
0.517
0.490 | 0.539 |
0.293
0.273 | 0.309 |
0.000
0.000 | 0.000 |
0.125
0.117 | 0.131 |
0.000
0.000 | 0.000 |
|
| 2 spectra, LLTSLWEK |
0.000 |
|
0.125 |
|
0.403 |
0.254 |
0.000 |
0.217 |
0.000 |
|
| 2 spectra, LLSLTEGQR |
0.000 |
|
0.200 |
|
0.303 |
0.416 |
0.000 |
0.081 |
0.000 |
|
| 2 spectra, AAIGFFITGGK |
0.000 |
|
0.126 |
|
0.343 |
0.326 |
0.000 |
0.204 |
0.000 |
|
| 2 spectra, TVAGIPNFILK |
0.000 |
|
0.041 |
|
0.644 |
0.272 |
0.000 |
0.043 |
0.000 |
|
| 4 spectra, IFDLLPNR |
0.000 |
|
0.071 |
|
0.555 |
0.284 |
0.000 |
0.090 |
0.000 |
|
| 2 spectra, LYLISQGR |
0.000 |
|
0.000 |
|
0.597 |
0.236 |
0.000 |
0.167 |
0.000 |
|
| 3 spectra, ATLLSLR |
0.000 |
|
0.036 |
|
0.624 |
0.288 |
0.000 |
0.053 |
0.000 |
|
| 1 spectrum, VLLQPR |
0.000 |
|
0.039 |
|
0.623 |
0.278 |
0.000 |
0.060 |
0.000 |
|
| 2 spectra, VIQLLGTTPR |
0.000 |
|
0.040 |
|
0.637 |
0.272 |
0.000 |
0.051 |
0.000 |
|
| 1 spectrum, DLQDLYSIR |
0.000 |
|
0.163 |
|
0.155 |
0.455 |
0.000 |
0.226 |
0.000 |
|
| 1 spectrum, AEDLGNR |
0.000 |
|
0.000 |
|
0.453 |
0.411 |
0.000 |
0.135 |
0.000 |
|
| | | Plot |
|
Lyso |
|
|
|
|
|
|
|
Other |
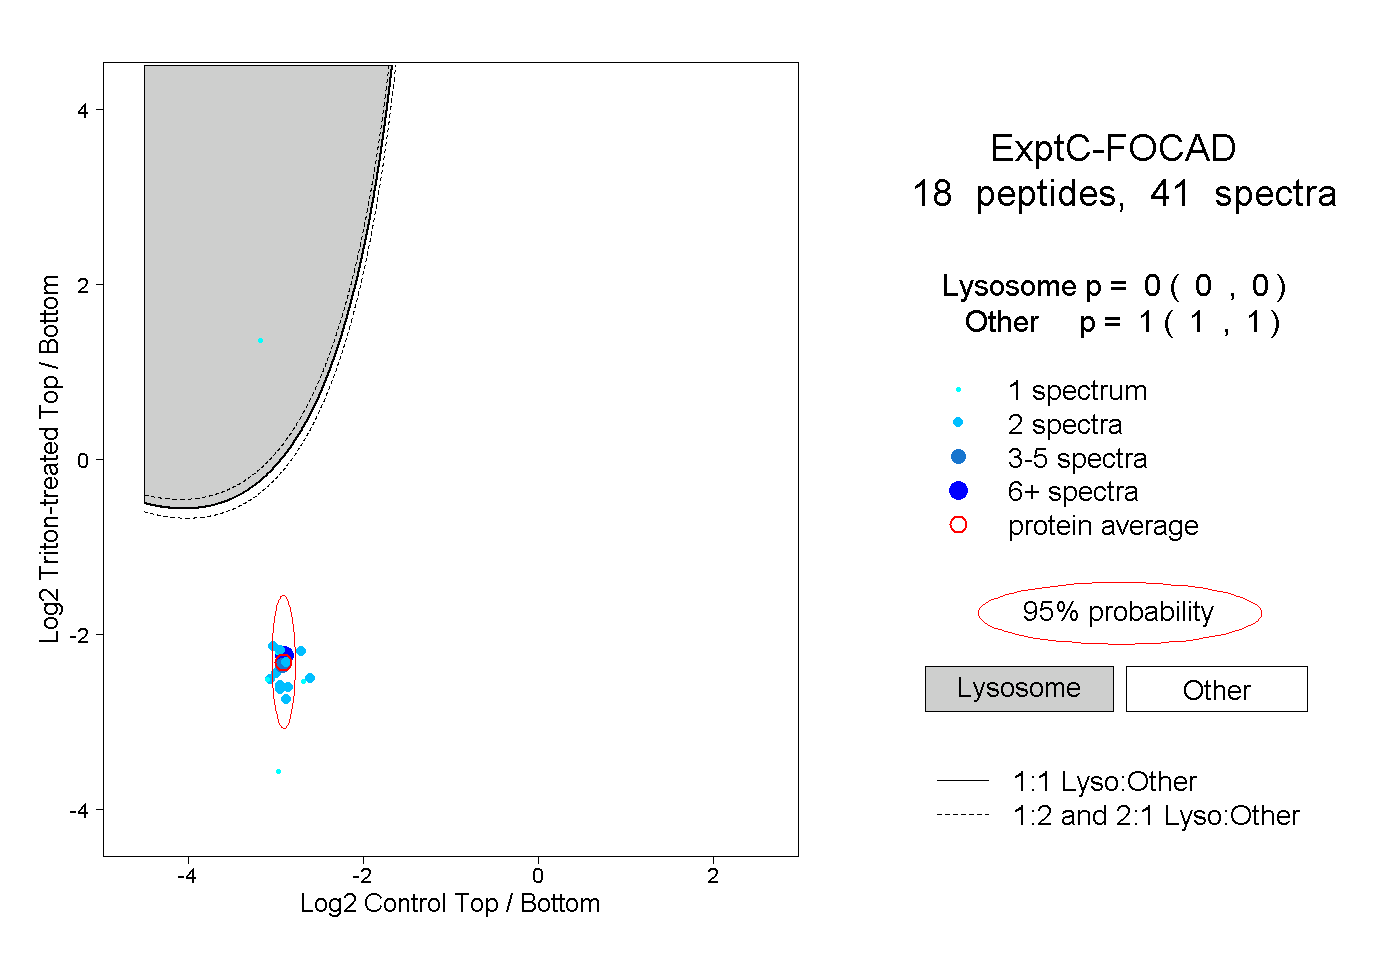
| Expt C |
18
peptides |
41
spectra |
 |
|
0.000
0.000 | 0.000 |
|
|
|
|
|
|
|
1.000
1.000 | 1.000 |
| | | Plot |
|
Lyso |
|
|
|
|
|
|
|
Other |
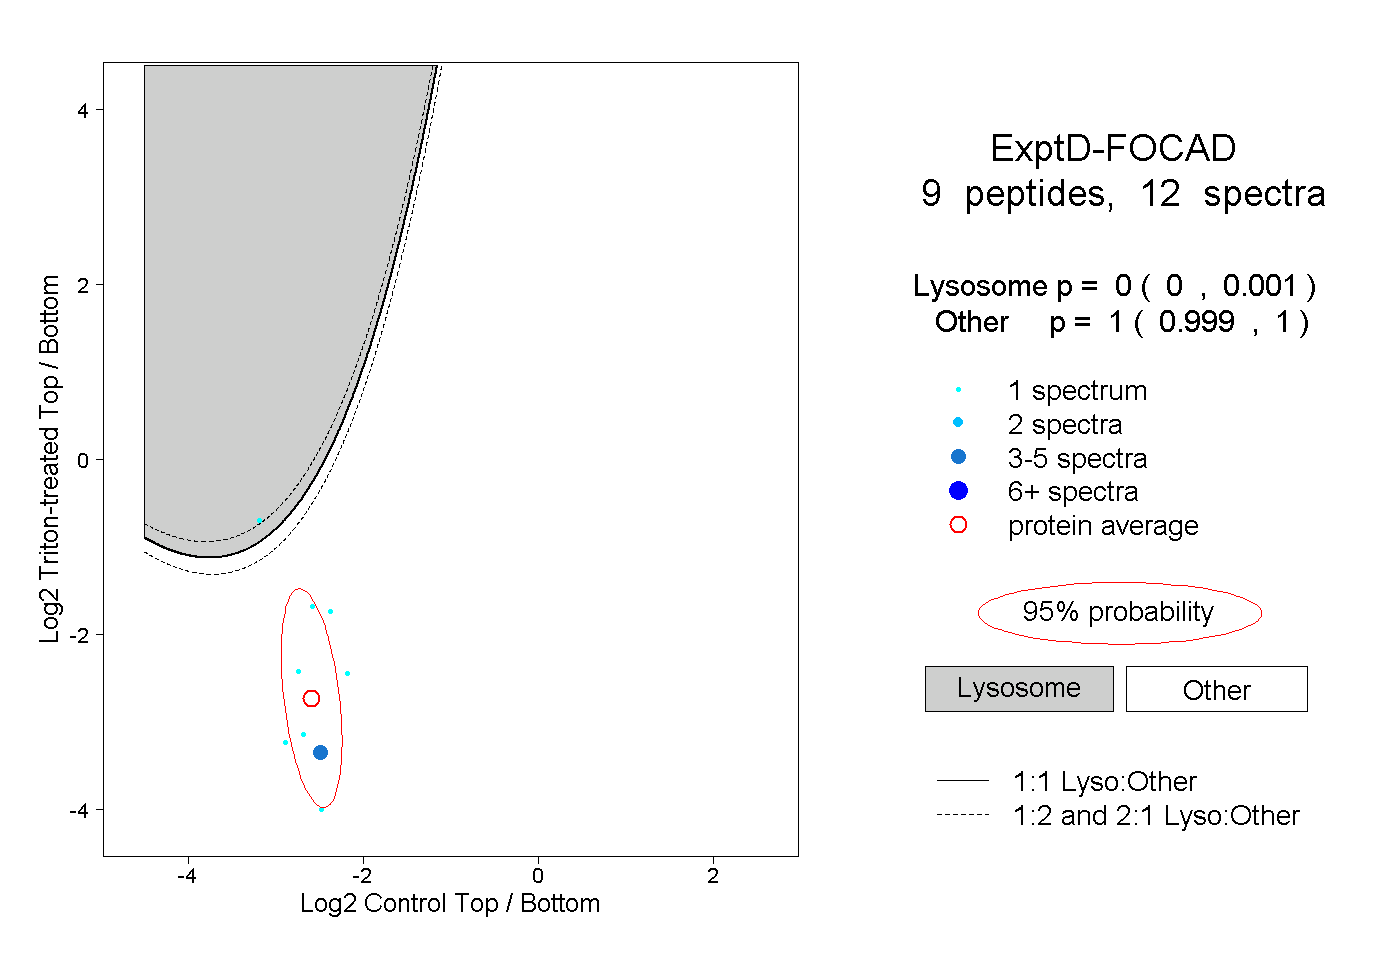
| Expt D |
9
peptides |
12
spectra |
 |
|
0.000
0.000 | 0.001 |
|
|
|
|
|
|
|
1.000
0.999 | 1.000 |