 6
6peptides
spectra
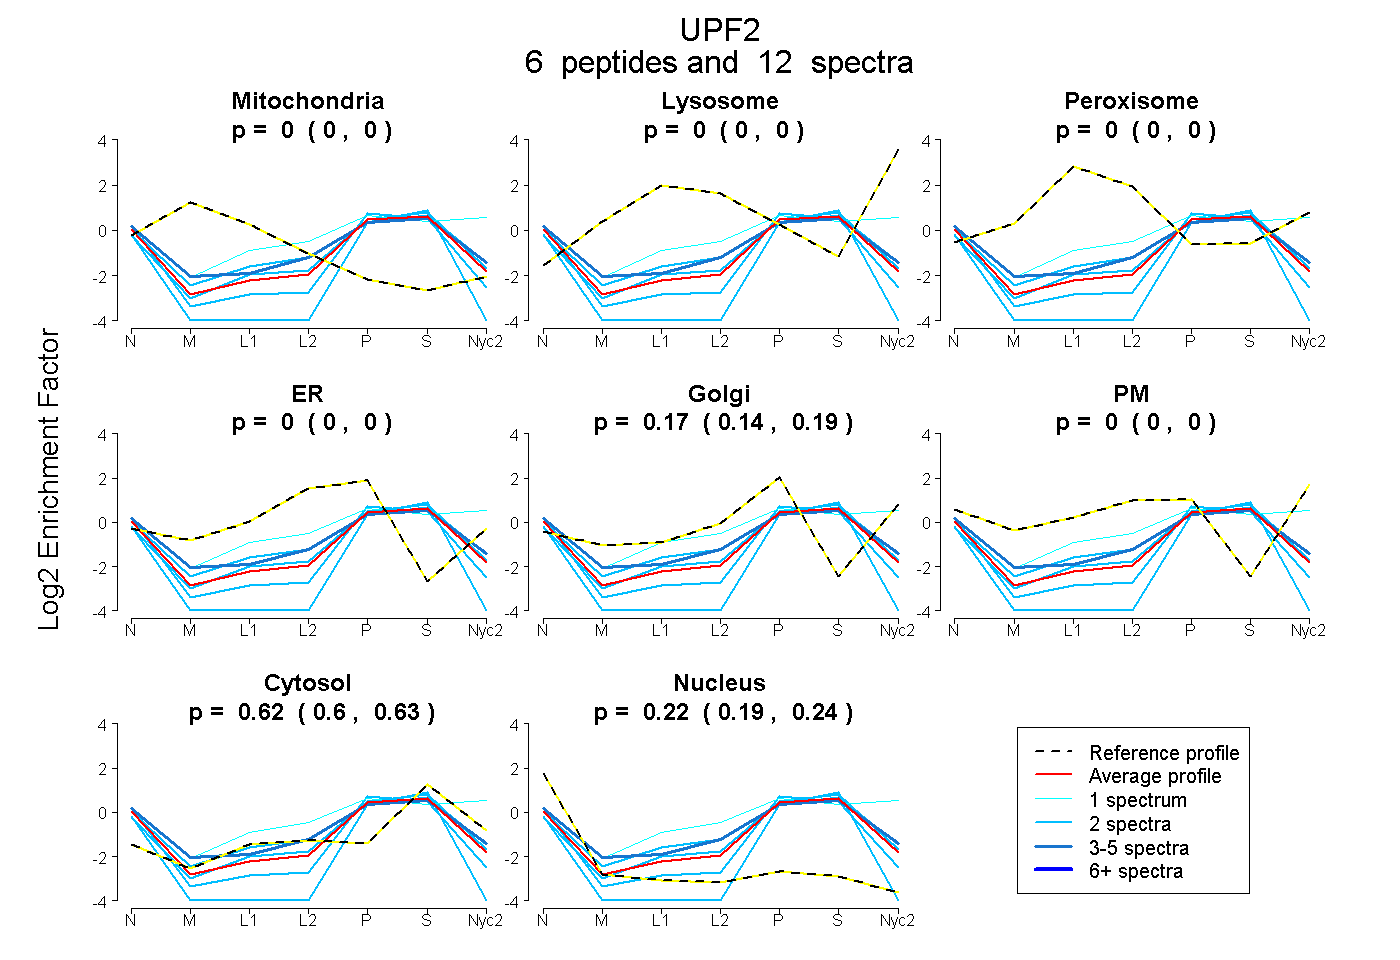
0.000 | 0.000
0.000 | 0.000
0.000 | 0.000
0.000 | 0.000
0.142 | 0.191
0.000 | 0.000
0.604 | 0.625
0.186 | 0.240
3peptides
spectra
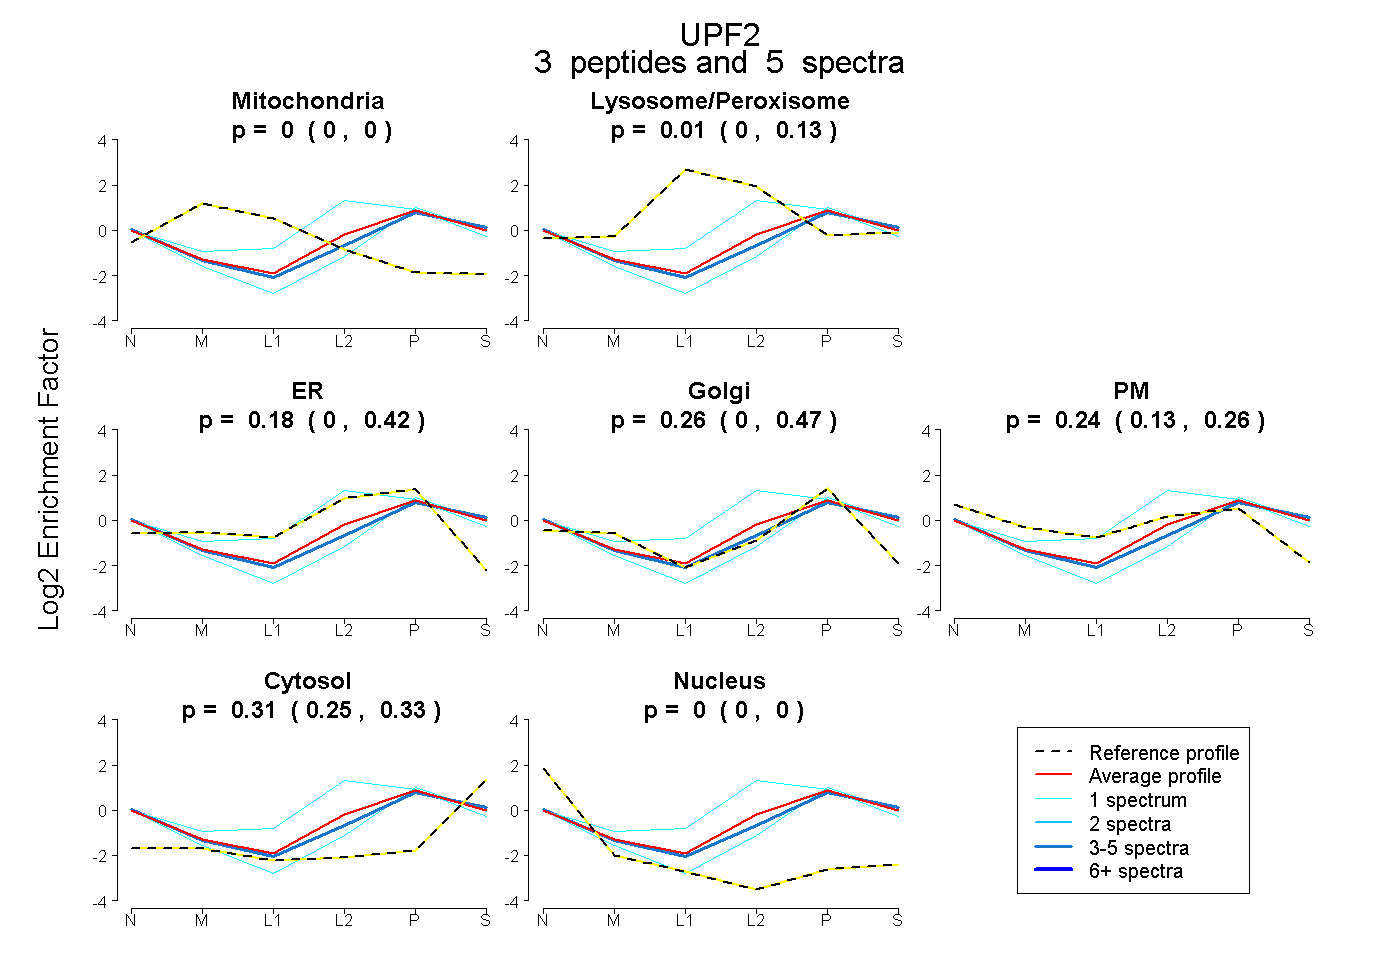
0.000 | 0.000
0.000 | 0.134
0.000 | 0.420
0.000 | 0.474
0.127 | 0.256
0.249 | 0.329
0.000 | 0.000
7peptides
spectra
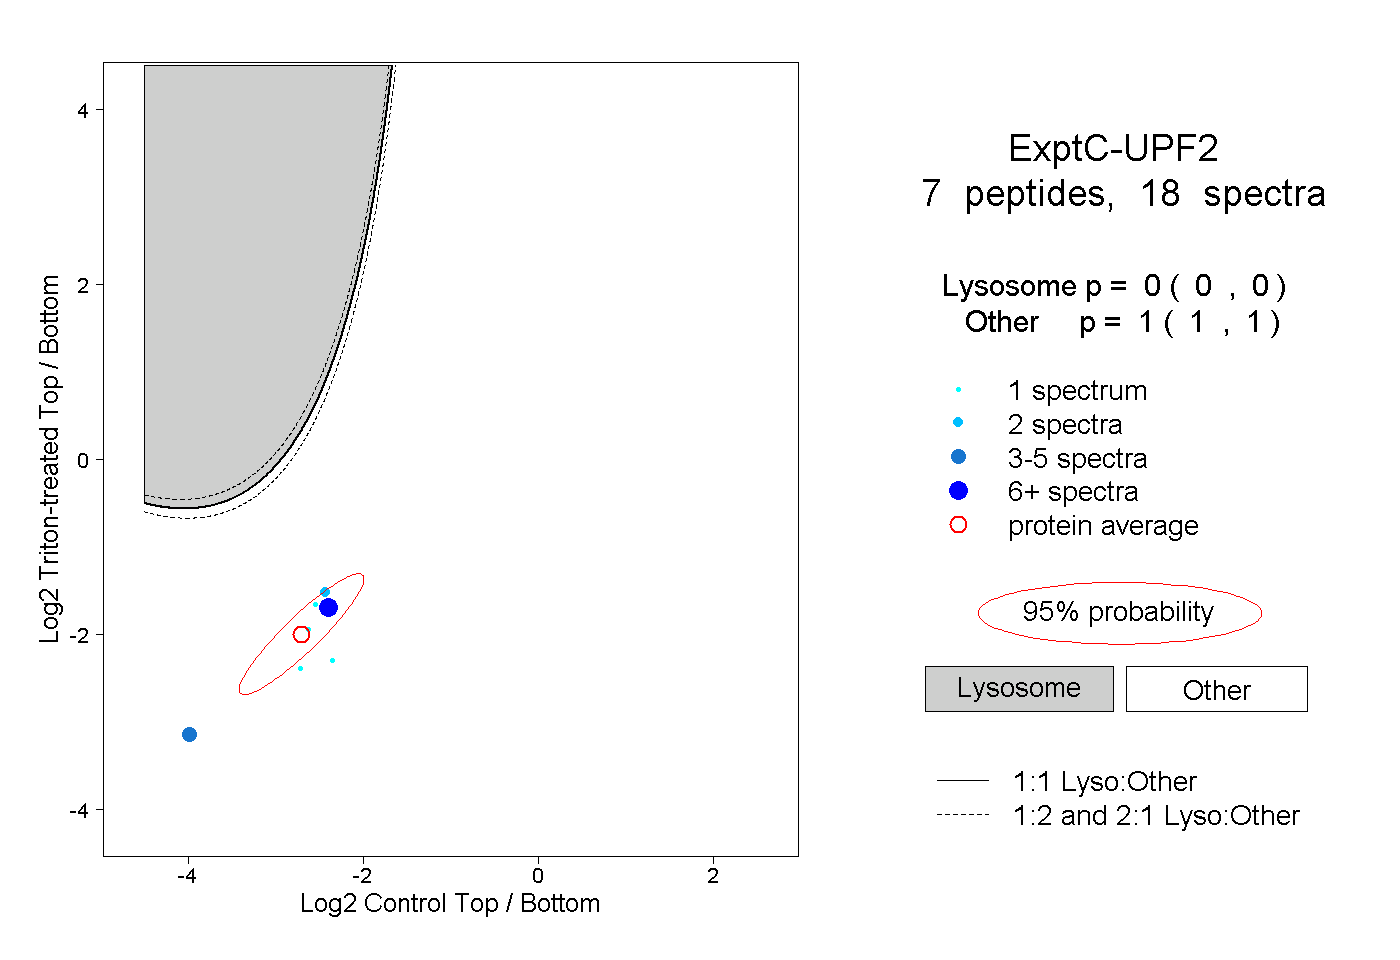
0.000 | 0.000
1.000 | 1.000
1peptide
spectrum
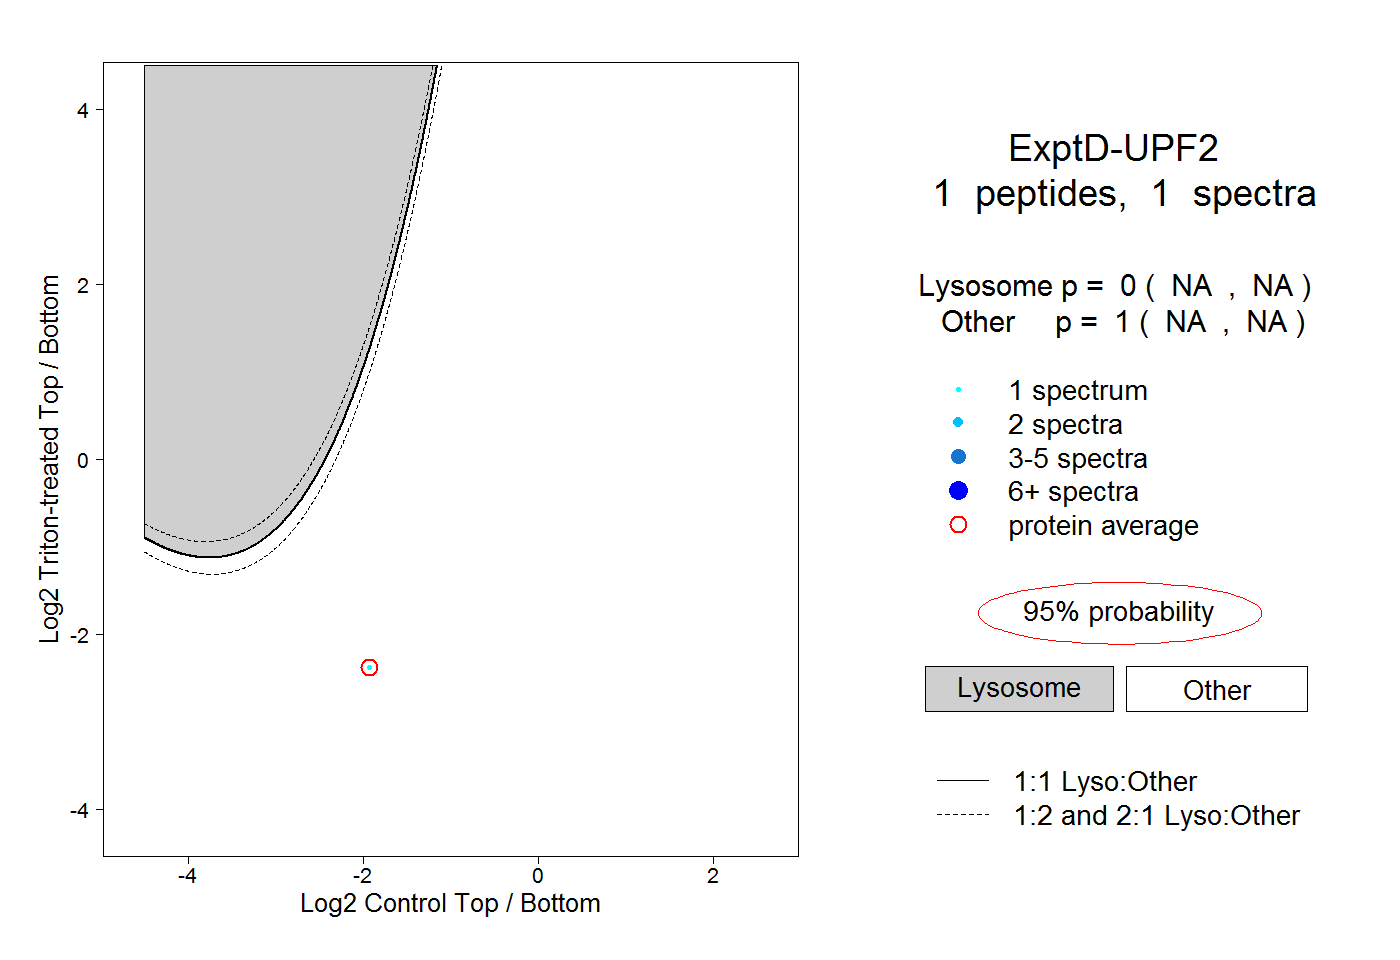
NA | NA
NA | NA