UPF2
[ENSRNOP00000054878]
Main page
| | | Plot |
Mito |
Lyso |
|
Perox |
ER |
Golgi |
PM |
Cytosol |
Nucleus |
|
| Expt A |
 6
6
peptides |
12
spectra |
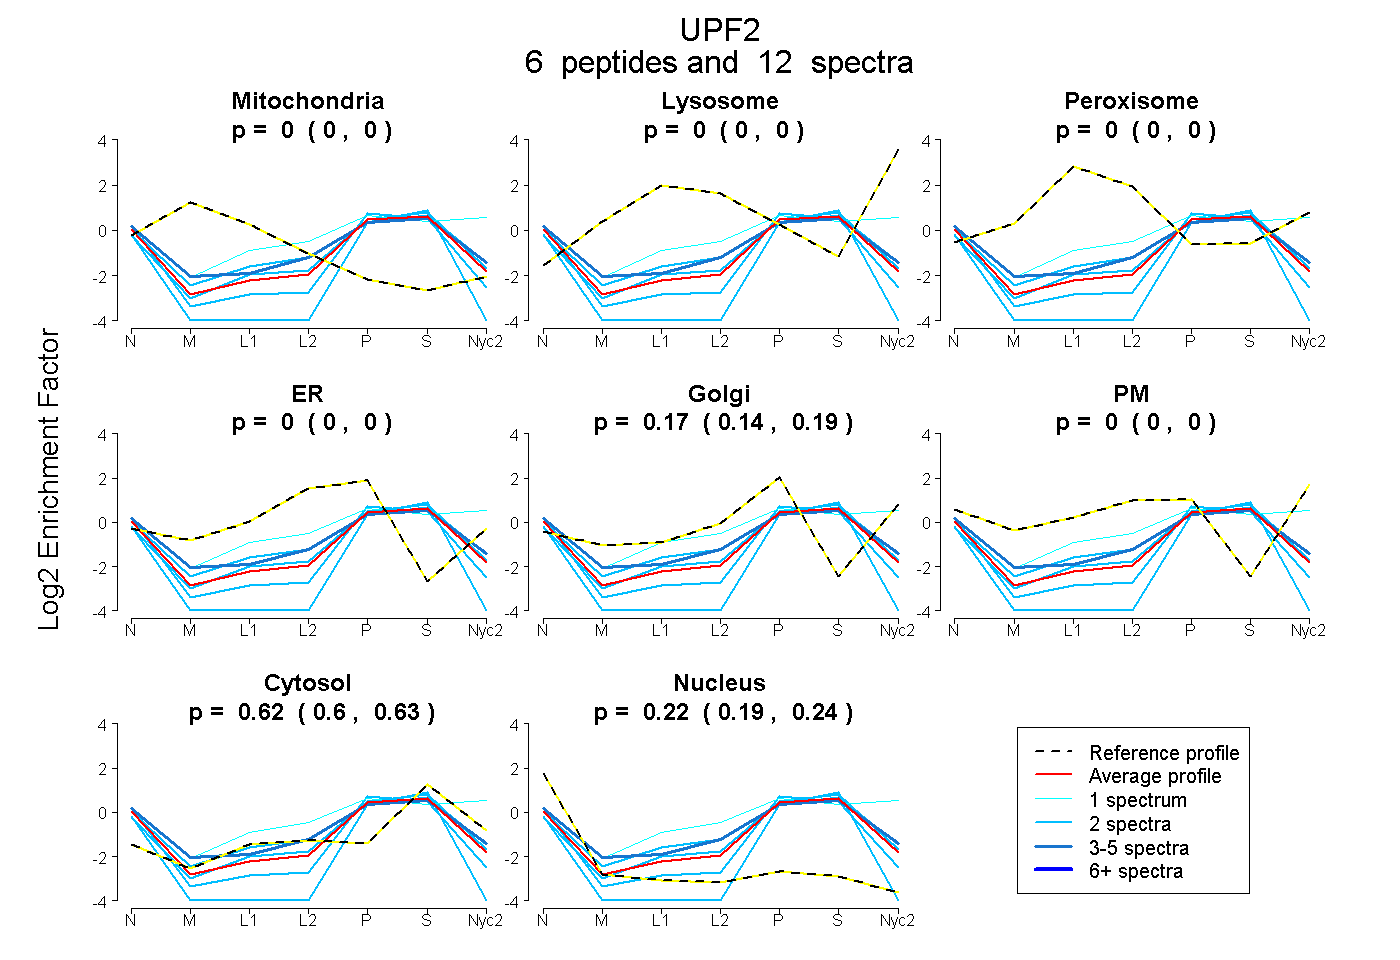 |
0.000
0.000 | 0.000 |
0.000
0.000 | 0.000 |
|
0.000
0.000 | 0.000 |
0.000
0.000 | 0.000 |
0.169
0.142 | 0.191 |
0.000
0.000 | 0.000 |
0.616
0.604 | 0.625 |
0.216
0.186 | 0.240 |
|
| | | Plot |
Mito |
|
Lyso or Perox |
|
ER |
Golgi |
PM |
Cytosol |
Nucleus |
|
| Expt B |
3
peptides |
5
spectra |
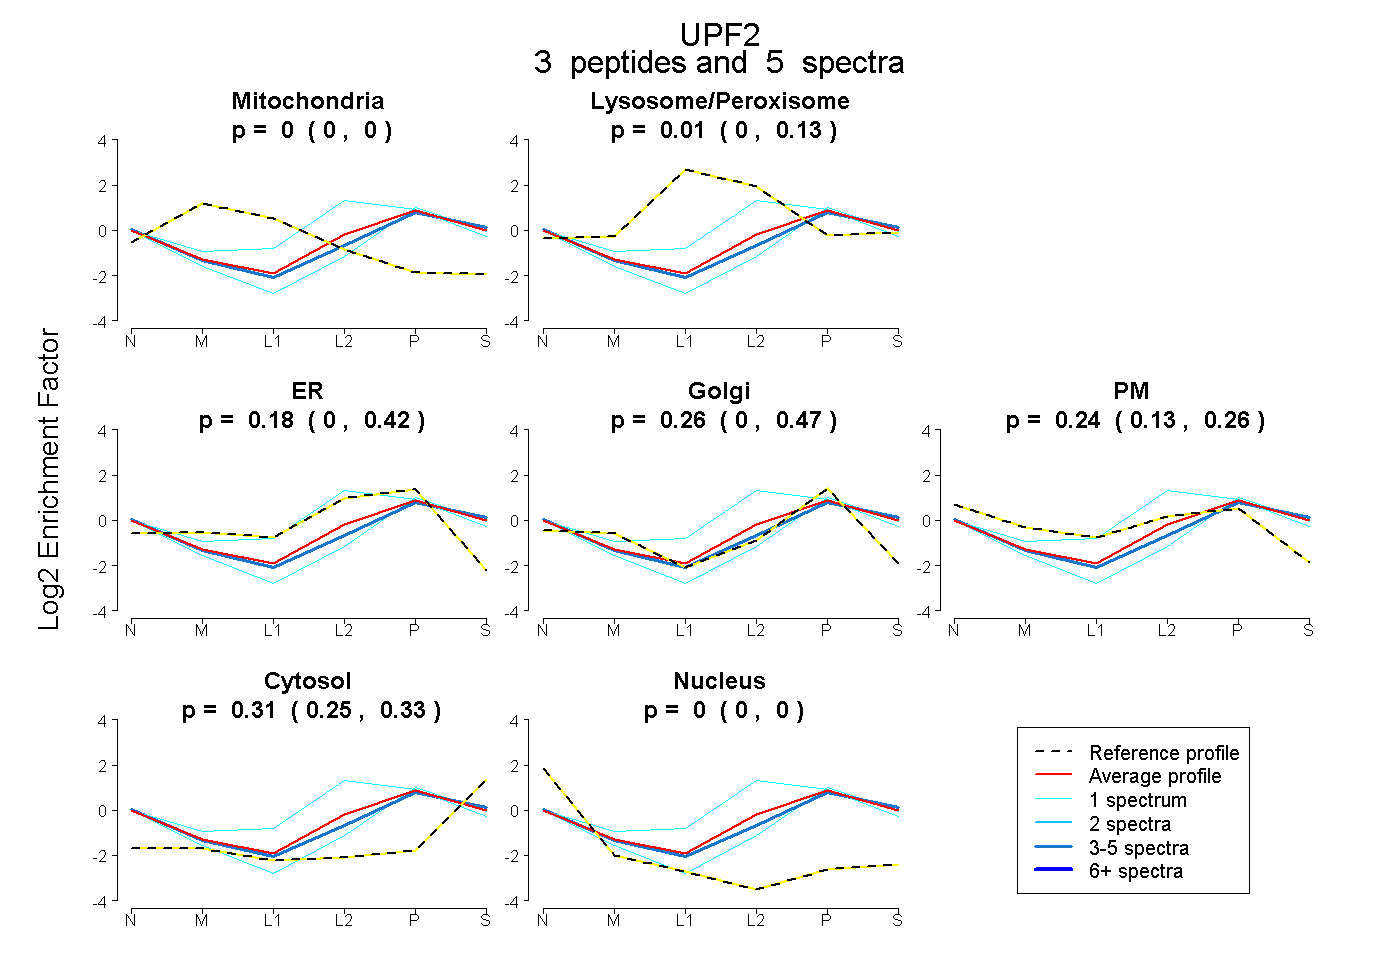 |
0.000
0.000 | 0.000 |
|
0.012
0.000 | 0.134 |
|
0.177
0.000 | 0.420 |
0.257
0.000 | 0.474 |
0.243
0.127 | 0.256 |
0.311
0.249 | 0.329 |
0.000
0.000 | 0.000 |
|
| 1 spectrum, NFYENLIDLK |
0.000 |
|
0.207 |
|
0.532 |
0.000 |
0.099 |
0.162 |
0.000 |
|
| 3 spectra, ALFIVPR |
0.000 |
|
0.007 |
|
0.000 |
0.393 |
0.251 |
0.348 |
0.000 |
|
| 1 spectrum, AFVPAILFK |
0.000 |
|
0.000 |
|
0.000 |
0.673 |
0.000 |
0.327 |
0.000 |
|
| | | Plot |
|
Lyso |
|
|
|
|
|
|
|
Other |
| Expt C |
7
peptides |
18
spectra |
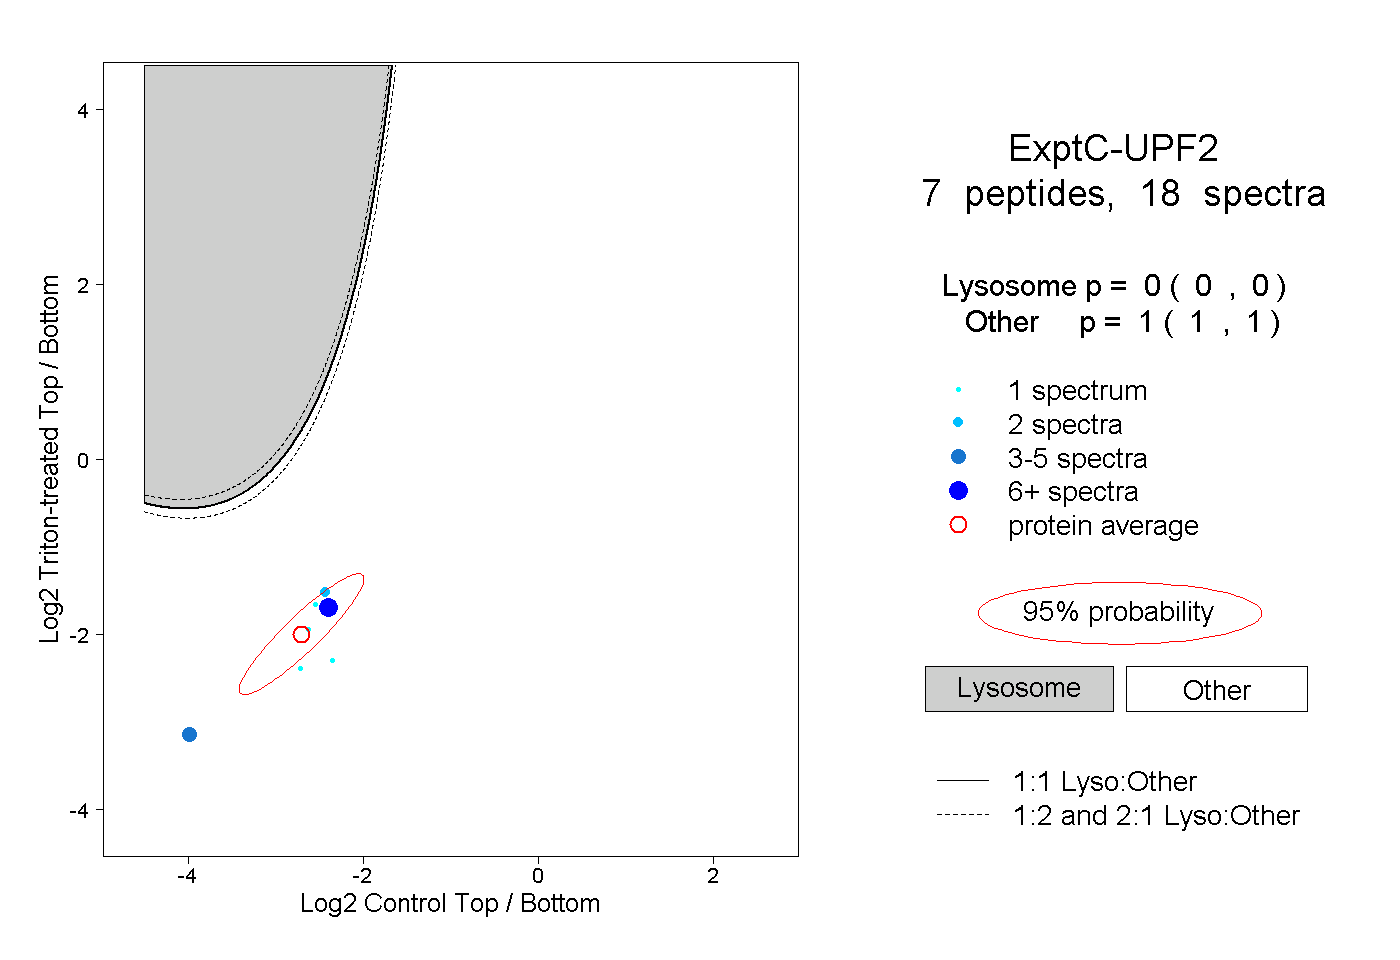 |
|
0.000
0.000 | 0.000 |
|
|
|
|
|
|
|
1.000
1.000 | 1.000 |
| | | Plot |
|
Lyso |
|
|
|
|
|
|
|
Other |
| Expt D |
1
peptide |
1
spectrum |
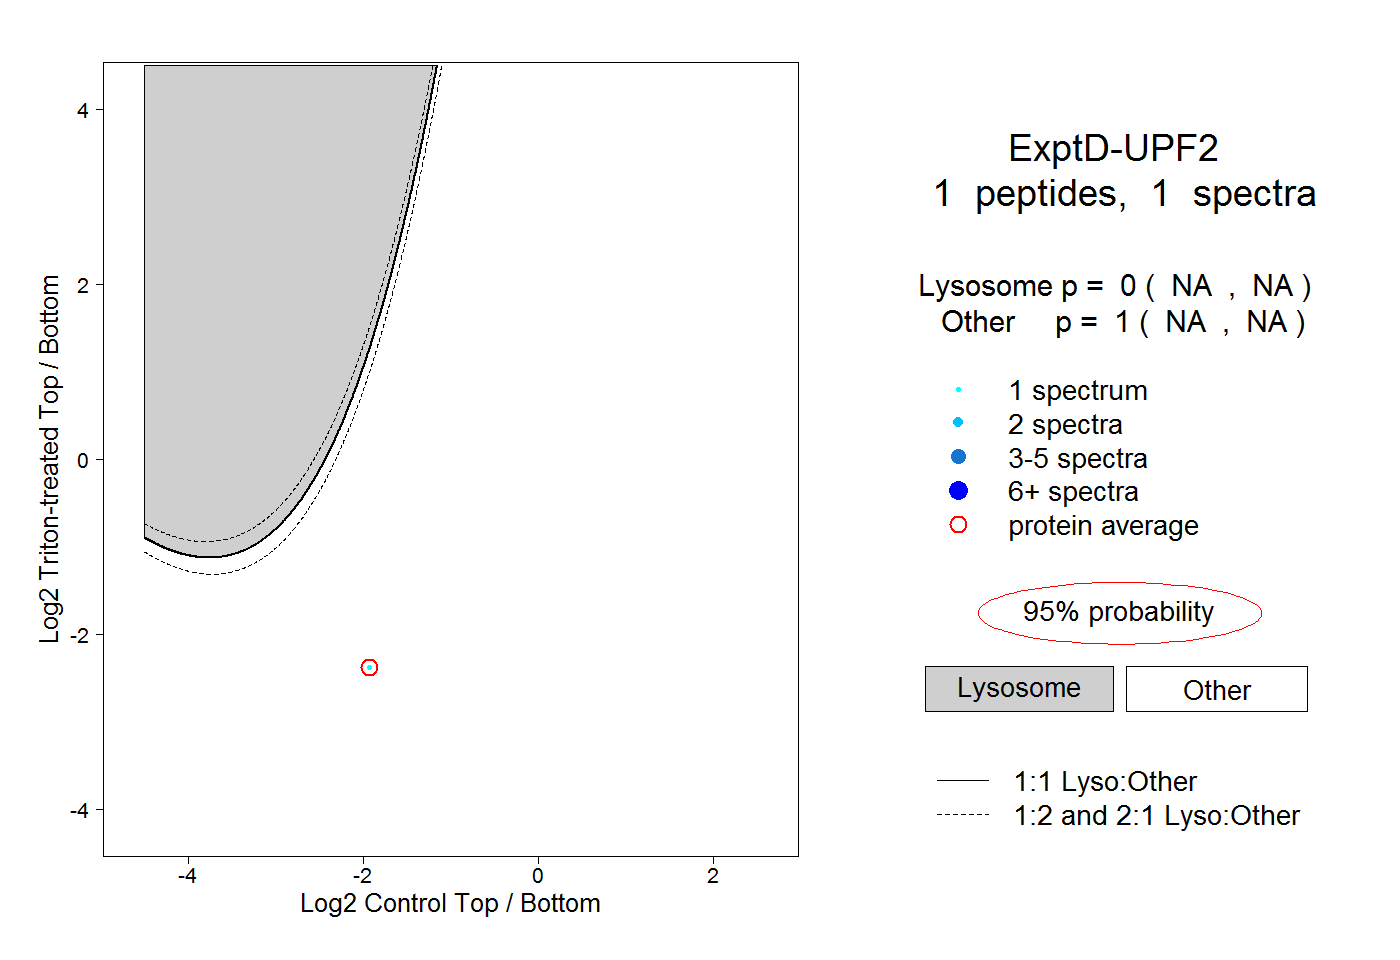 |
|
0.000
NA | NA |
|
|
|
|
|
|
|
1.000
NA | NA |