 6
6peptides
spectra
0.000 | 0.000
0.000 | 0.000
0.000 | 0.000
0.000 | 0.000
0.142 | 0.191
0.000 | 0.000
0.604 | 0.625
0.186 | 0.240
| Plot | Mito | Lyso | Perox | ER | Golgi | PM | Cytosol | Nucleus | |||||
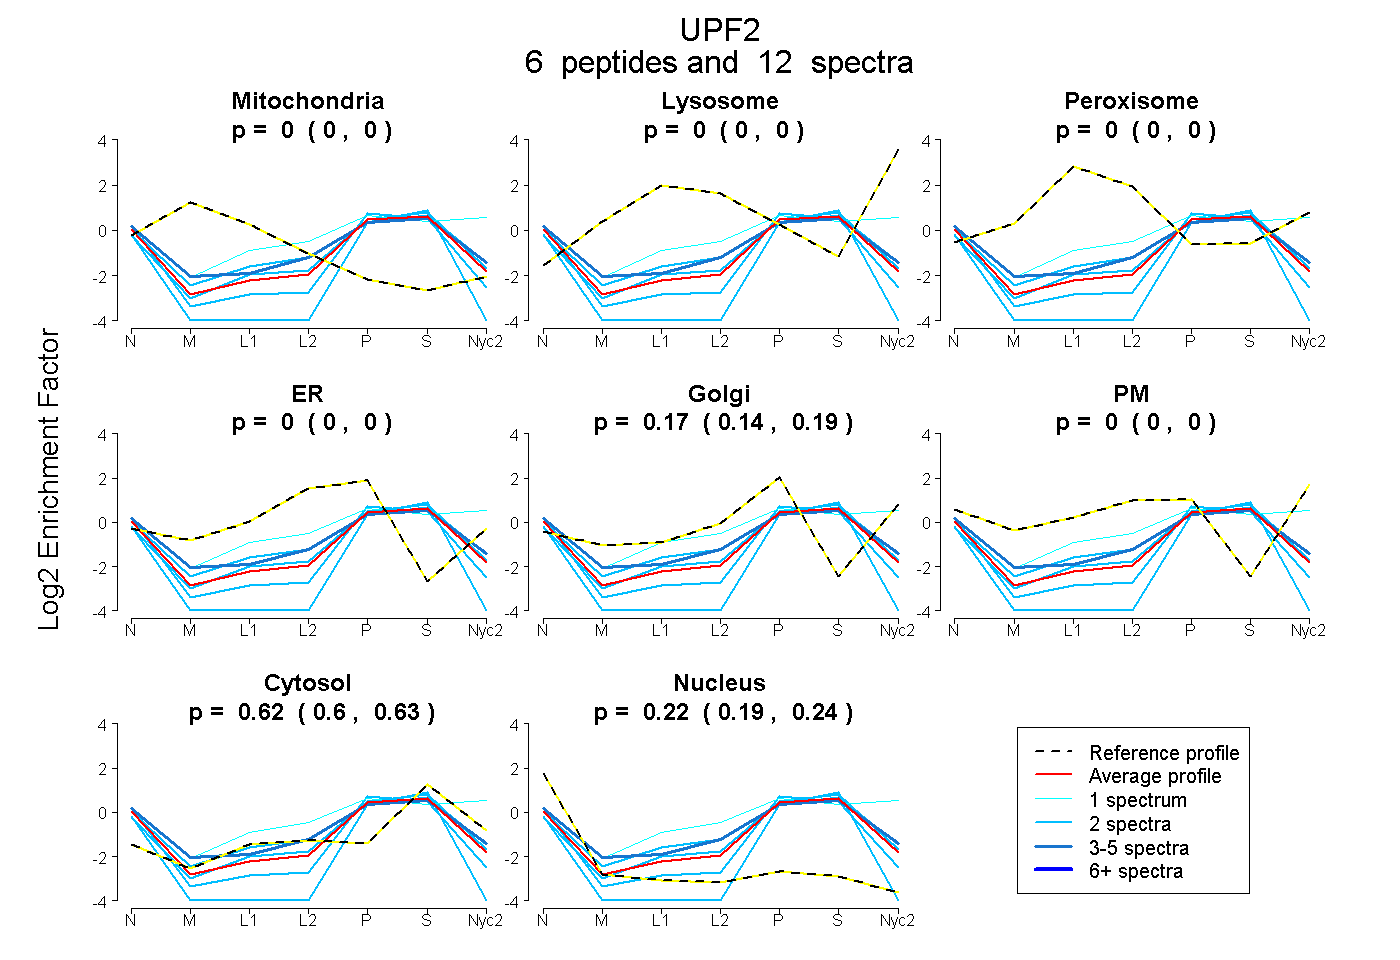
| Expt A |
6 peptides |
12 spectra |
|
0.000 0.000 | 0.000 |
0.000 0.000 | 0.000 |
0.000 0.000 | 0.000 |
0.000 0.000 | 0.000 |
0.169 0.142 | 0.191 |
0.000 0.000 | 0.000 |
0.616 0.604 | 0.625 |
0.216 0.186 | 0.240 |
| 1 spectrum, QQEEAAAQLK | 0.000 | 0.000 | 0.000 | 0.000 | 0.164 | 0.306 | 0.531 | 0.000 | ||
| 2 spectra, ALFIVPR | 0.000 | 0.000 | 0.000 | 0.000 | 0.164 | 0.000 | 0.680 | 0.156 | ||
| 3 spectra, TITEQQR | 0.000 | 0.000 | 0.000 | 0.031 | 0.240 | 0.000 | 0.579 | 0.150 | ||
| 2 spectra, GELSEDR | 0.000 | 0.000 | 0.000 | 0.076 | 0.162 | 0.000 | 0.637 | 0.125 | ||
| 2 spectra, AFVPAILFK | 0.000 | 0.000 | 0.000 | 0.000 | 0.091 | 0.000 | 0.560 | 0.349 | ||
| 2 spectra, HVPCVEDEDFIQALDK | 0.000 | 0.000 | 0.000 | 0.000 | 0.000 | 0.000 | 0.492 | 0.508 |
| Plot | Mito | Lyso or Perox | ER | Golgi | PM | Cytosol | Nucleus | ||||||
| Expt B |
3 peptides |
5 spectra |
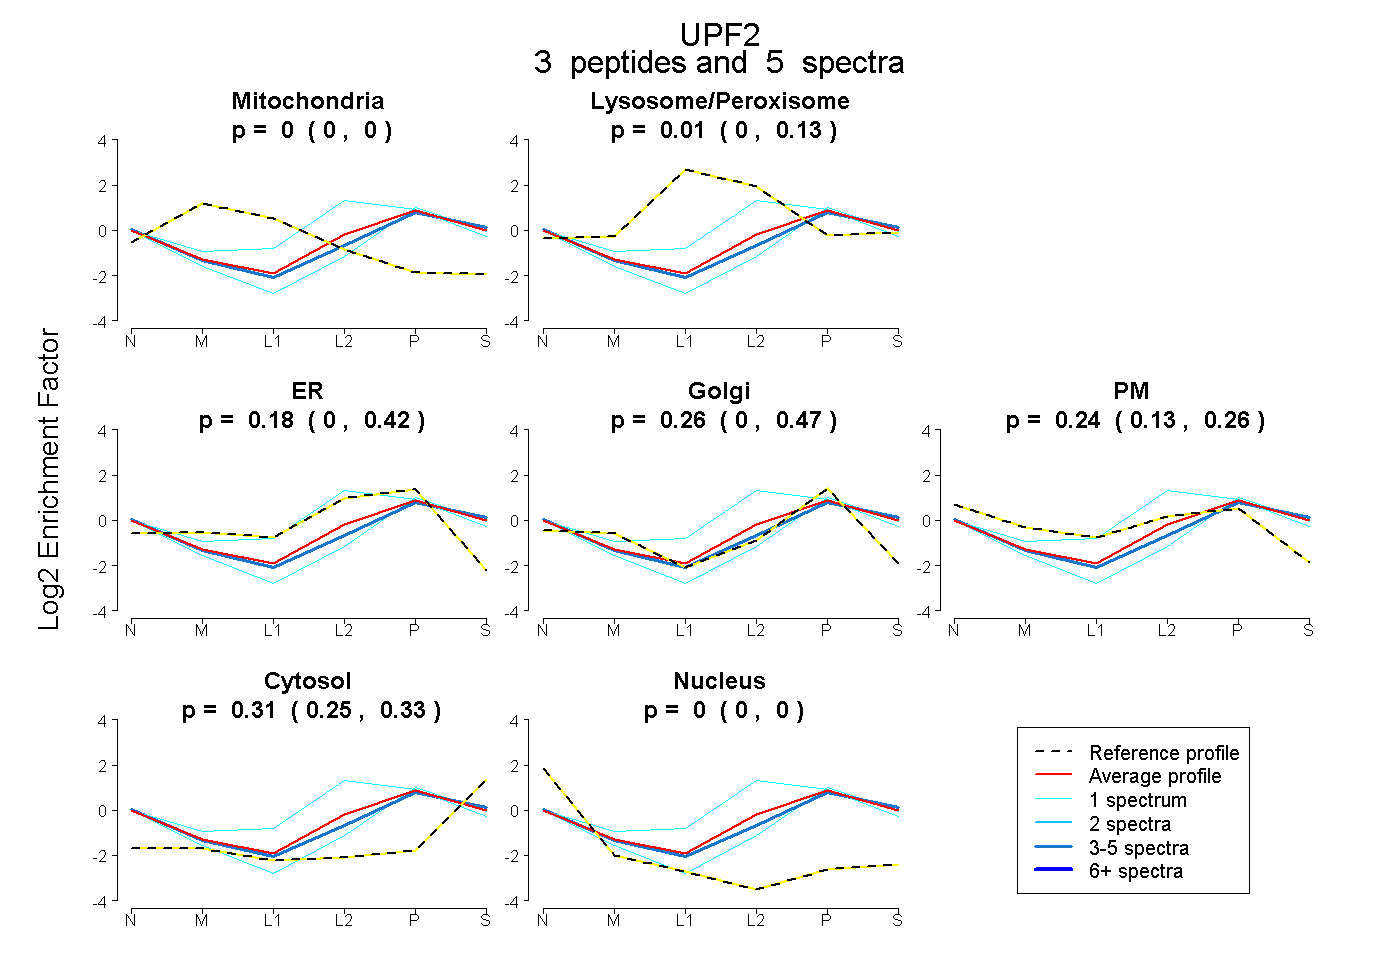 |
0.000 0.000 | 0.000 |
0.012 0.000 | 0.134 |
0.177 0.000 | 0.420 |
0.257 0.000 | 0.474 |
0.243 0.127 | 0.256 |
0.311 0.249 | 0.329 |
0.000 0.000 | 0.000 |
|||
| Plot | Lyso | Other | |||||||||||
| Expt C |
7 peptides |
18 spectra |
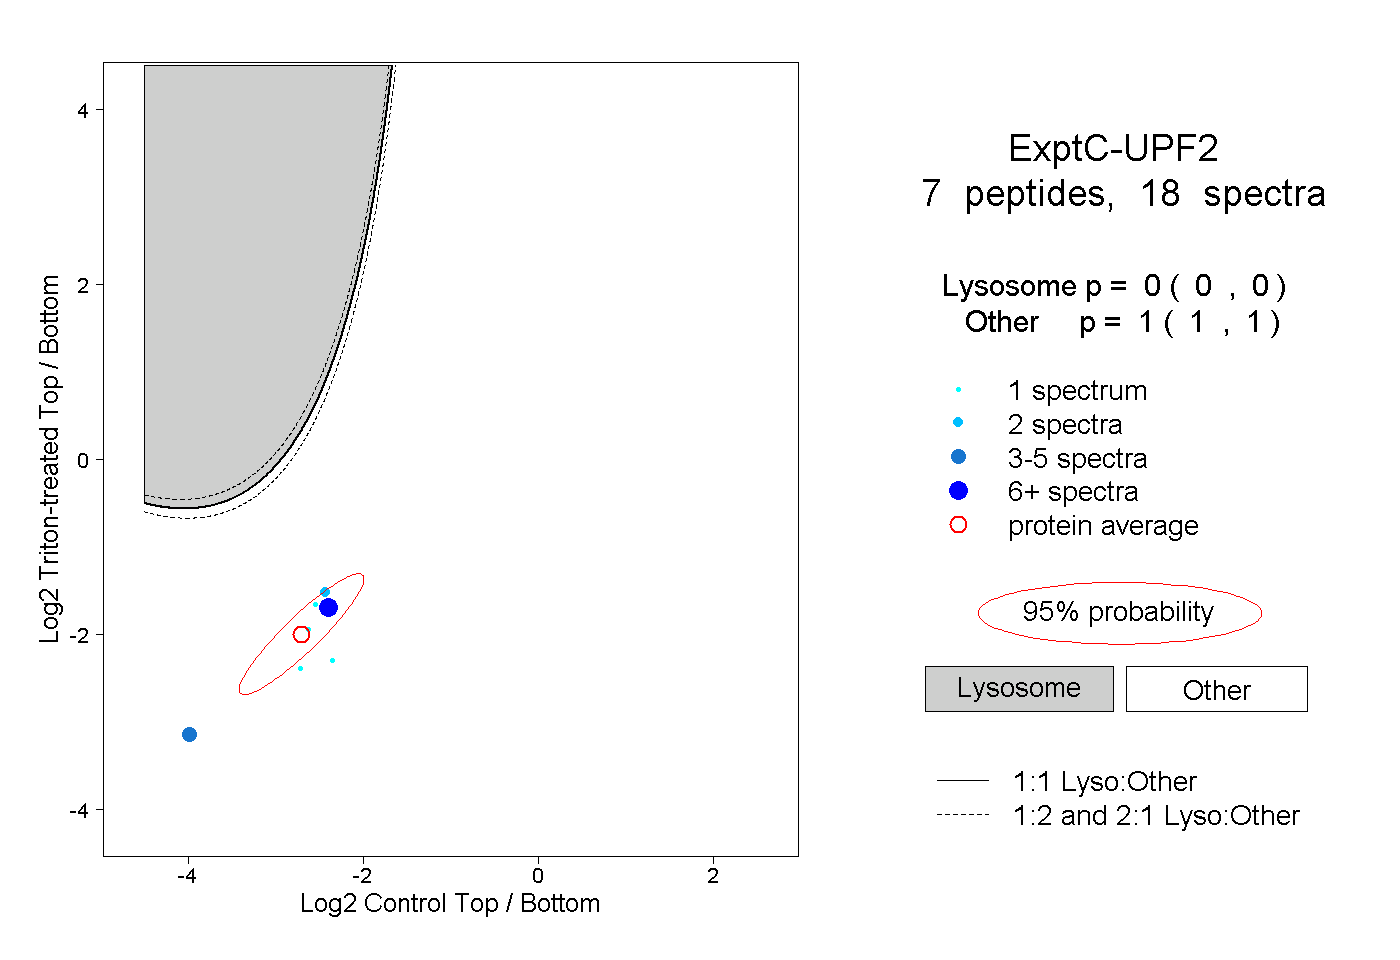 |
0.000 0.000 | 0.000 |
1.000 1.000 | 1.000 |
||||||||
| Plot | Lyso | Other | |||||||||||
| Expt D |
1 peptide |
1 spectrum |
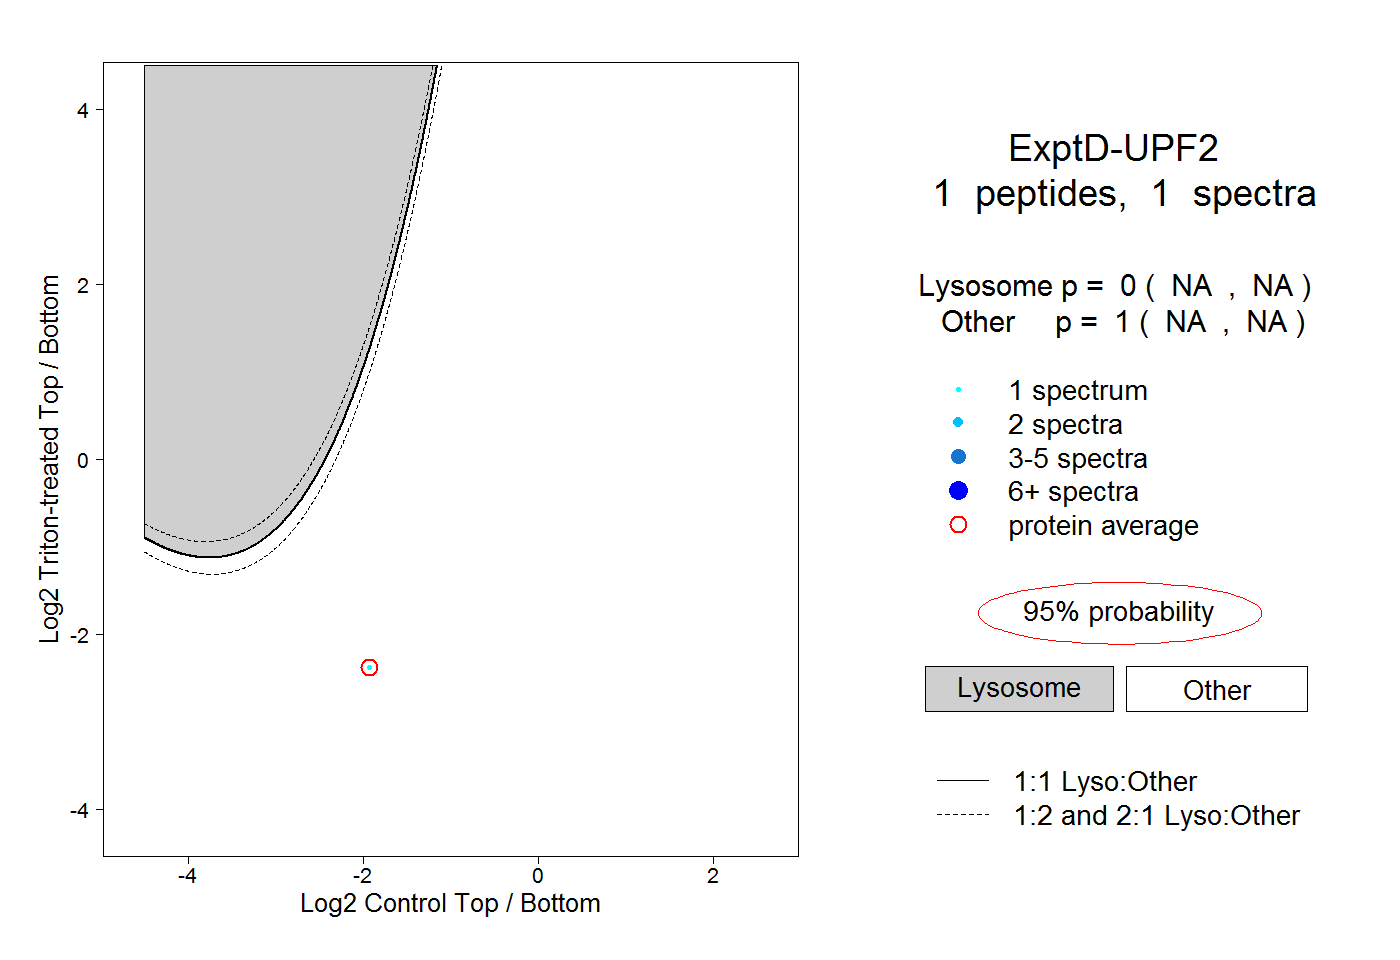 |
0.000 NA | NA |
1.000 NA | NA |