 14
14peptides
spectra
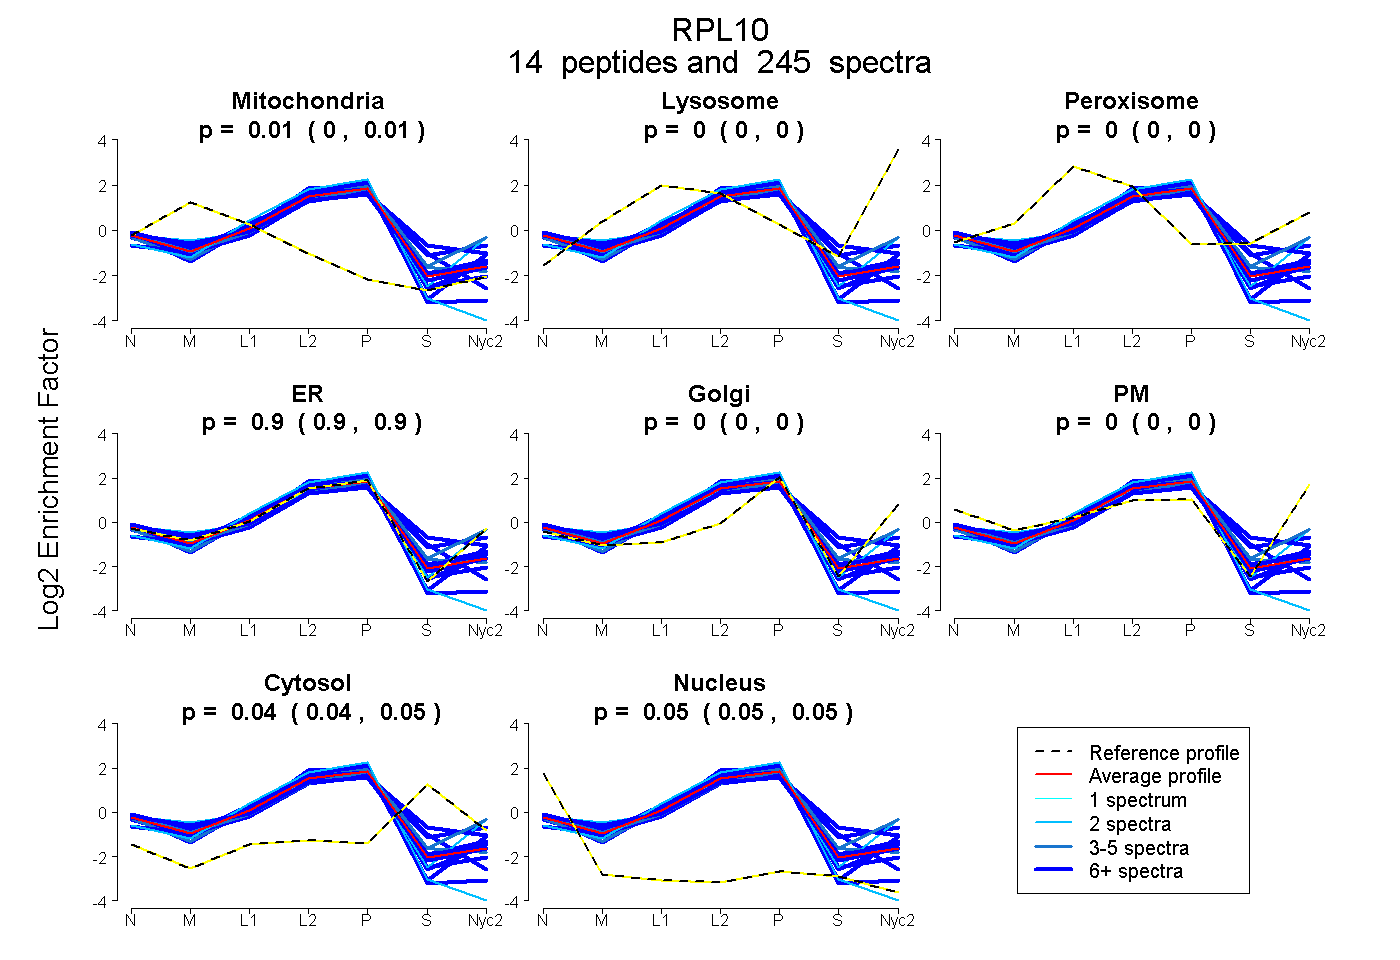
0.003 | 0.007
0.000 | 0.000
0.000 | 0.000
0.900 | 0.904
0.000 | 0.000
0.000 | 0.000
0.039 | 0.048
0.046 | 0.051
12peptides
spectra
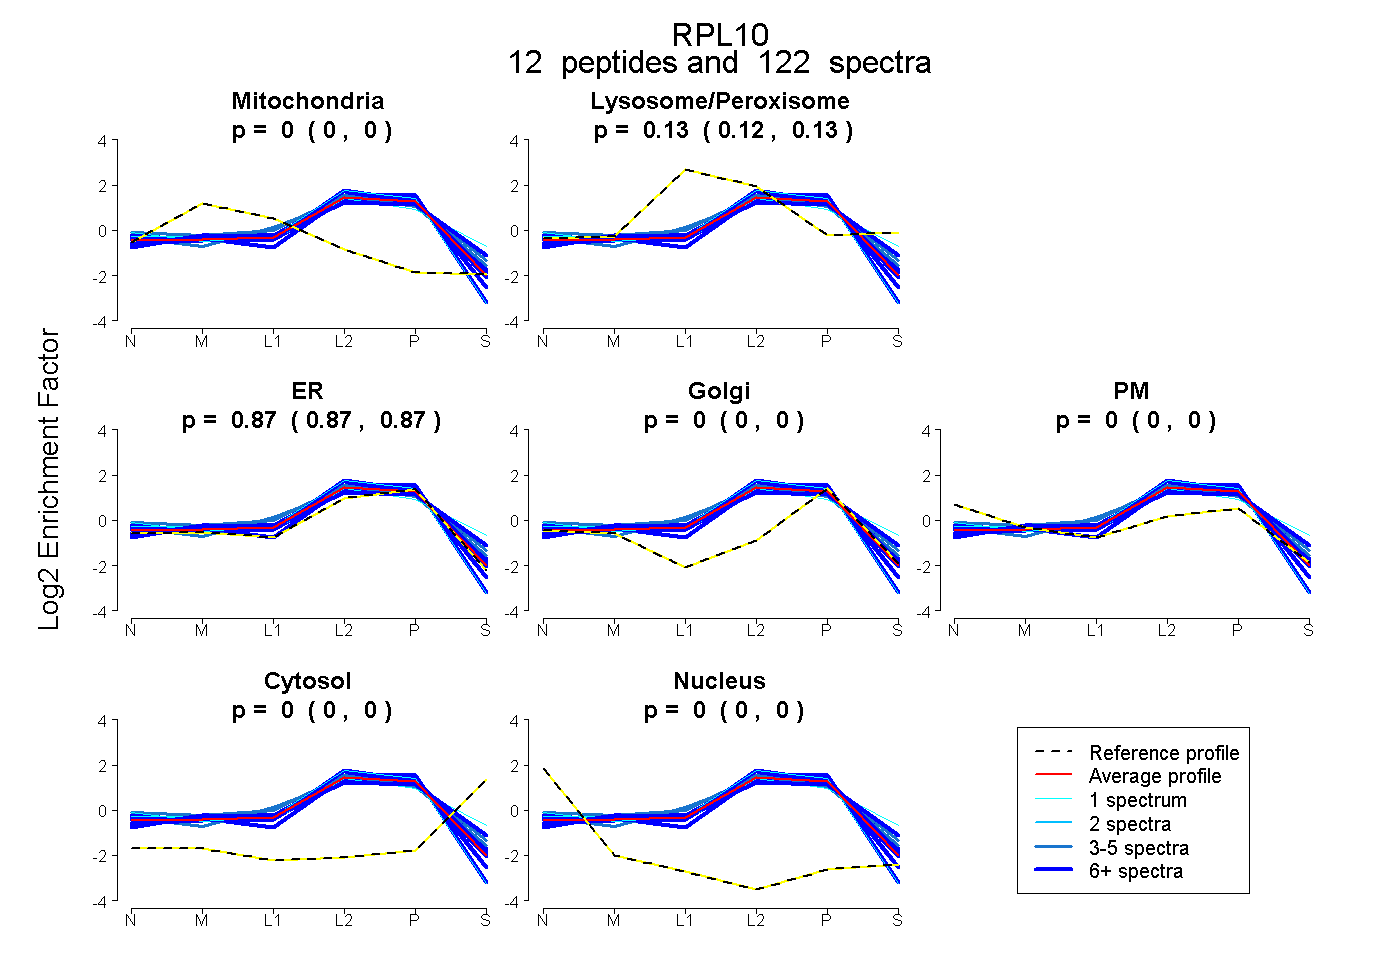
0.000 | 0.000
0.124 | 0.132
0.867 | 0.875
0.000 | 0.000
0.000 | 0.000
0.000 | 0.000
0.000 | 0.000
12peptides
spectra
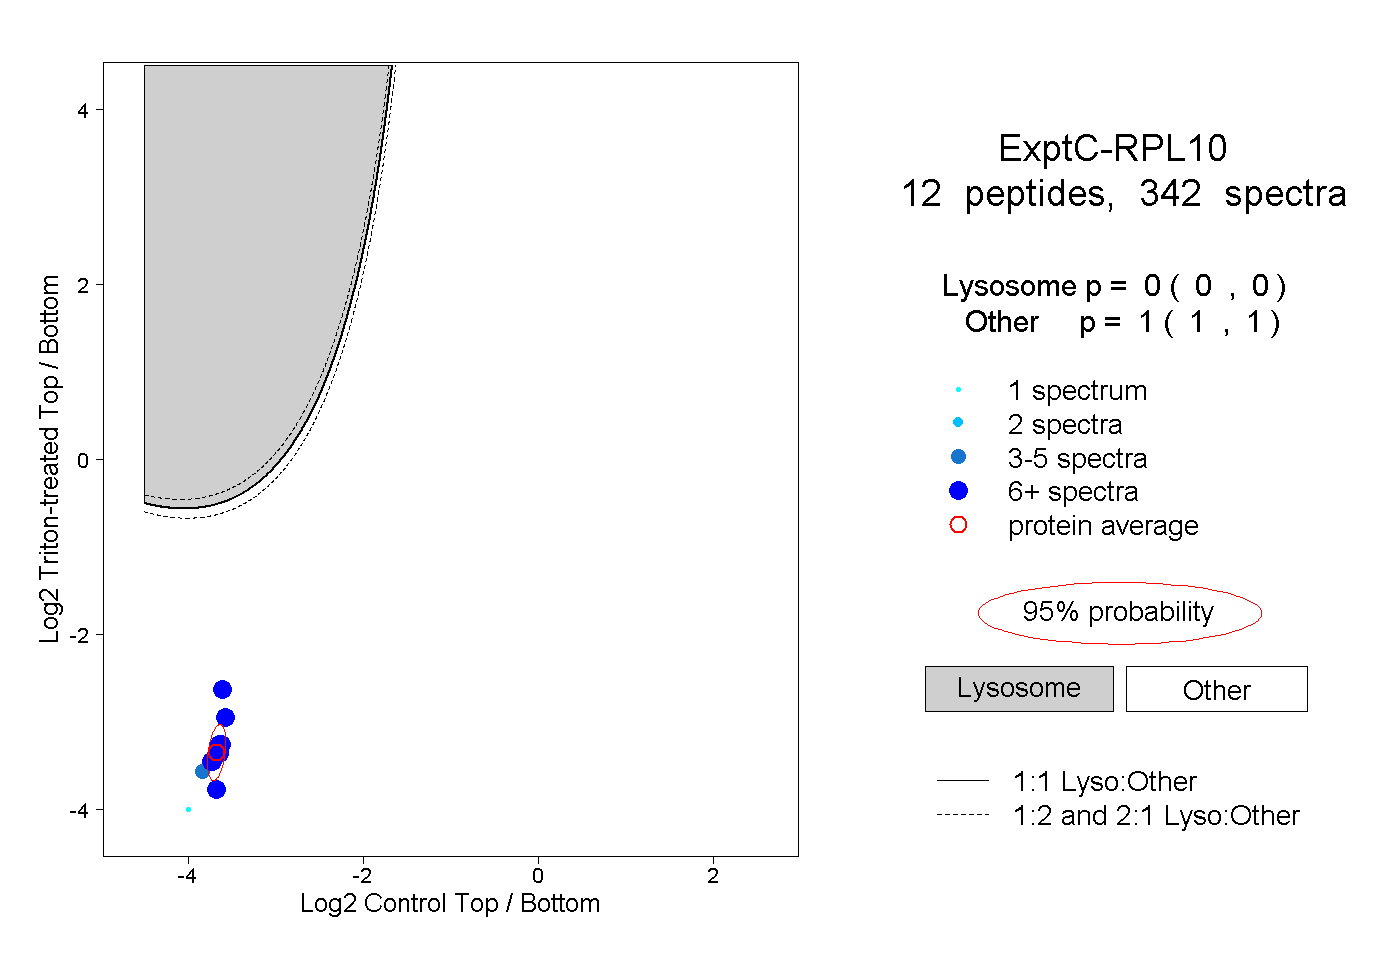
0.000 | 0.000
1.000 | 1.000
8peptides
spectra
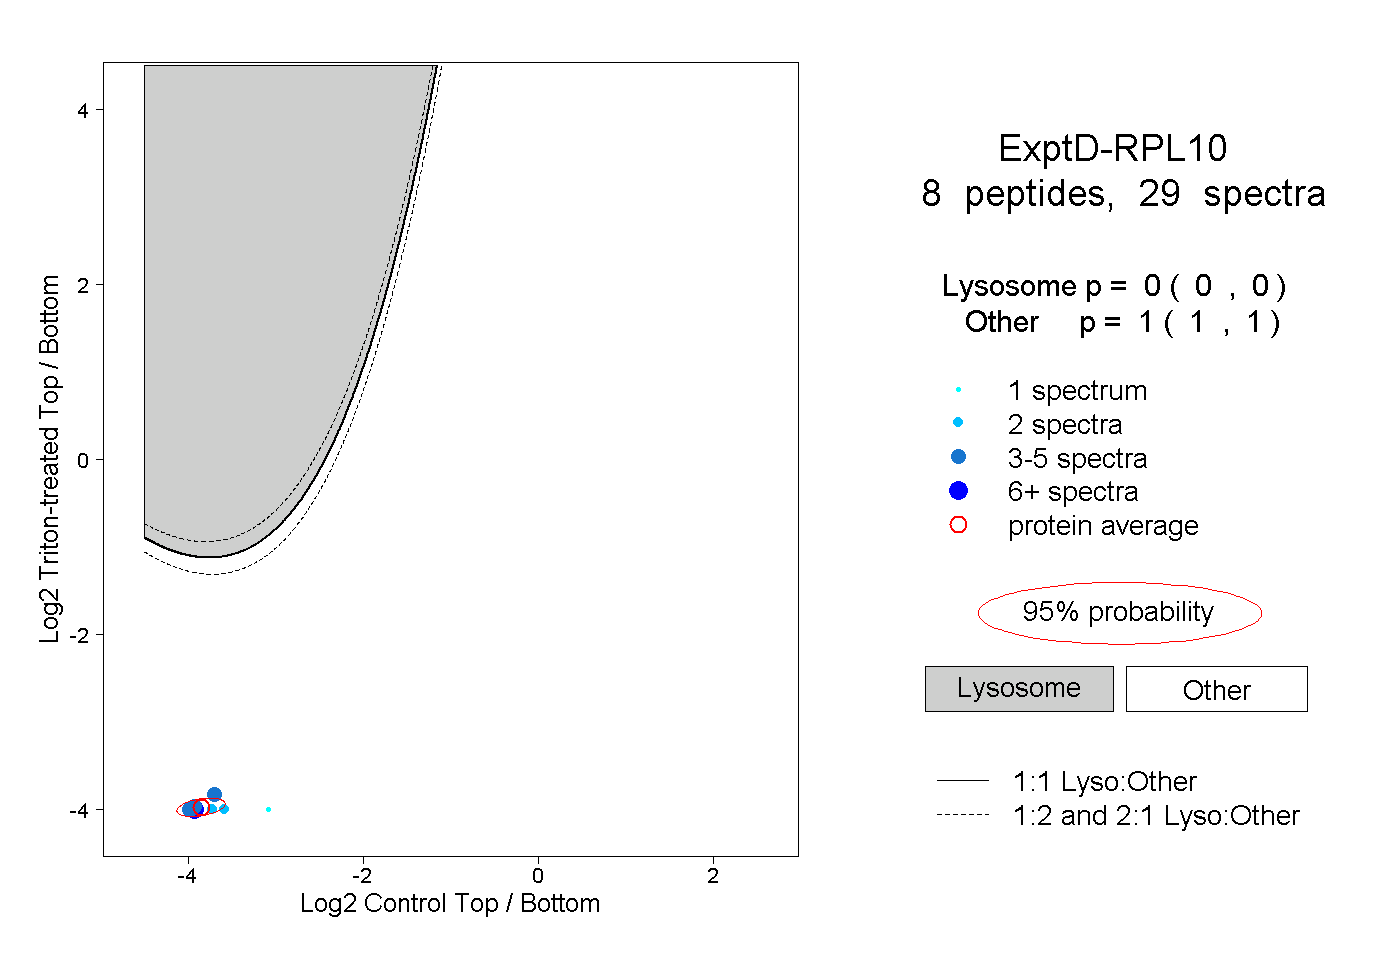
0.000 | 0.000
1.000 | 1.000