RPL10
[ENSRNOP00000053123]
Main page
| | | Plot |
Mito |
Lyso |
|
Perox |
ER |
Golgi |
PM |
Cytosol |
Nucleus |
|
| Expt A |
 14
14
peptides |
245
spectra |
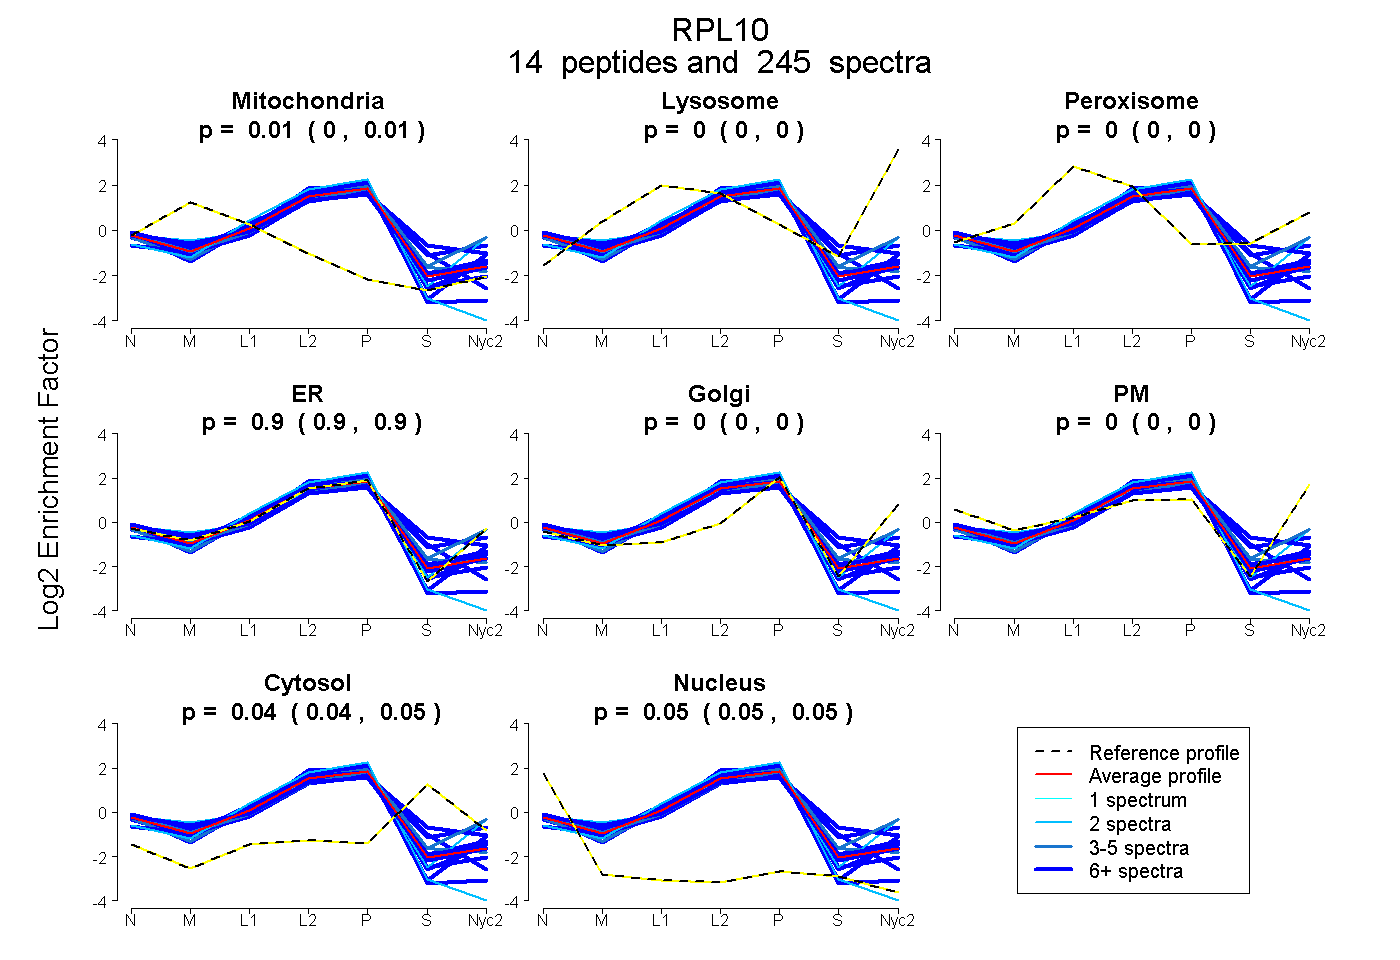 |
0.005
0.003 | 0.007 |
0.000
0.000 | 0.000 |
|
0.000
0.000 | 0.000 |
0.902
0.900 | 0.904 |
0.000
0.000 | 0.000 |
0.000
0.000 | 0.000 |
0.044
0.039 | 0.048 |
0.049
0.046 | 0.051 |
|
| | | Plot |
Mito |
|
Lyso or Perox |
|
ER |
Golgi |
PM |
Cytosol |
Nucleus |
|
| Expt B |
12
peptides |
122
spectra |
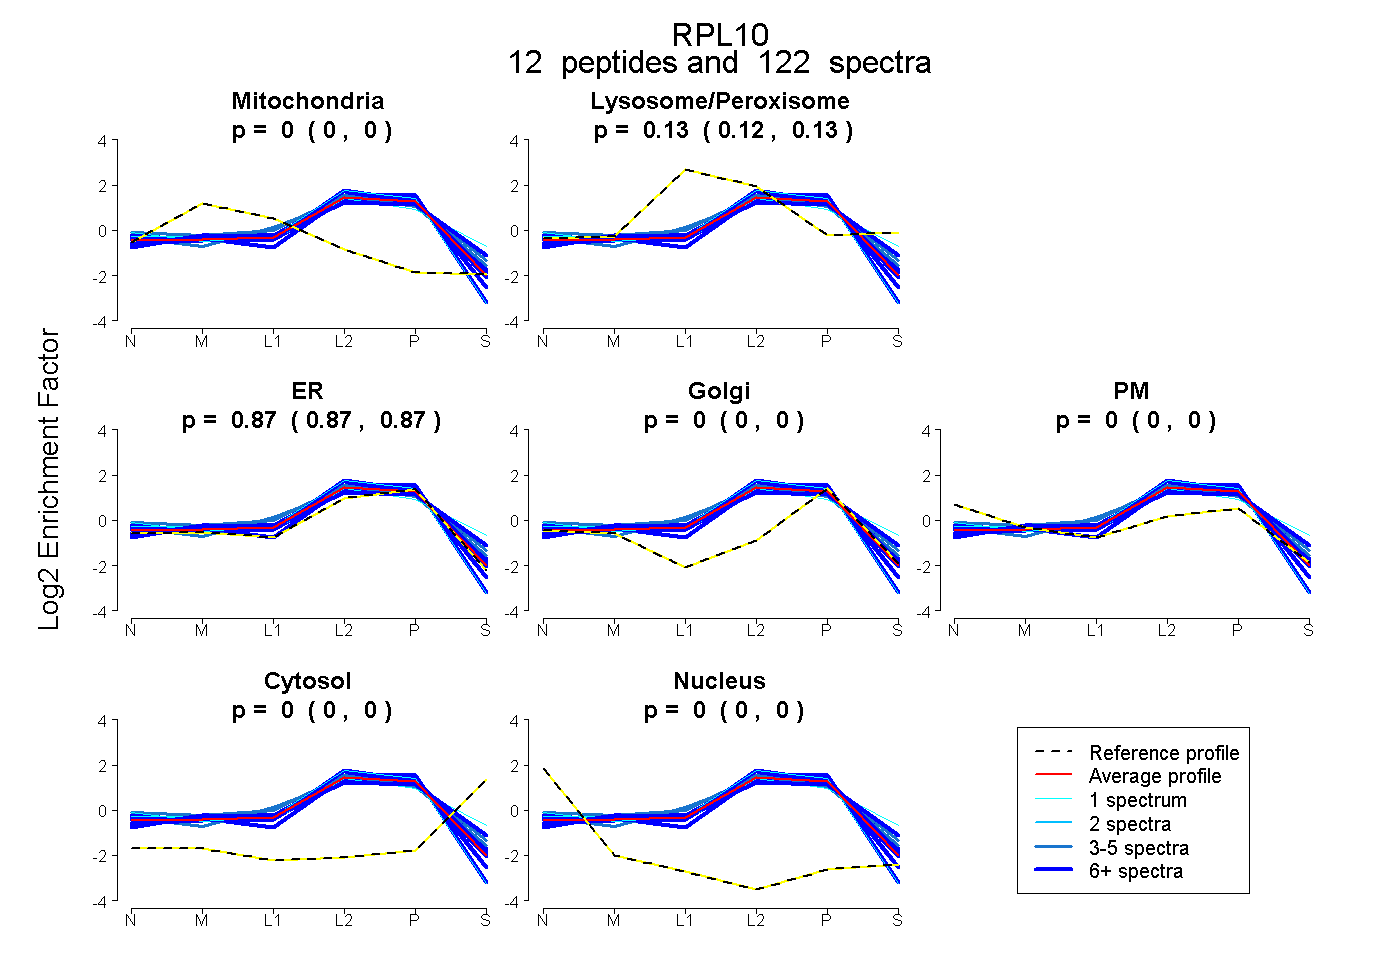 |
0.000
0.000 | 0.000 |
|
0.129
0.124 | 0.132 |
|
0.871
0.867 | 0.875 |
0.000
0.000 | 0.000 |
0.000
0.000 | 0.000 |
0.000
0.000 | 0.000 |
0.000
0.000 | 0.000 |
|
| 11 spectra, MLSCAGADR |
0.000 |
|
0.141 |
|
0.859 |
0.000 |
0.000 |
0.000 |
0.000 |
|
| 12 spectra, DGFHIR |
0.000 |
|
0.123 |
|
0.865 |
0.000 |
0.012 |
0.000 |
0.000 |
|
| 17 spectra, VHIGQVIMSIR |
0.000 |
|
0.220 |
|
0.722 |
0.000 |
0.000 |
0.058 |
0.000 |
|
| 1 spectrum, LQTGMR |
0.000 |
|
0.258 |
|
0.612 |
0.000 |
0.044 |
0.087 |
0.000 |
|
| 3 spectra, LIPDGCGVK |
0.000 |
|
0.254 |
|
0.654 |
0.000 |
0.092 |
0.000 |
0.000 |
|
| 23 spectra, GAFGKPQGTVAR |
0.000 |
|
0.042 |
|
0.958 |
0.000 |
0.000 |
0.000 |
0.000 |
|
| 6 spectra, FNADEFEDMVAEK |
0.000 |
|
0.069 |
|
0.931 |
0.000 |
0.000 |
0.000 |
0.000 |
|
| 18 spectra, LHPFHVIR |
0.000 |
|
0.000 |
|
1.000 |
0.000 |
0.000 |
0.000 |
0.000 |
|
| 12 spectra, EHVIEALR |
0.000 |
|
0.182 |
|
0.818 |
0.000 |
0.000 |
0.000 |
0.000 |
|
| 3 spectra, GVPDAK |
0.000 |
|
0.291 |
|
0.675 |
0.034 |
0.000 |
0.000 |
0.000 |
|
| 15 spectra, IFDLGR |
0.000 |
|
0.063 |
|
0.937 |
0.000 |
0.000 |
0.000 |
0.000 |
|
| 1 spectrum, NKPYPK |
0.000 |
|
0.017 |
|
0.983 |
0.000 |
0.000 |
0.000 |
0.000 |
|
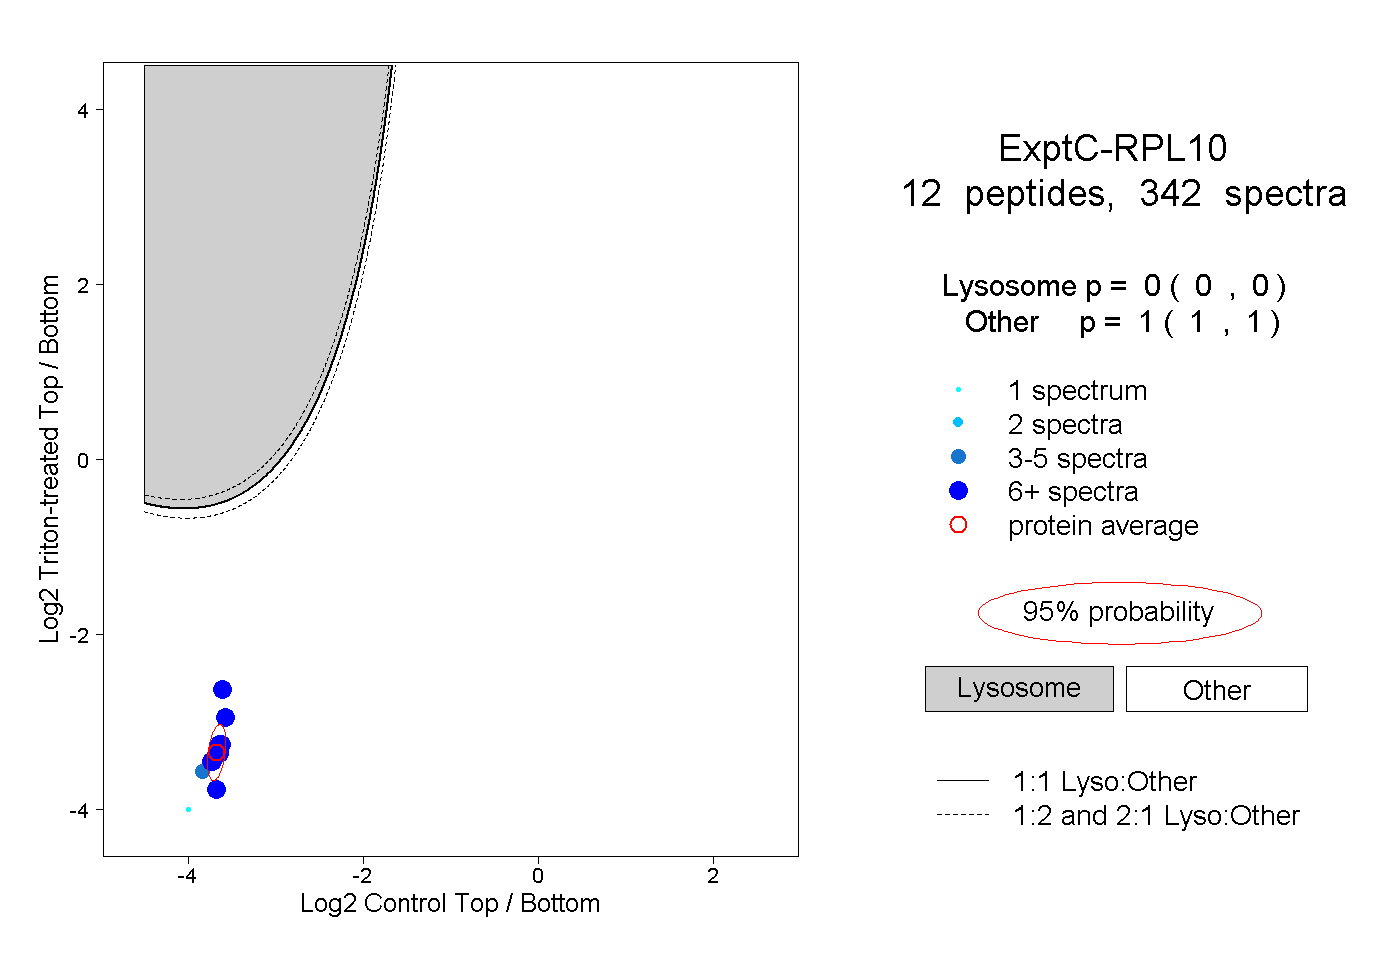
| | | Plot |
|
Lyso |
|
|
|
|
|
|
|
Other |
| Expt C |
12
peptides |
342
spectra |
 |
|
0.000
0.000 | 0.000 |
|
|
|
|
|
|
|
1.000
1.000 | 1.000 |
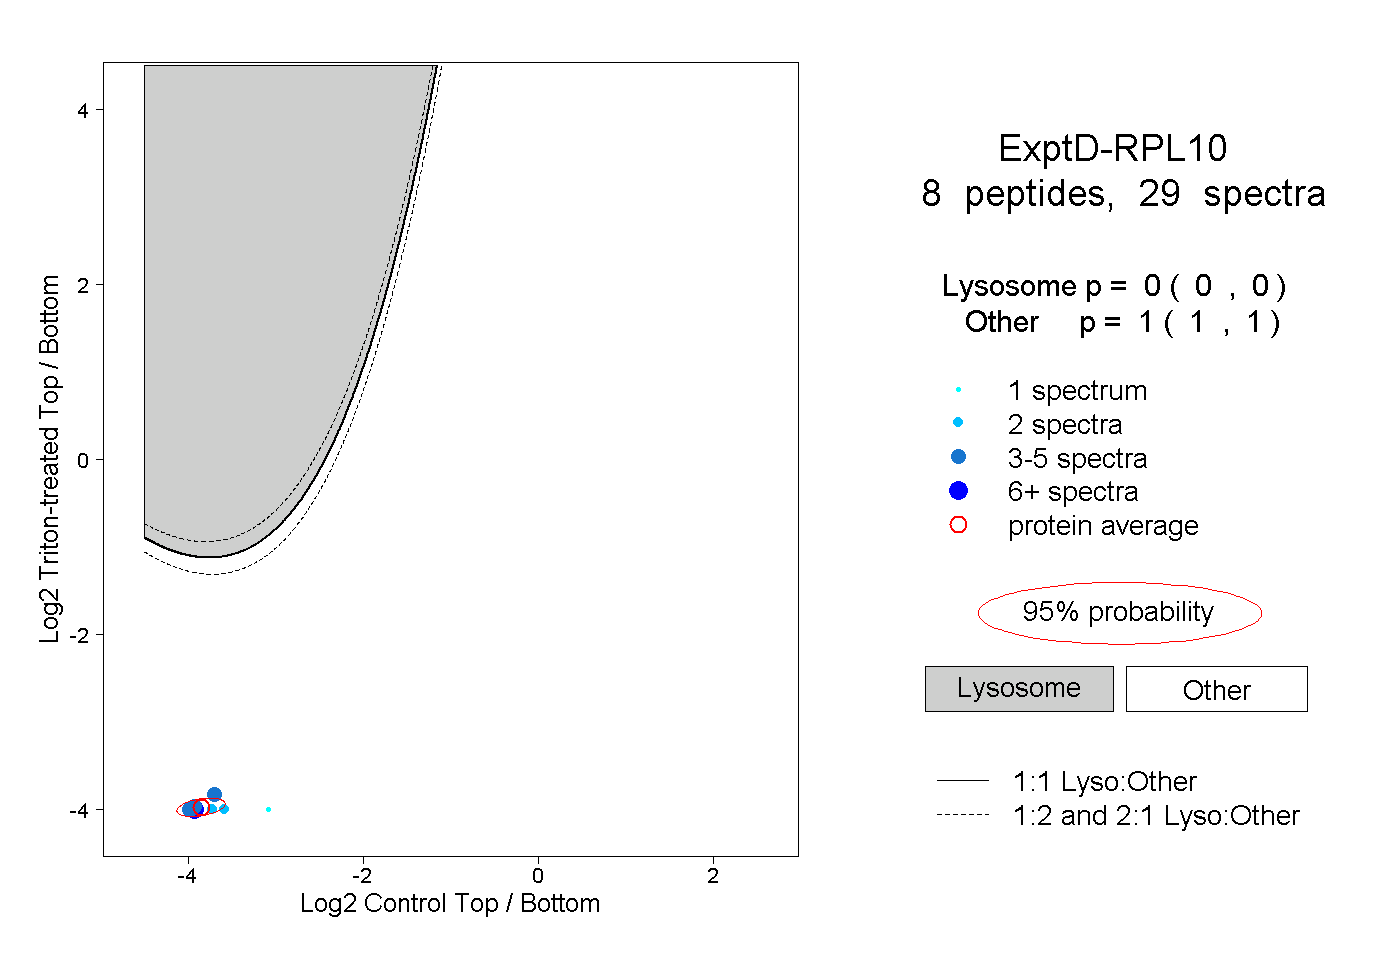
| | | Plot |
|
Lyso |
|
|
|
|
|
|
|
Other |
| Expt D |
8
peptides |
29
spectra |
 |
|
0.000
0.000 | 0.000 |
|
|
|
|
|
|
|
1.000
1.000 | 1.000 |