 14
14peptides
spectra
0.003 | 0.007
0.000 | 0.000
0.000 | 0.000
0.900 | 0.904
0.000 | 0.000
0.000 | 0.000
0.039 | 0.048
0.046 | 0.051
| Plot | Mito | Lyso | Perox | ER | Golgi | PM | Cytosol | Nucleus | |||||
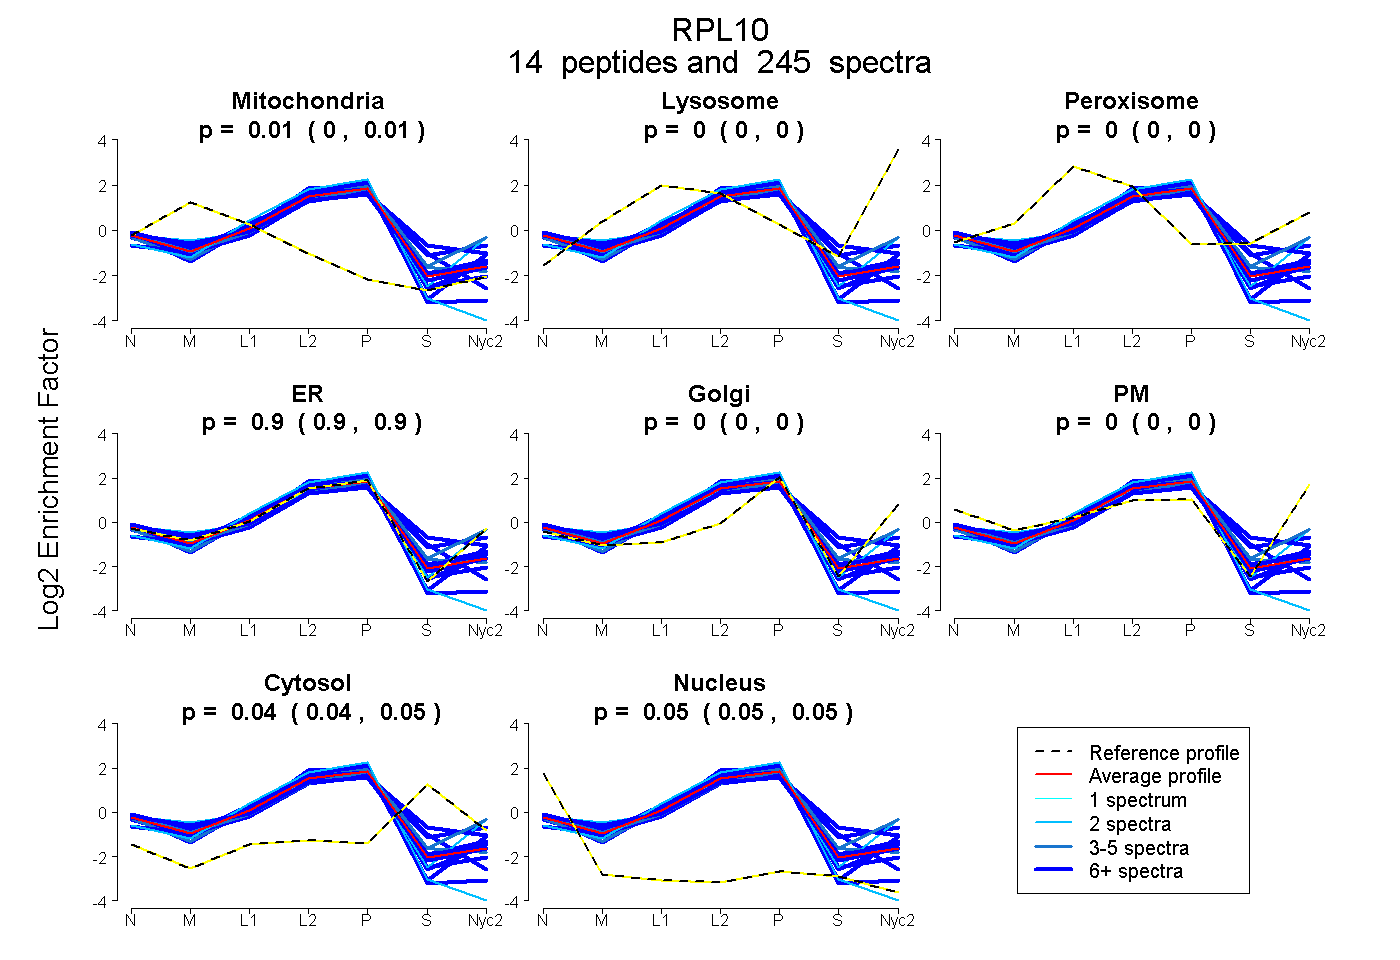
| Expt A |
14 peptides |
245 spectra |
|
0.005 0.003 | 0.007 |
0.000 0.000 | 0.000 |
0.000 0.000 | 0.000 |
0.902 0.900 | 0.904 |
0.000 0.000 | 0.000 |
0.000 0.000 | 0.000 |
0.044 0.039 | 0.048 |
0.049 0.046 | 0.051 |
| 28 spectra, MLSCAGADR | 0.056 | 0.000 | 0.000 | 0.904 | 0.000 | 0.000 | 0.009 | 0.031 | ||
| 25 spectra, DGFHIR | 0.000 | 0.000 | 0.081 | 0.750 | 0.000 | 0.000 | 0.169 | 0.000 | ||
| 49 spectra, VHIGQVIMSIR | 0.086 | 0.000 | 0.000 | 0.834 | 0.000 | 0.000 | 0.060 | 0.020 | ||
| 7 spectra, LQTGMR | 0.000 | 0.000 | 0.038 | 0.703 | 0.000 | 0.000 | 0.259 | 0.000 | ||
| 5 spectra, LIPDGCGVK | 0.000 | 0.000 | 0.000 | 0.864 | 0.000 | 0.000 | 0.115 | 0.020 | ||
| 33 spectra, GAFGKPQGTVAR | 0.000 | 0.000 | 0.000 | 0.913 | 0.000 | 0.000 | 0.000 | 0.087 | ||
| 2 spectra, LHISK | 0.032 | 0.000 | 0.000 | 0.954 | 0.000 | 0.014 | 0.000 | 0.000 | ||
| 2 spectra, VDEFPLCGHMVSDEYEQLSSEALEAAR | 0.000 | 0.000 | 0.000 | 0.877 | 0.000 | 0.000 | 0.000 | 0.123 | ||
| 8 spectra, FNADEFEDMVAEK | 0.000 | 0.000 | 0.000 | 0.752 | 0.000 | 0.000 | 0.201 | 0.048 | ||
| 35 spectra, LHPFHVIR | 0.000 | 0.000 | 0.000 | 0.879 | 0.000 | 0.000 | 0.000 | 0.121 | ||
| 14 spectra, EHVIEALR | 0.000 | 0.000 | 0.015 | 0.885 | 0.000 | 0.000 | 0.076 | 0.024 | ||
| 10 spectra, GVPDAK | 0.027 | 0.000 | 0.000 | 0.926 | 0.000 | 0.000 | 0.000 | 0.047 | ||
| 22 spectra, IFDLGR | 0.000 | 0.000 | 0.000 | 0.976 | 0.000 | 0.000 | 0.000 | 0.024 | ||
| 5 spectra, NKPYPK | 0.000 | 0.000 | 0.021 | 0.856 | 0.000 | 0.000 | 0.123 | 0.000 |
| Plot | Mito | Lyso or Perox | ER | Golgi | PM | Cytosol | Nucleus | ||||||
| Expt B |
12 peptides |
122 spectra |
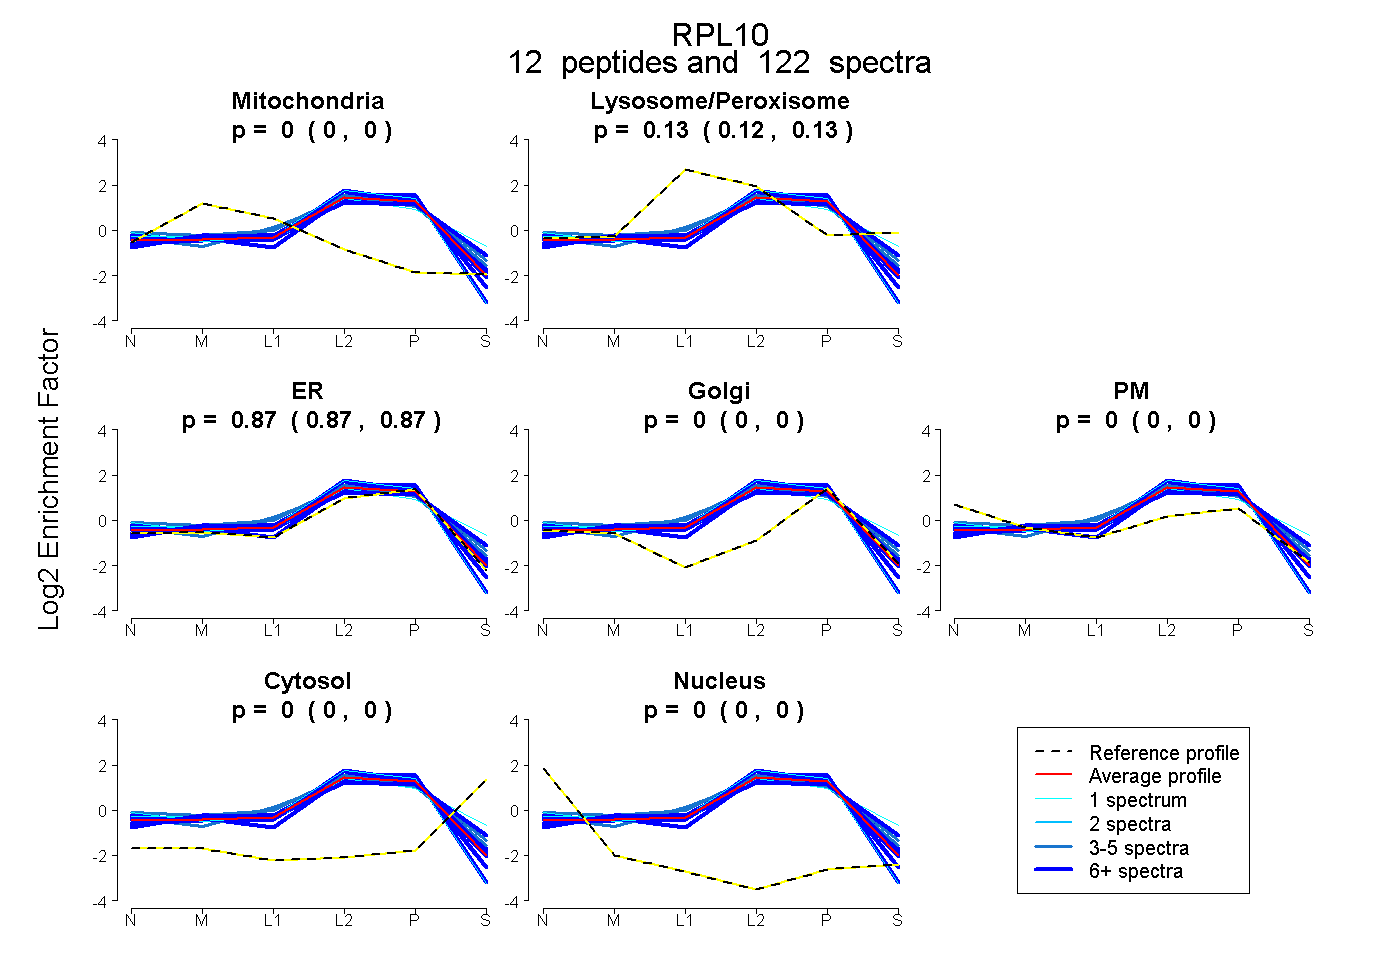 |
0.000 0.000 | 0.000 |
0.129 0.124 | 0.132 |
0.871 0.867 | 0.875 |
0.000 0.000 | 0.000 |
0.000 0.000 | 0.000 |
0.000 0.000 | 0.000 |
0.000 0.000 | 0.000 |
|||
| Plot | Lyso | Other | |||||||||||
| Expt C |
12 peptides |
342 spectra |
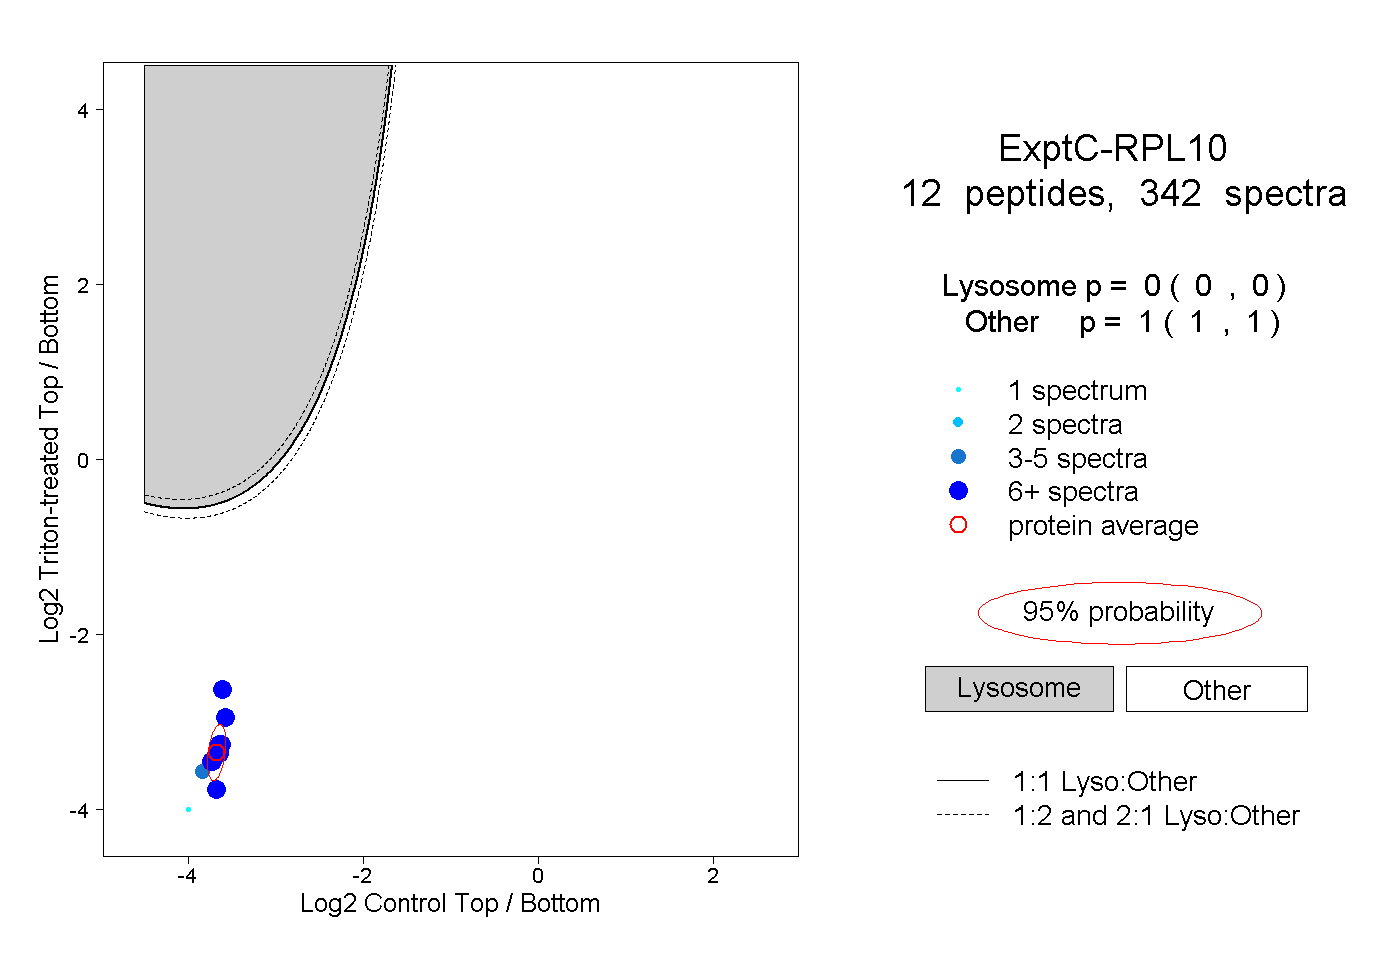 |
0.000 0.000 | 0.000 |
1.000 1.000 | 1.000 |
||||||||
| Plot | Lyso | Other | |||||||||||
| Expt D |
8 peptides |
29 spectra |
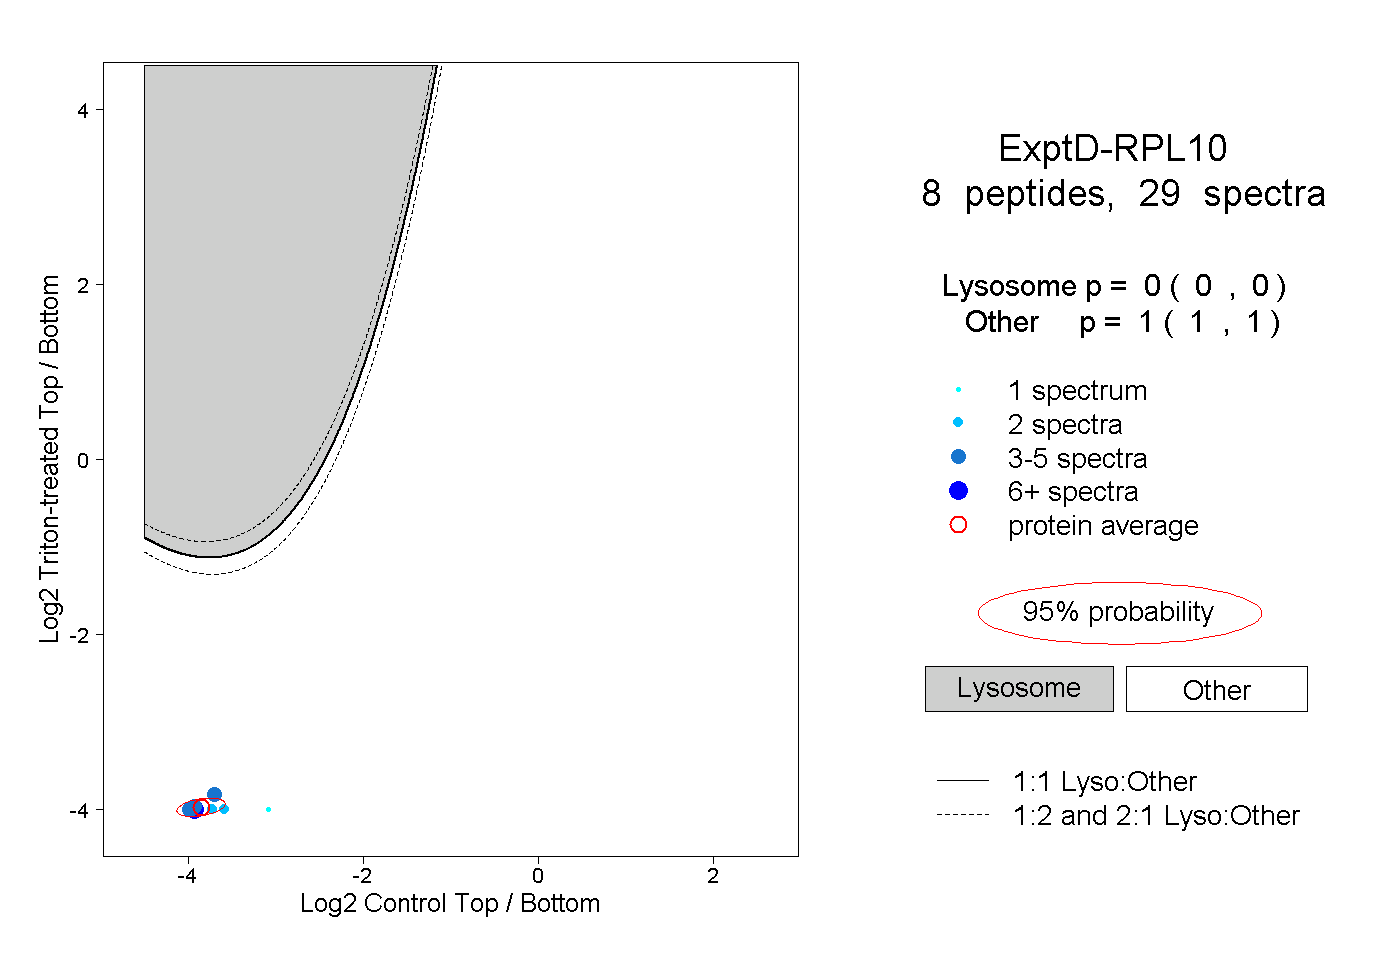 |
0.000 0.000 | 0.000 |
1.000 1.000 | 1.000 |