 58
58peptides
spectra

0.153 | 0.159
0.018 | 0.029
0.000 | 0.000
0.000 | 0.000
0.000 | 0.000
0.275 | 0.287
0.000 | 0.000
0.535 | 0.541
13peptides
spectra
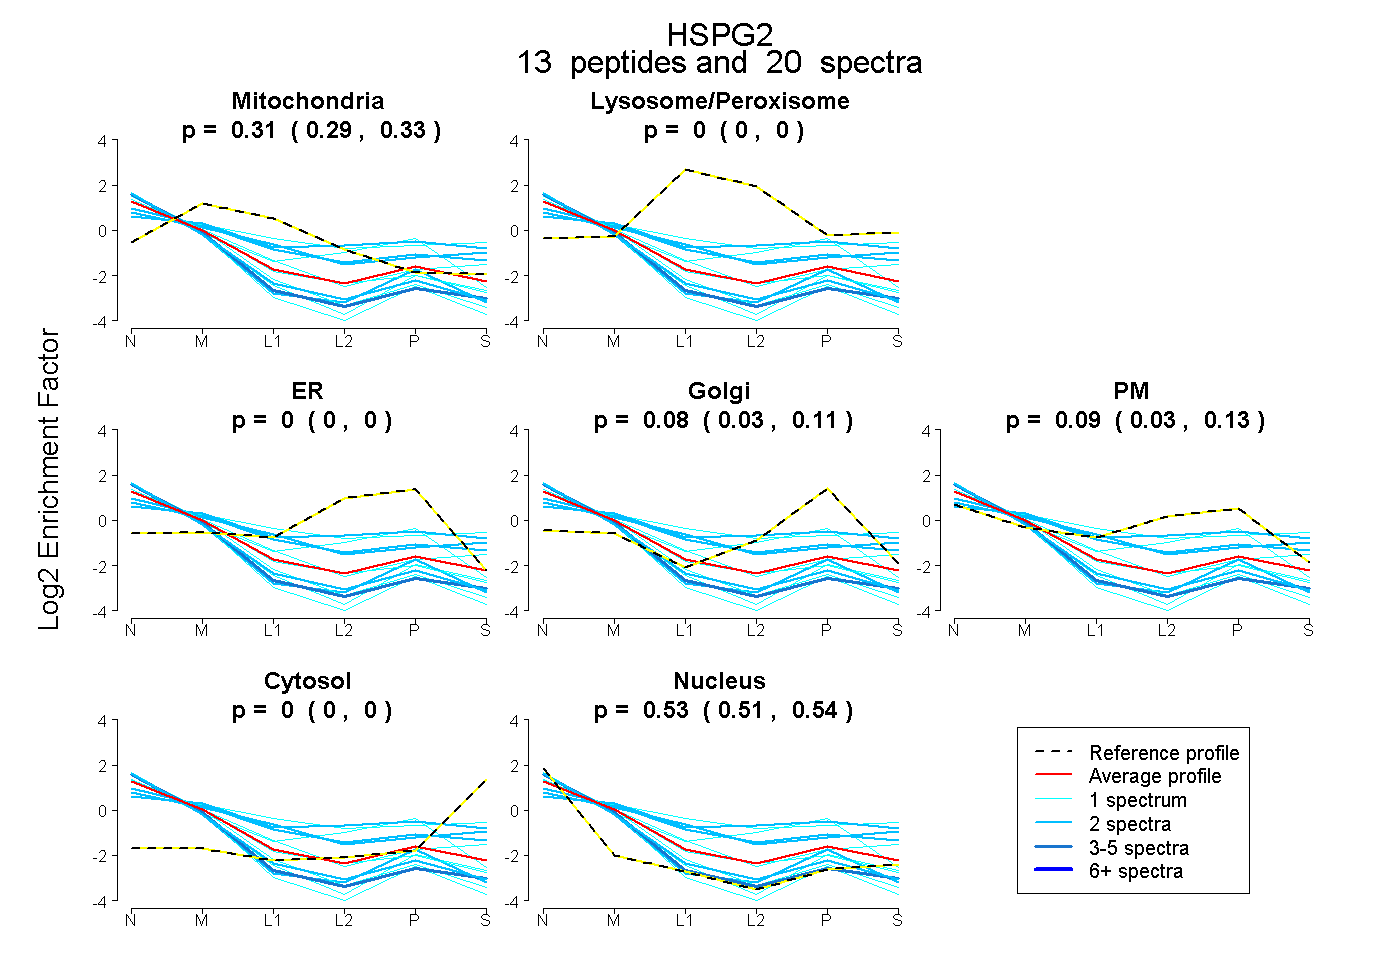
0.291 | 0.331
0.000 | 0.000
0.000 | 0.000
0.030 | 0.112
0.029 | 0.134
0.000 | 0.000
0.506 | 0.541
35peptides
spectra
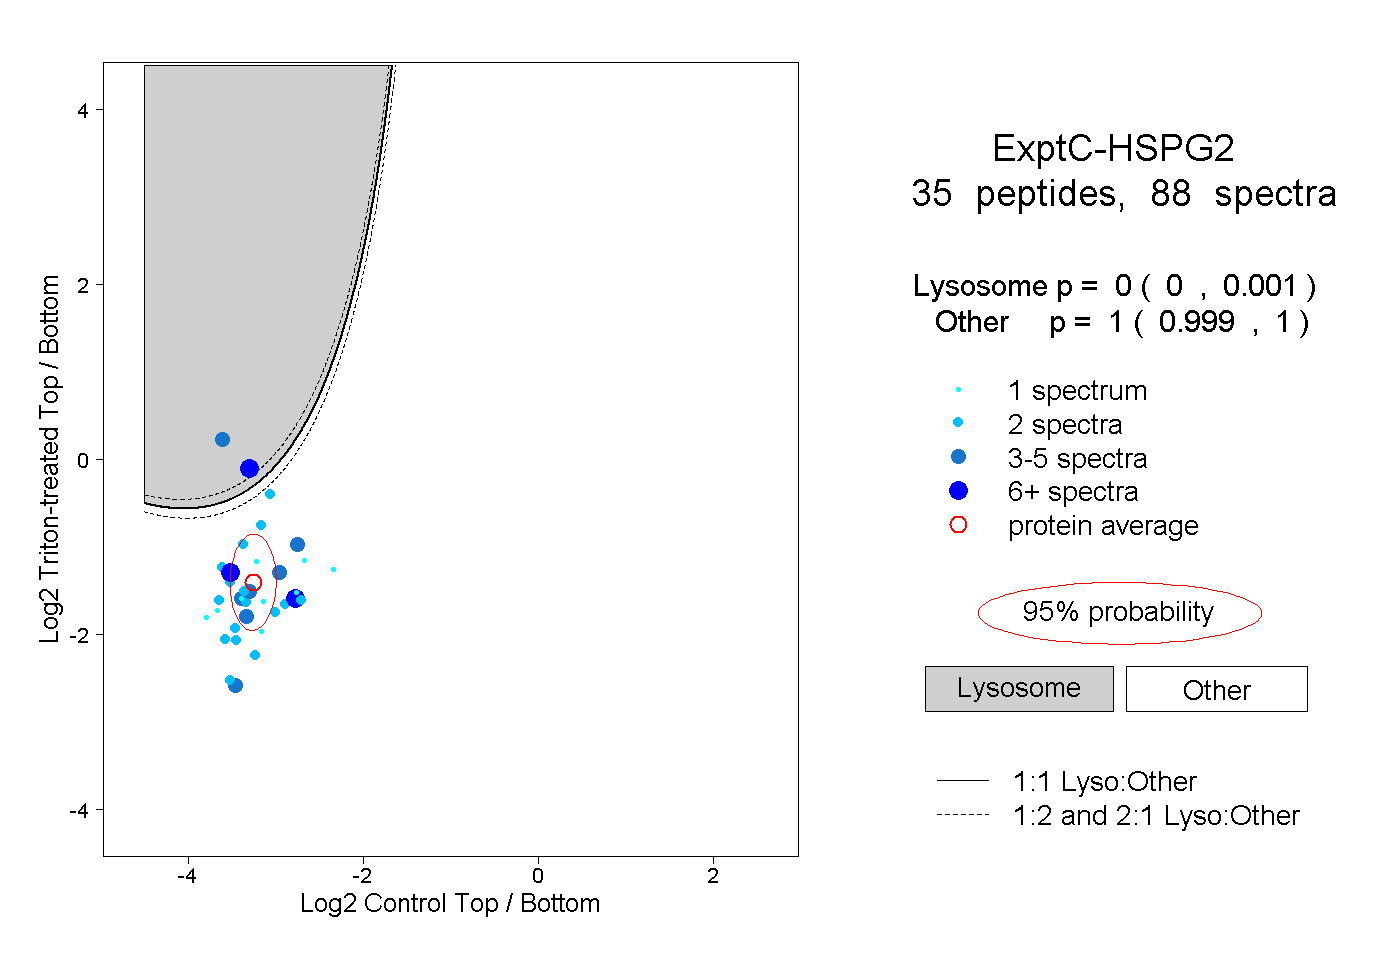
0.000 | 0.001
0.999 | 1.000
3peptides
spectra
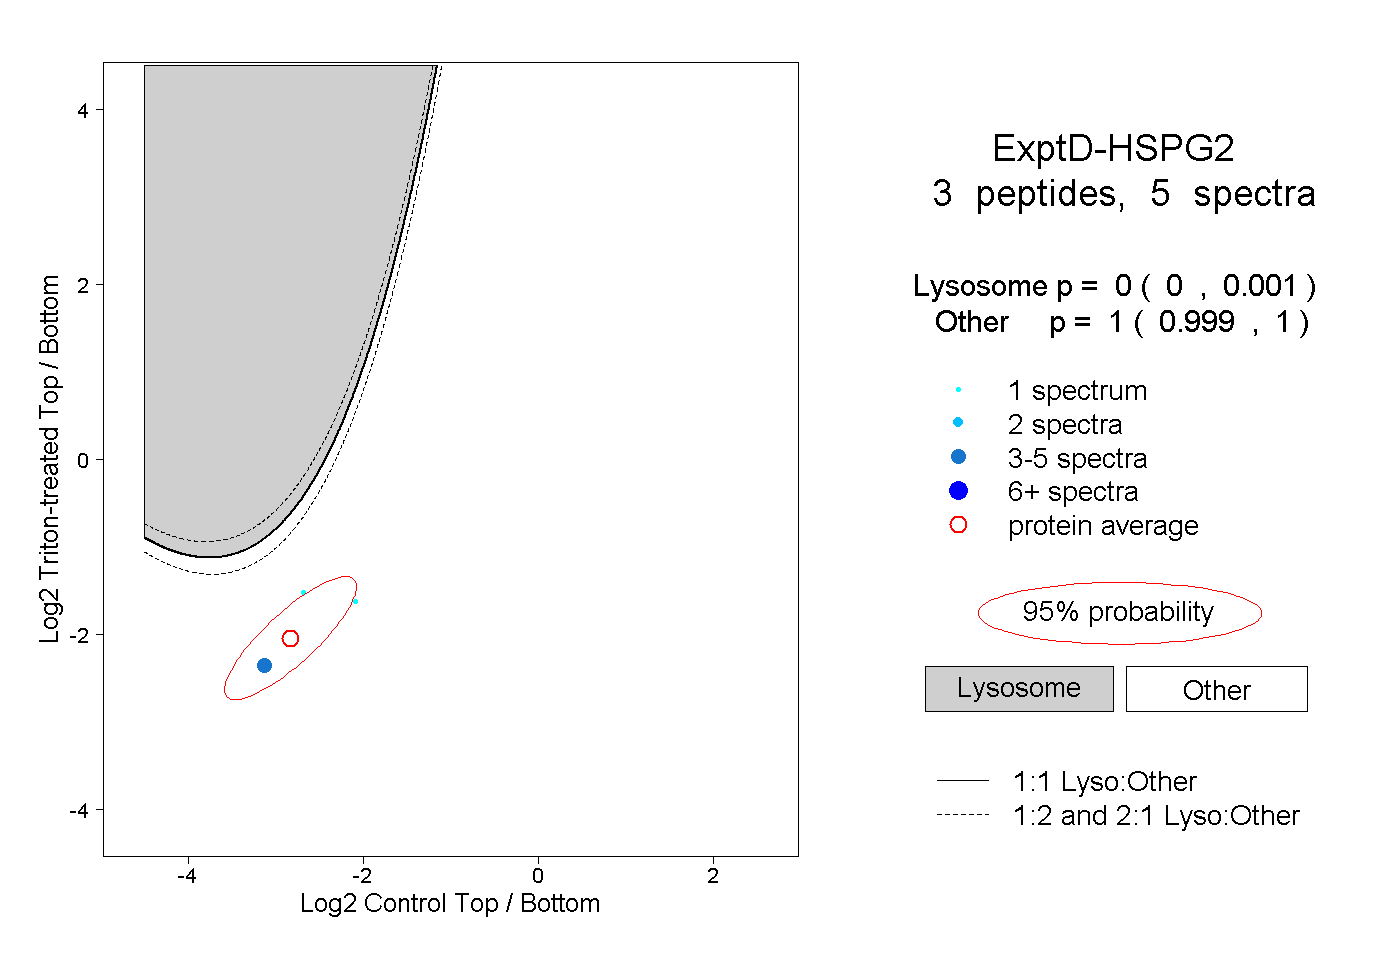
0.000 | 0.001
0.999 | 1.000