 58
58peptides
spectra

0.153 | 0.159
0.018 | 0.029
0.000 | 0.000
0.000 | 0.000
0.000 | 0.000
0.275 | 0.287
0.000 | 0.000
0.535 | 0.541
| Plot | Mito | Lyso | Perox | ER | Golgi | PM | Cytosol | Nucleus | |||||
| Expt A |
58 peptides |
163 spectra |
|
0.156 0.153 | 0.159 |
0.024 0.018 | 0.029 |
0.000 0.000 | 0.000 |
0.000 0.000 | 0.000 |
0.000 0.000 | 0.000 |
0.282 0.275 | 0.287 |
0.000 0.000 | 0.000 |
0.538 0.535 | 0.541 |
| 2 spectra, SPGPNVAVNTK | 0.056 | 0.000 | 0.000 | 0.000 | 0.096 | 0.338 | 0.000 | 0.510 | ||
| 3 spectra, IAHVELADAGQYR | 0.110 | 0.000 | 0.000 | 0.000 | 0.039 | 0.236 | 0.188 | 0.428 | ||
| 2 spectra, AMDFNGILTIR | 0.046 | 0.050 | 0.000 | 0.000 | 0.000 | 0.232 | 0.000 | 0.672 | ||
| 2 spectra, CLCLPGFSGPR | 0.178 | 0.000 | 0.000 | 0.000 | 0.000 | 0.177 | 0.000 | 0.645 | ||
| 1 spectrum, EVSEAVVEK | 0.030 | 0.142 | 0.000 | 0.000 | 0.000 | 0.000 | 0.313 | 0.514 | ||
| 2 spectra, EVEHCTCPPGYR | 0.091 | 0.000 | 0.000 | 0.367 | 0.000 | 0.210 | 0.175 | 0.156 | ||
| 3 spectra, SGIVQSGSVIR | 0.204 | 0.000 | 0.000 | 0.000 | 0.000 | 0.184 | 0.000 | 0.612 | ||
| 1 spectrum, FLVHDAFWALPK | 0.027 | 0.000 | 0.000 | 0.000 | 0.000 | 0.271 | 0.000 | 0.702 | ||
| 2 spectra, TQVHEGR | 0.000 | 0.000 | 0.011 | 0.000 | 0.000 | 0.395 | 0.292 | 0.302 | ||
| 3 spectra, ITVPASEGSSYR | 0.158 | 0.000 | 0.000 | 0.000 | 0.000 | 0.183 | 0.000 | 0.660 | ||
| 6 spectra, SLEPLALGR | 0.211 | 0.000 | 0.000 | 0.000 | 0.000 | 0.148 | 0.000 | 0.641 | ||
| 2 spectra, AFAYLQVPER | 0.219 | 0.050 | 0.000 | 0.000 | 0.000 | 0.000 | 0.184 | 0.547 | ||
| 2 spectra, IEGNTLVIPR | 0.196 | 0.000 | 0.000 | 0.000 | 0.000 | 0.311 | 0.000 | 0.493 | ||
| 2 spectra, EADQGAYTCEAMNSR | 0.116 | 0.000 | 0.015 | 0.000 | 0.000 | 0.469 | 0.156 | 0.244 | ||
| 1 spectrum, QNPDGCLK | 0.293 | 0.000 | 0.000 | 0.000 | 0.000 | 0.113 | 0.000 | 0.593 | ||
| 11 spectra, VTMTSEGGR | 0.074 | 0.000 | 0.000 | 0.000 | 0.000 | 0.469 | 0.000 | 0.457 | ||
| 4 spectra, FDAGSGMATIR | 0.046 | 0.130 | 0.000 | 0.000 | 0.000 | 0.087 | 0.000 | 0.737 | ||
| 2 spectra, NSQLTGGFTVEPVPDGAR | 0.081 | 0.040 | 0.000 | 0.000 | 0.000 | 0.131 | 0.000 | 0.747 | ||
| 3 spectra, QPDFISFGLVGGRPEFR | 0.124 | 0.000 | 0.000 | 0.000 | 0.000 | 0.224 | 0.000 | 0.652 | ||
| 2 spectra, GTLIIR | 0.076 | 0.000 | 0.000 | 0.000 | 0.000 | 0.255 | 0.000 | 0.668 | ||
| 1 spectrum, CFCMGVSR | 0.218 | 0.000 | 0.000 | 0.000 | 0.118 | 0.000 | 0.000 | 0.663 | ||
| 2 spectra, VQVSPER | 0.126 | 0.000 | 0.000 | 0.000 | 0.000 | 0.085 | 0.000 | 0.789 | ||
| 1 spectrum, LSGISMDVAVPENTGQDPAR | 0.194 | 0.071 | 0.000 | 0.000 | 0.000 | 0.000 | 0.000 | 0.735 | ||
| 8 spectra, AMLQVHGGSGPR | 0.106 | 0.000 | 0.031 | 0.000 | 0.000 | 0.455 | 0.106 | 0.302 | ||
| 1 spectrum, LHQMSVADSGEYVCR | 0.021 | 0.000 | 0.000 | 0.000 | 0.000 | 0.608 | 0.318 | 0.052 | ||
| 2 spectra, GCVGEVSVNGK | 0.065 | 0.000 | 0.047 | 0.000 | 0.000 | 0.476 | 0.233 | 0.180 | ||
| 2 spectra, RPDGQPATR | 0.129 | 0.000 | 0.000 | 0.000 | 0.000 | 0.460 | 0.000 | 0.412 | ||
| 3 spectra, GHTPTHPGALNQR | 0.000 | 0.000 | 0.000 | 0.000 | 0.000 | 0.637 | 0.128 | 0.235 | ||
| 7 spectra, LGTVPQFPR | 0.299 | 0.043 | 0.000 | 0.000 | 0.000 | 0.168 | 0.000 | 0.490 | ||
| 2 spectra, DYLCDGQEDCR | 0.216 | 0.000 | 0.000 | 0.000 | 0.000 | 0.011 | 0.000 | 0.773 | ||
| 7 spectra, EGGQLPPGHSVQDGVLR | 0.235 | 0.000 | 0.000 | 0.000 | 0.031 | 0.480 | 0.095 | 0.159 | ||
| 4 spectra, APLPWQHR | 0.146 | 0.007 | 0.000 | 0.000 | 0.000 | 0.366 | 0.000 | 0.481 | ||
| 1 spectrum, GSIQVDGEELVIGR | 0.198 | 0.000 | 0.000 | 0.000 | 0.000 | 0.294 | 0.089 | 0.419 | ||
| 6 spectra, AAGVPSASITWR | 0.270 | 0.115 | 0.000 | 0.000 | 0.000 | 0.089 | 0.000 | 0.527 | ||
| 2 spectra, TCESLGAGGYR | 0.179 | 0.000 | 0.000 | 0.000 | 0.000 | 0.290 | 0.000 | 0.531 | ||
| 2 spectra, HPGEVCGPTQFQCVSTNR | 0.072 | 0.195 | 0.000 | 0.000 | 0.000 | 0.000 | 0.000 | 0.733 | ||
| 3 spectra, LETEYVK | 0.017 | 0.125 | 0.000 | 0.000 | 0.000 | 0.425 | 0.000 | 0.432 | ||
| 3 spectra, AQIHNGILR | 0.043 | 0.000 | 0.000 | 0.000 | 0.000 | 0.427 | 0.243 | 0.287 | ||
| 2 spectra, EDGRPLPSGAQQR | 0.093 | 0.000 | 0.000 | 0.000 | 0.000 | 0.313 | 0.000 | 0.594 | ||
| 1 spectrum, SIEYSPQLEDANAK | 0.296 | 0.000 | 0.000 | 0.000 | 0.000 | 0.390 | 0.245 | 0.068 | ||
| 3 spectra, EGGSLPPQAR | 0.146 | 0.000 | 0.000 | 0.000 | 0.000 | 0.267 | 0.167 | 0.419 | ||
| 4 spectra, GPSCQDCDTGYTR | 0.231 | 0.000 | 0.000 | 0.000 | 0.000 | 0.000 | 0.000 | 0.769 | ||
| 1 spectrum, AHSVEECR | 0.184 | 0.000 | 0.000 | 0.000 | 0.000 | 0.029 | 0.000 | 0.787 | ||
| 4 spectra, IPGDQIVSVVFIK | 0.047 | 0.229 | 0.000 | 0.000 | 0.000 | 0.000 | 0.000 | 0.724 | ||
| 2 spectra, AQAGANTRPCPS | 0.057 | 0.000 | 0.000 | 0.000 | 0.000 | 0.281 | 0.000 | 0.663 | ||
| 2 spectra, DGSLQVDGGRPVLR | 0.296 | 0.000 | 0.000 | 0.000 | 0.000 | 0.274 | 0.000 | 0.430 | ||
| 2 spectra, VGGILPEK | 0.000 | 0.179 | 0.000 | 0.000 | 0.000 | 0.326 | 0.000 | 0.495 | ||
| 4 spectra, VDGDLPPDSR | 0.222 | 0.000 | 0.000 | 0.000 | 0.000 | 0.278 | 0.029 | 0.470 | ||
| 2 spectra, AGLSSGFVGCVR | 0.178 | 0.000 | 0.000 | 0.196 | 0.000 | 0.000 | 0.092 | 0.534 | ||
| 1 spectrum, GVGQCYDSSPCER | 0.252 | 0.000 | 0.000 | 0.000 | 0.000 | 0.000 | 0.000 | 0.748 | ||
| 4 spectra, ATFSSVPR | 0.209 | 0.000 | 0.000 | 0.000 | 0.000 | 0.217 | 0.000 | 0.573 | ||
| 1 spectrum, CQPLTK | 0.067 | 0.000 | 0.000 | 0.000 | 0.000 | 0.461 | 0.000 | 0.472 | ||
| 2 spectra, AQVEGR | 0.167 | 0.227 | 0.000 | 0.000 | 0.000 | 0.066 | 0.000 | 0.540 | ||
| 4 spectra, GSLSATGEACR | 0.203 | 0.000 | 0.000 | 0.000 | 0.000 | 0.057 | 0.000 | 0.740 | ||
| 1 spectrum, MFGLMNSHAMLK | 0.233 | 0.000 | 0.008 | 0.000 | 0.000 | 0.604 | 0.016 | 0.139 | ||
| 2 spectra, SGPVEDFVSLAMVGGHLEFR | 0.187 | 0.253 | 0.000 | 0.000 | 0.000 | 0.090 | 0.000 | 0.471 | ||
| 2 spectra, CQVSNK | 0.135 | 0.009 | 0.000 | 0.000 | 0.000 | 0.306 | 0.000 | 0.549 | ||
| 6 spectra, SPAYTLVWTR | 0.134 | 0.100 | 0.000 | 0.000 | 0.000 | 0.085 | 0.000 | 0.681 |
| Plot | Mito | Lyso or Perox | ER | Golgi | PM | Cytosol | Nucleus | ||||||
| Expt B |
13 peptides |
20 spectra |
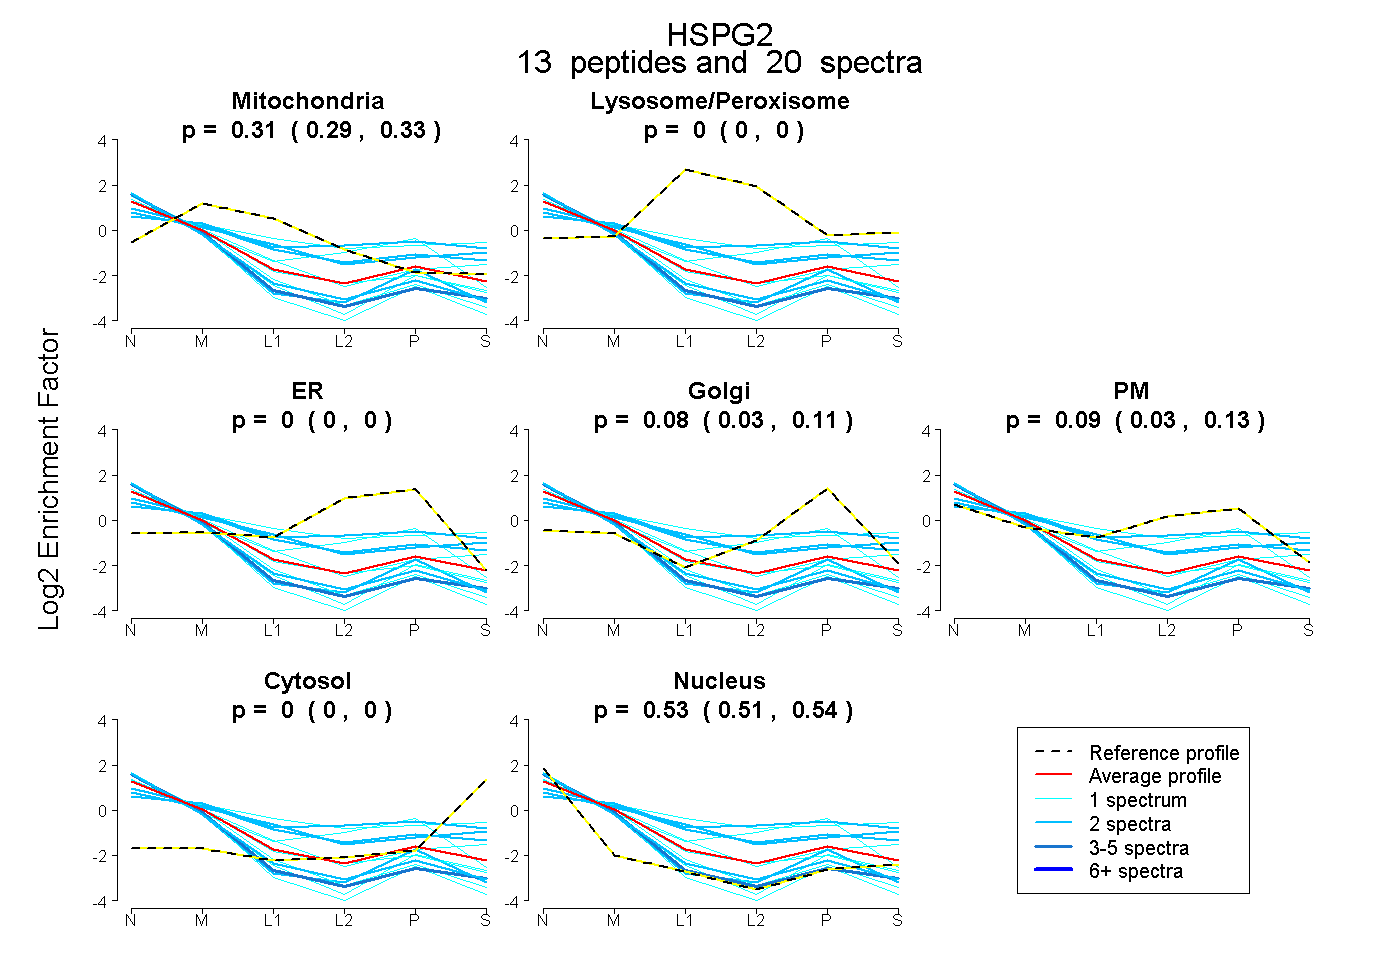 |
0.313 0.291 | 0.331 |
0.000 0.000 | 0.000 |
0.000 0.000 | 0.000 |
0.076 0.030 | 0.112 |
0.086 0.029 | 0.134 |
0.000 0.000 | 0.000 |
0.525 0.506 | 0.541 |
|||
| Plot | Lyso | Other | |||||||||||
| Expt C |
35 peptides |
88 spectra |
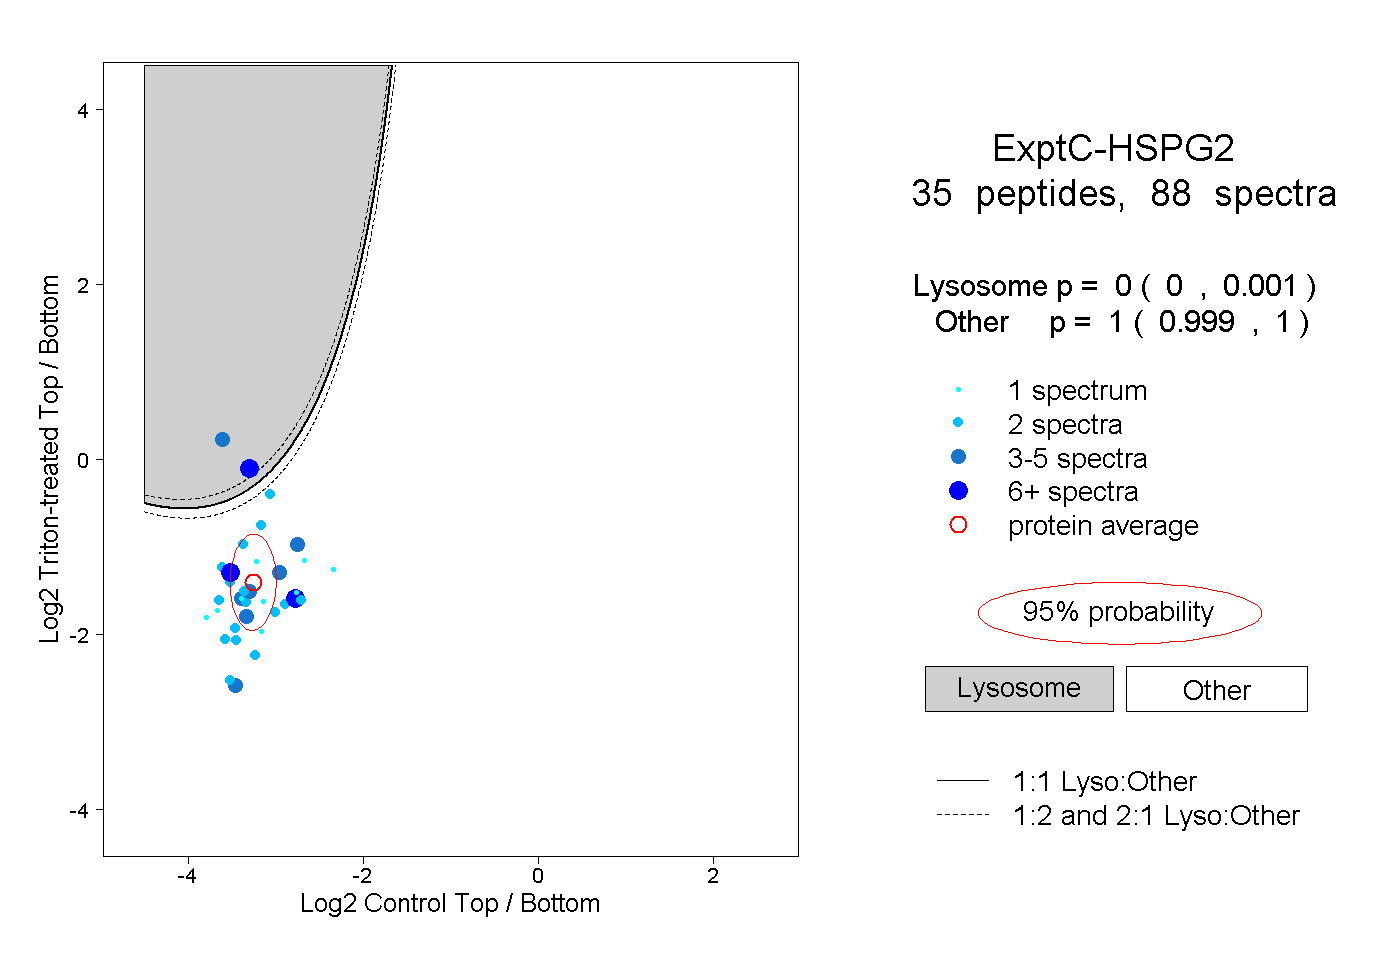 |
0.000 0.000 | 0.001 |
1.000 0.999 | 1.000 |
||||||||
| Plot | Lyso | Other | |||||||||||
| Expt D |
3 peptides |
5 spectra |
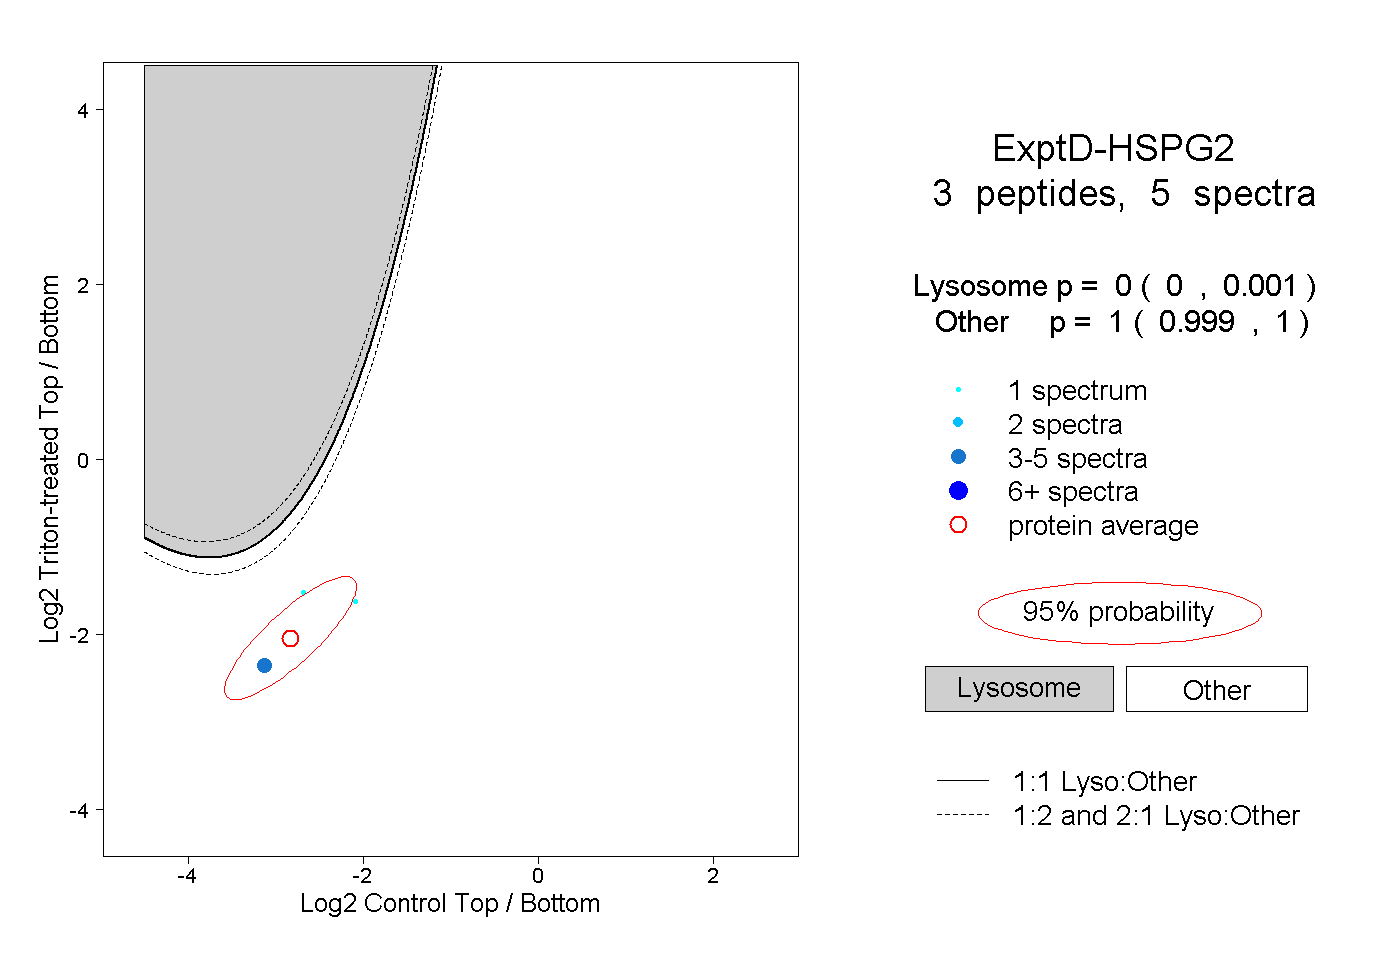 |
0.000 0.000 | 0.001 |
1.000 0.999 | 1.000 |