 11
11peptides
spectra
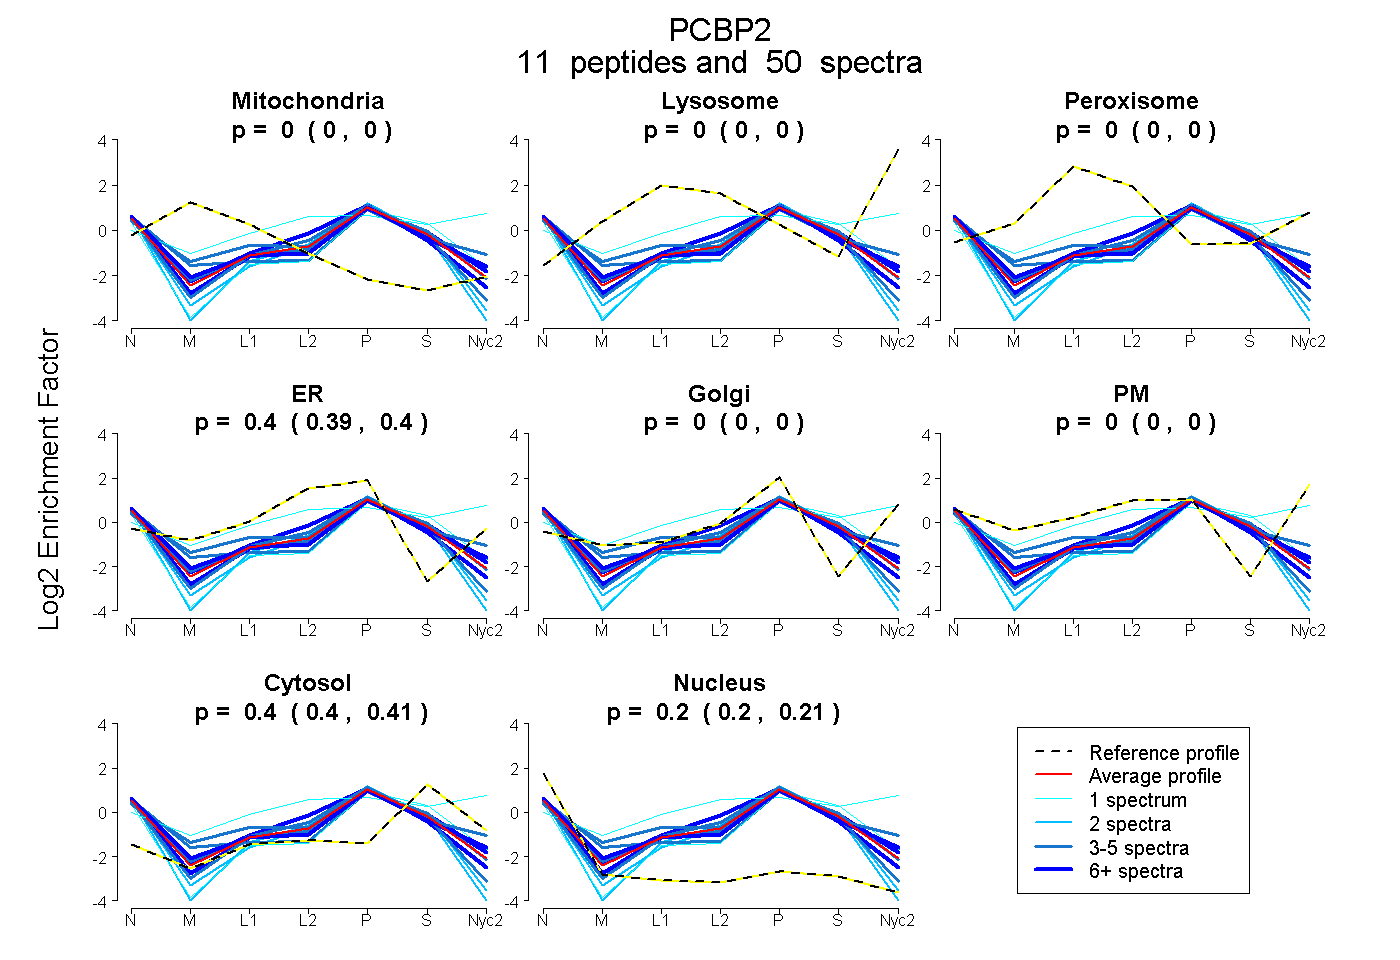
0.000 | 0.000
0.000 | 0.000
0.000 | 0.000
0.390 | 0.399
0.000 | 0.000
0.000 | 0.000
0.397 | 0.406
0.197 | 0.208
8peptides
spectra
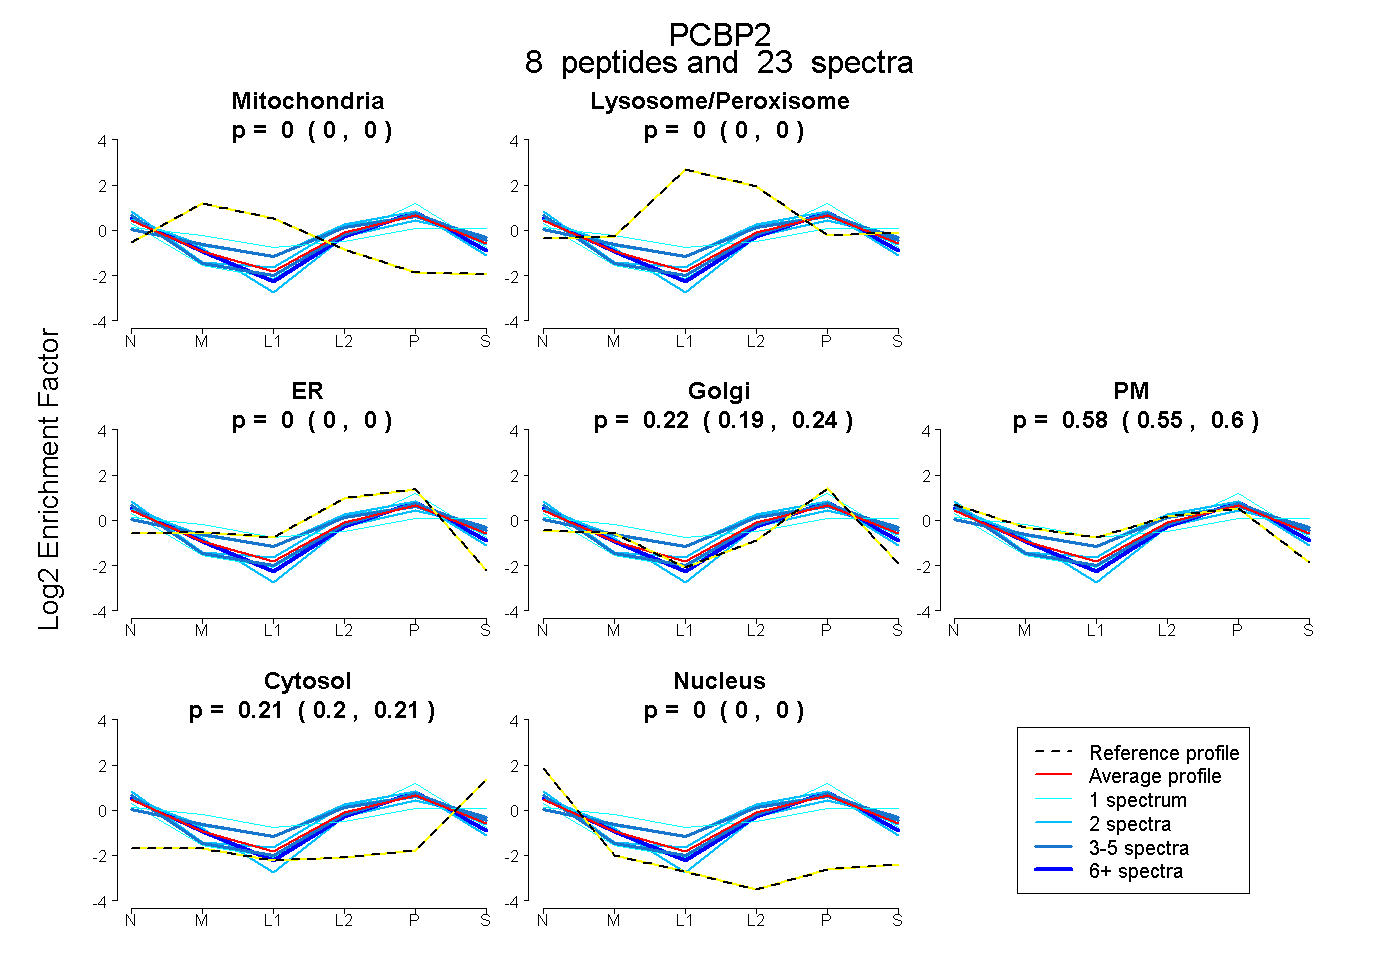
0.000 | 0.000
0.000 | 0.000
0.000 | 0.000
0.187 | 0.241
0.549 | 0.599
0.198 | 0.214
0.000 | 0.000
7peptides
spectra
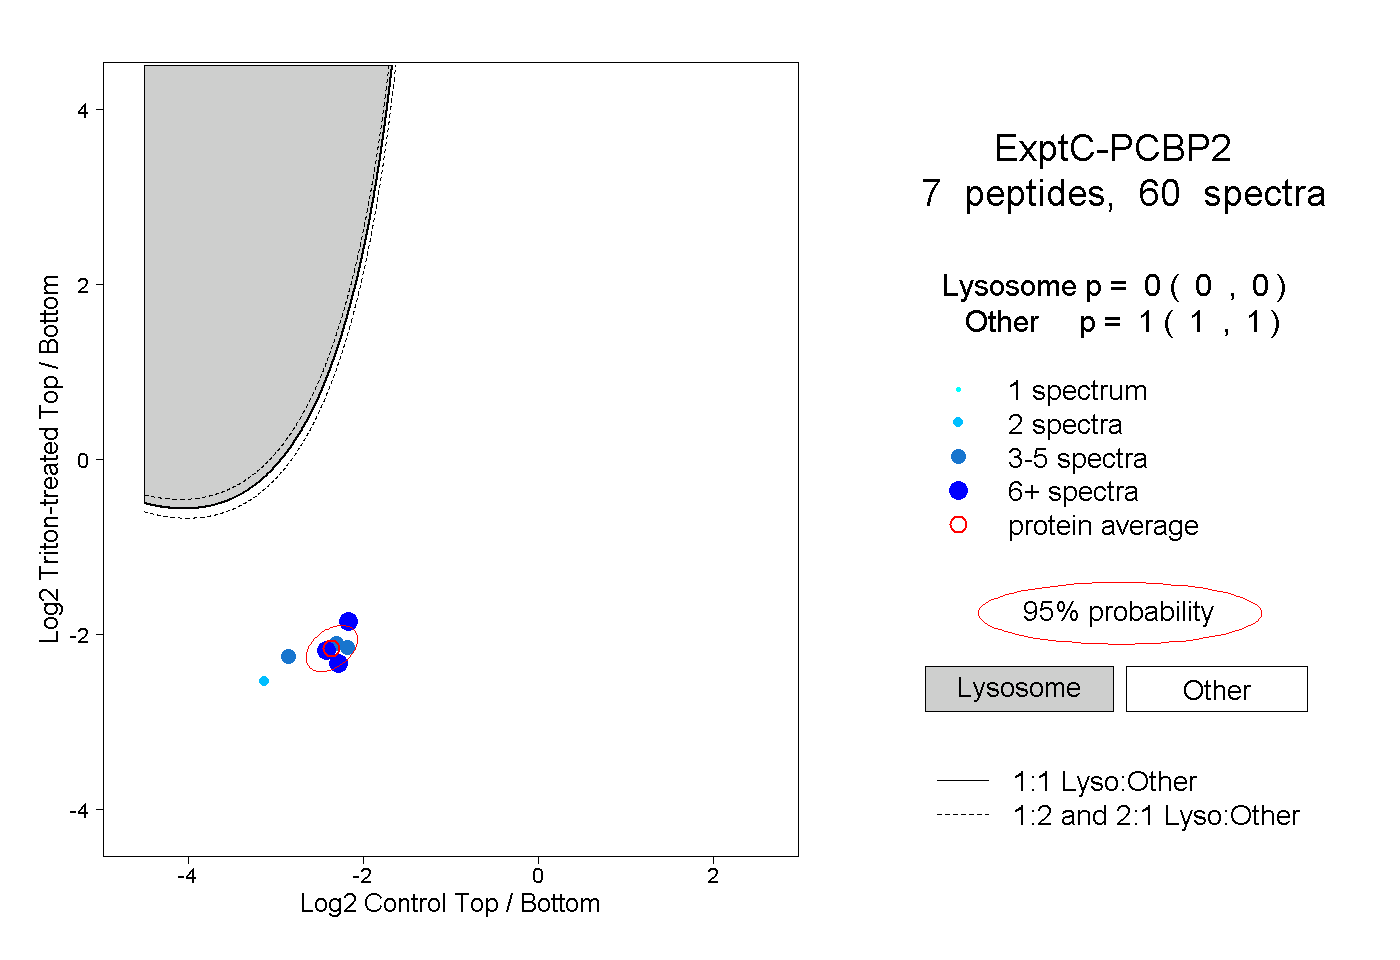
0.000 | 0.000
1.000 | 1.000
4peptides
spectra

0.000 | 0.000
1.000 | 1.000