 11
11peptides
spectra
0.000 | 0.000
0.000 | 0.000
0.000 | 0.000
0.390 | 0.399
0.000 | 0.000
0.000 | 0.000
0.397 | 0.406
0.197 | 0.208
| Plot | Mito | Lyso | Perox | ER | Golgi | PM | Cytosol | Nucleus | |||||
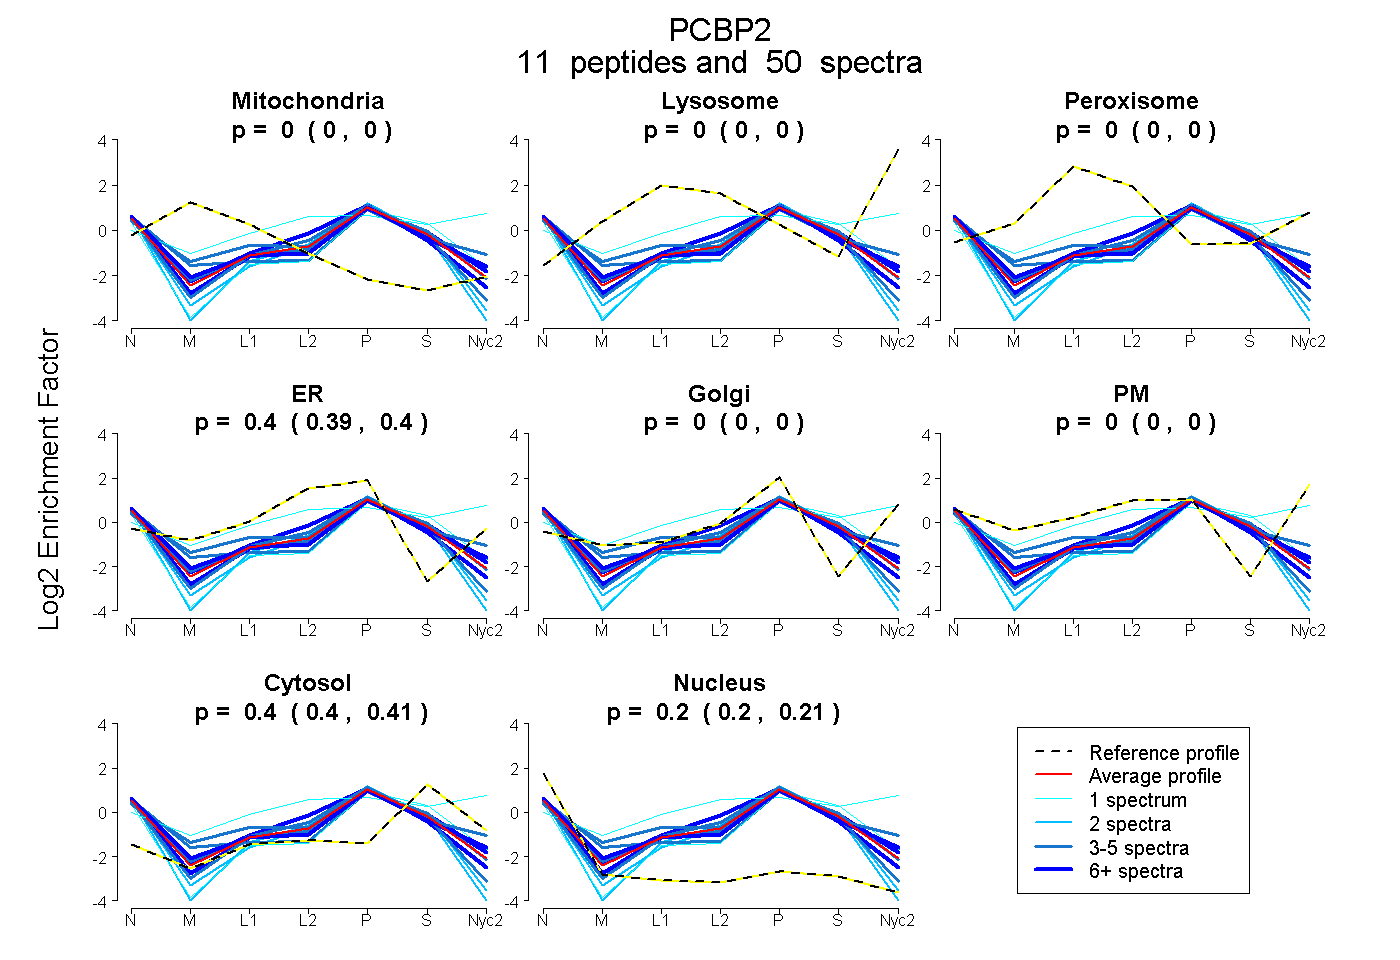
| Expt A |
11 peptides |
50 spectra |
|
0.000 0.000 | 0.000 |
0.000 0.000 | 0.000 |
0.000 0.000 | 0.000 |
0.395 0.390 | 0.399 |
0.000 0.000 | 0.000 |
0.000 0.000 | 0.000 |
0.402 0.397 | 0.406 |
0.203 0.197 | 0.208 |
| 5 spectra, LVVPASQCGSLIGK | 0.000 | 0.000 | 0.000 | 0.409 | 0.000 | 0.000 | 0.340 | 0.251 | ||
| 1 spectrum, LEEDISSSMTNSTAASRPPVTLR | 0.000 | 0.000 | 0.000 | 0.022 | 0.238 | 0.000 | 0.551 | 0.189 | ||
| 1 spectrum, QICVVMLETLSQSPPK | 0.000 | 0.046 | 0.138 | 0.031 | 0.017 | 0.391 | 0.377 | 0.000 | ||
| 11 spectra, QMSGAQIK | 0.000 | 0.000 | 0.000 | 0.271 | 0.168 | 0.000 | 0.362 | 0.198 | ||
| 7 spectra, IITLAGPTNAIFK | 0.000 | 0.000 | 0.000 | 0.465 | 0.000 | 0.000 | 0.323 | 0.212 | ||
| 9 spectra, INISEGNCPER | 0.000 | 0.000 | 0.000 | 0.332 | 0.034 | 0.000 | 0.436 | 0.199 | ||
| 4 spectra, IANPVEGSTDR | 0.000 | 0.000 | 0.000 | 0.157 | 0.279 | 0.000 | 0.343 | 0.222 | ||
| 4 spectra, LLMHGK | 0.000 | 0.000 | 0.000 | 0.348 | 0.000 | 0.000 | 0.445 | 0.208 | ||
| 4 spectra, LSSETGGMGSS | 0.000 | 0.000 | 0.002 | 0.329 | 0.204 | 0.000 | 0.369 | 0.096 | ||
| 2 spectra, AITIAGIPQSIIECVK | 0.000 | 0.000 | 0.000 | 0.296 | 0.000 | 0.000 | 0.344 | 0.361 | ||
| 2 spectra, ESTGAQVQVAGDMLPNSTER | 0.000 | 0.000 | 0.000 | 0.291 | 0.000 | 0.000 | 0.379 | 0.330 |
| Plot | Mito | Lyso or Perox | ER | Golgi | PM | Cytosol | Nucleus | ||||||
| Expt B |
8 peptides |
23 spectra |
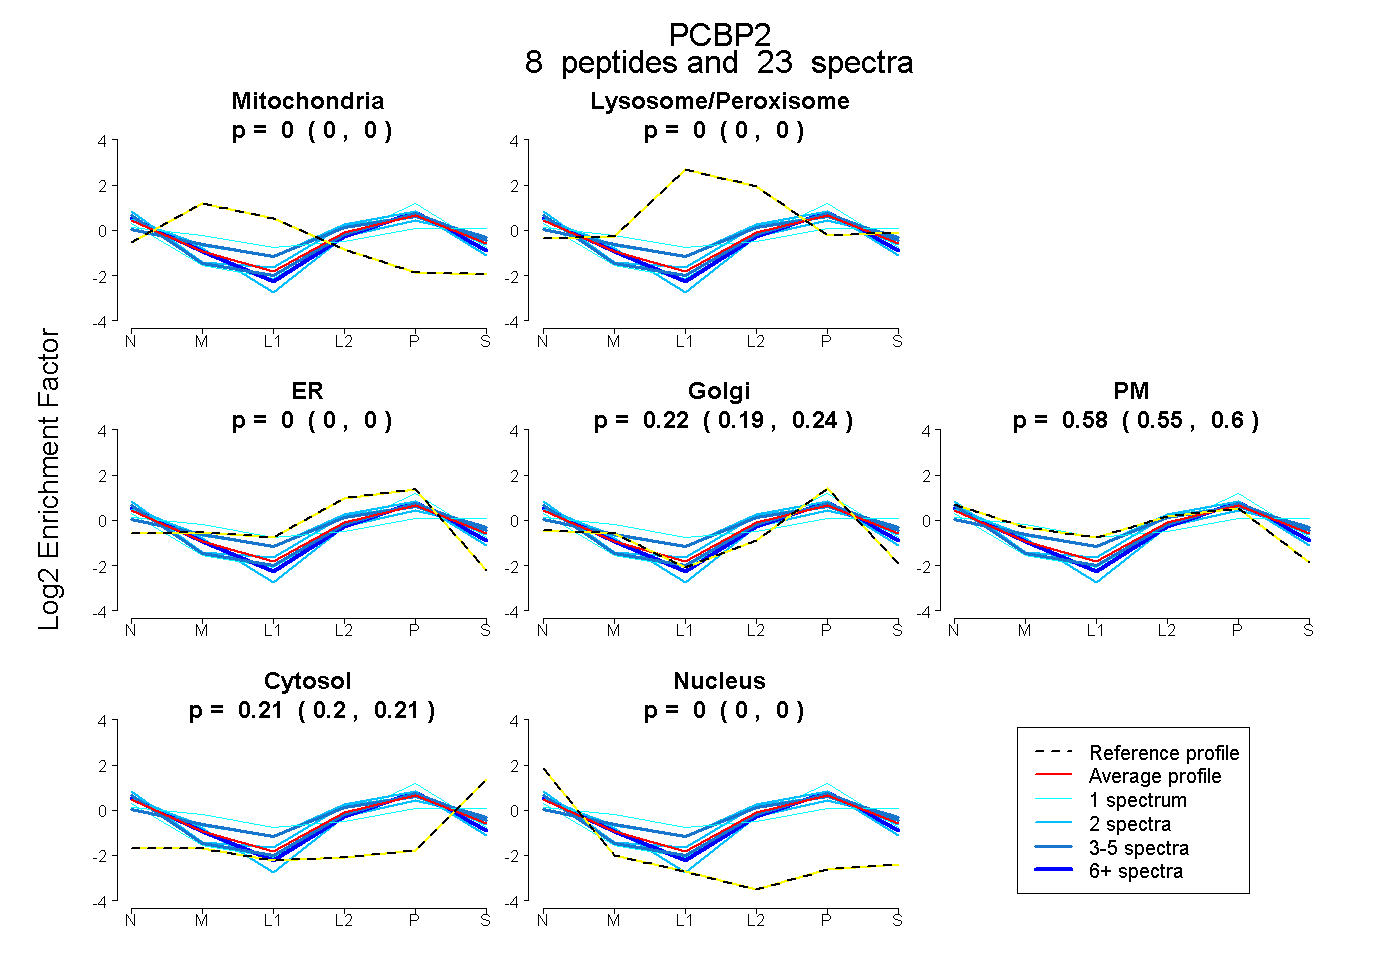 |
0.000 0.000 | 0.000 |
0.000 0.000 | 0.000 |
0.000 0.000 | 0.000 |
0.217 0.187 | 0.241 |
0.576 0.549 | 0.599 |
0.207 0.198 | 0.214 |
0.000 0.000 | 0.000 |
|||
| Plot | Lyso | Other | |||||||||||
| Expt C |
7 peptides |
60 spectra |
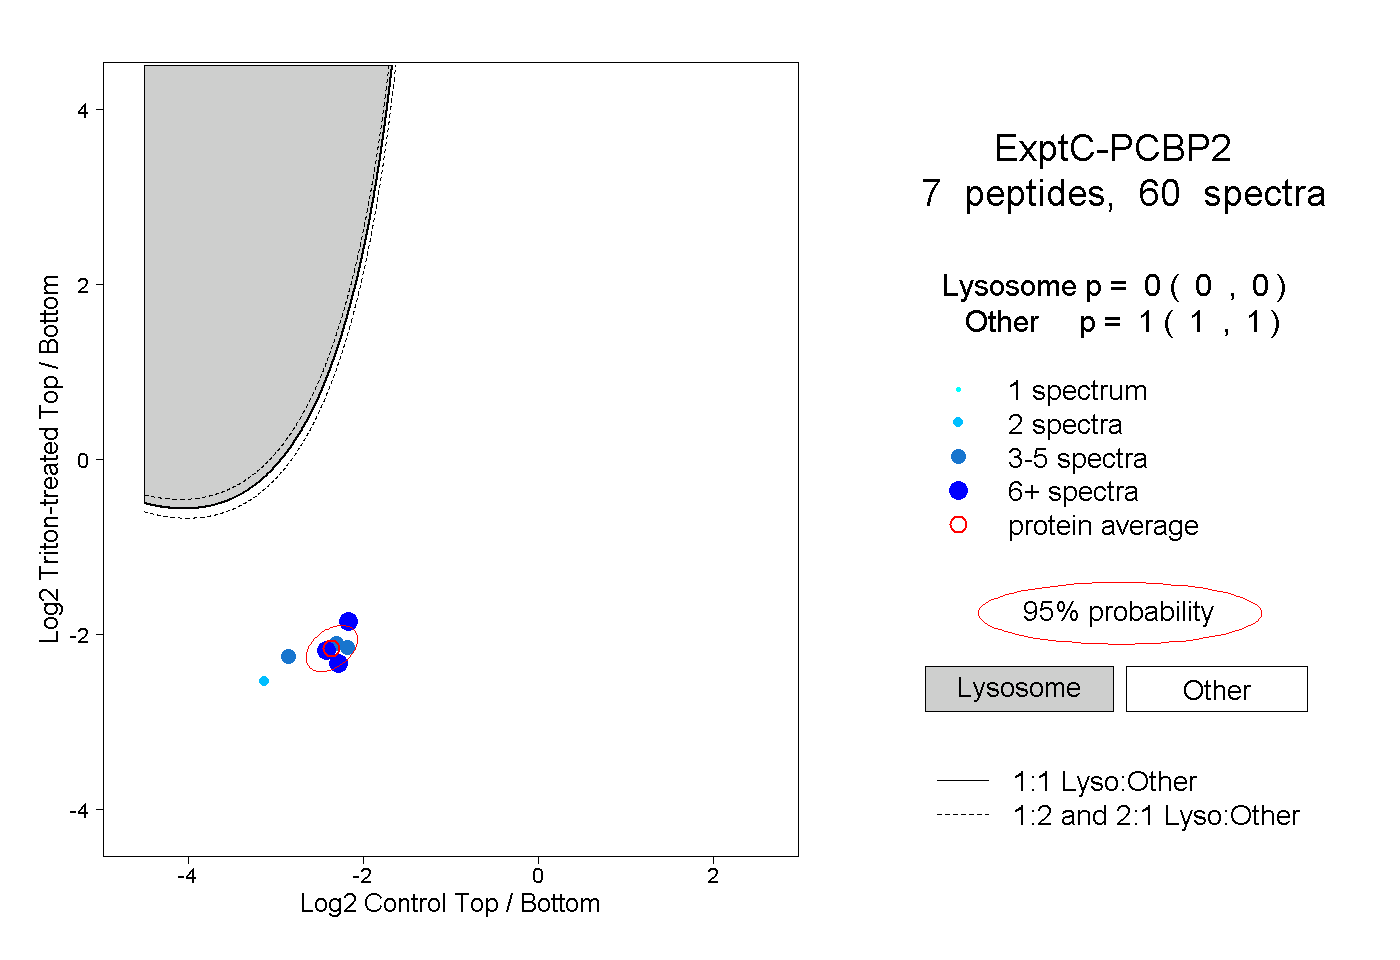 |
0.000 0.000 | 0.000 |
1.000 1.000 | 1.000 |
||||||||
| Plot | Lyso | Other | |||||||||||
| Expt D |
4 peptides |
6 spectra |
 |
0.000 0.000 | 0.000 |
1.000 1.000 | 1.000 |