PCBP2
[ENSRNOP00000052173]
Main page
| | | Plot |
Mito |
Lyso |
|
Perox |
ER |
Golgi |
PM |
Cytosol |
Nucleus |
|
| Expt A |
 11
11
peptides |
50
spectra |
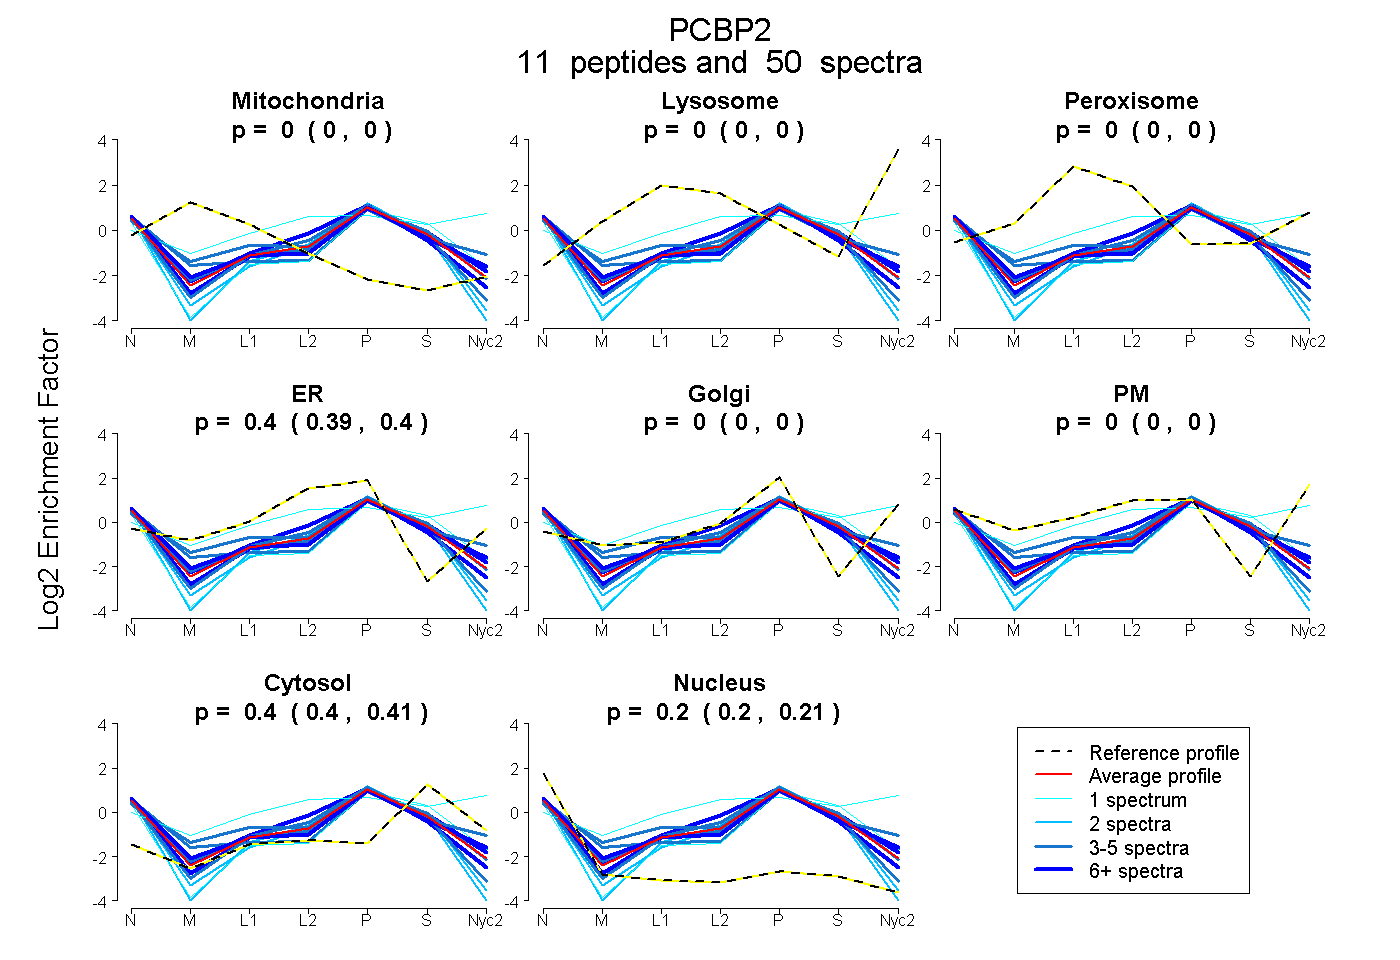 |
0.000
0.000 | 0.000 |
0.000
0.000 | 0.000 |
|
0.000
0.000 | 0.000 |
0.395
0.390 | 0.399 |
0.000
0.000 | 0.000 |
0.000
0.000 | 0.000 |
0.402
0.397 | 0.406 |
0.203
0.197 | 0.208 |
|
| | | Plot |
Mito |
|
Lyso or Perox |
|
ER |
Golgi |
PM |
Cytosol |
Nucleus |
|
| Expt B |
8
peptides |
23
spectra |
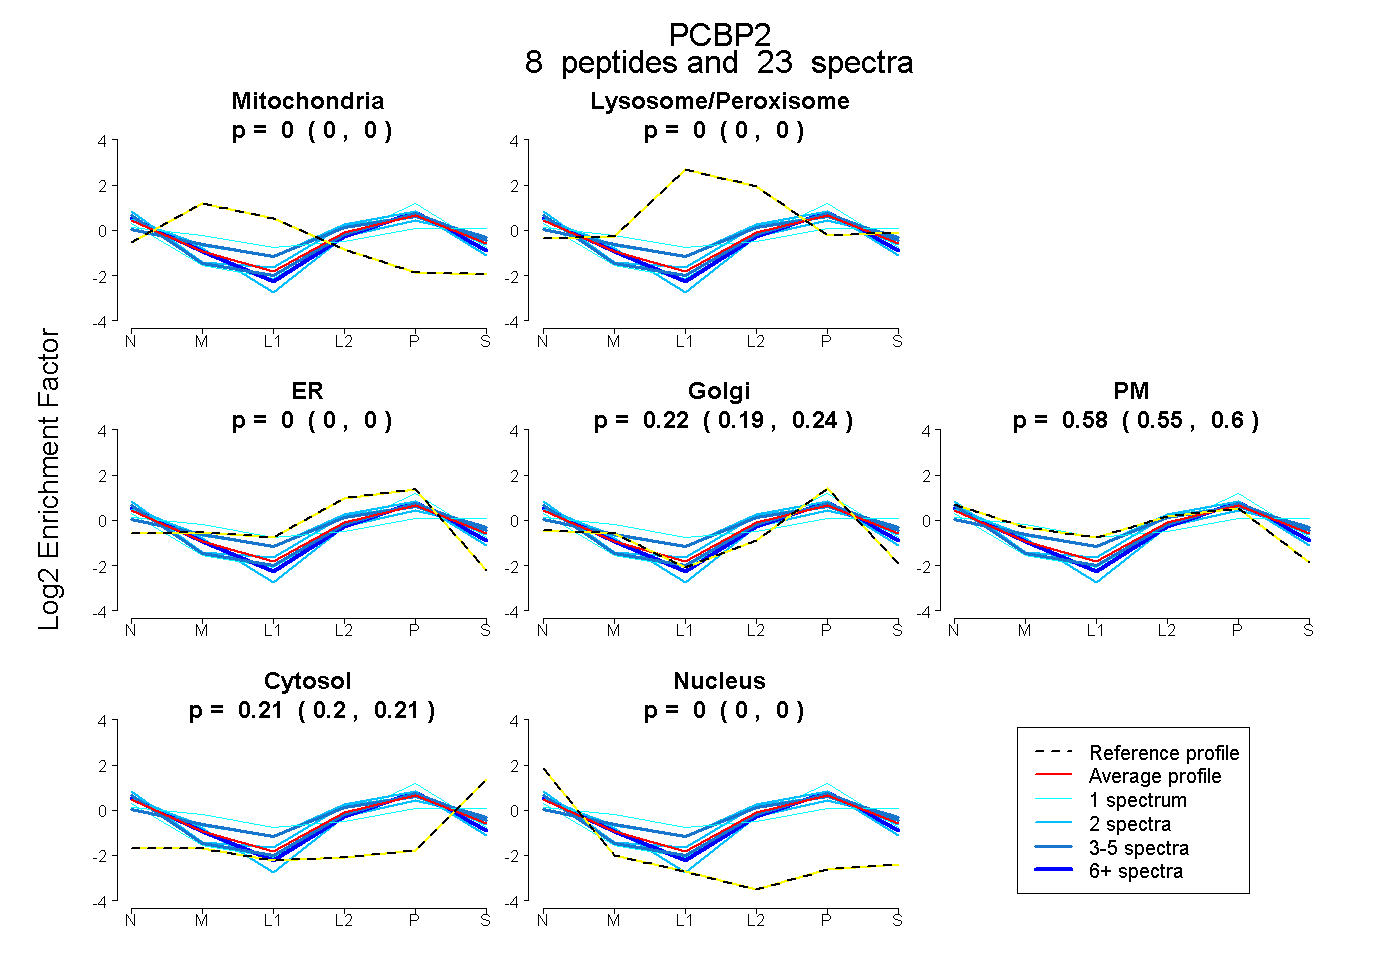 |
0.000
0.000 | 0.000 |
|
0.000
0.000 | 0.000 |
|
0.000
0.000 | 0.000 |
0.217
0.187 | 0.241 |
0.576
0.549 | 0.599 |
0.207
0.198 | 0.214 |
0.000
0.000 | 0.000 |
|
| | | Plot |
|
Lyso |
|
|
|
|
|
|
|
Other |
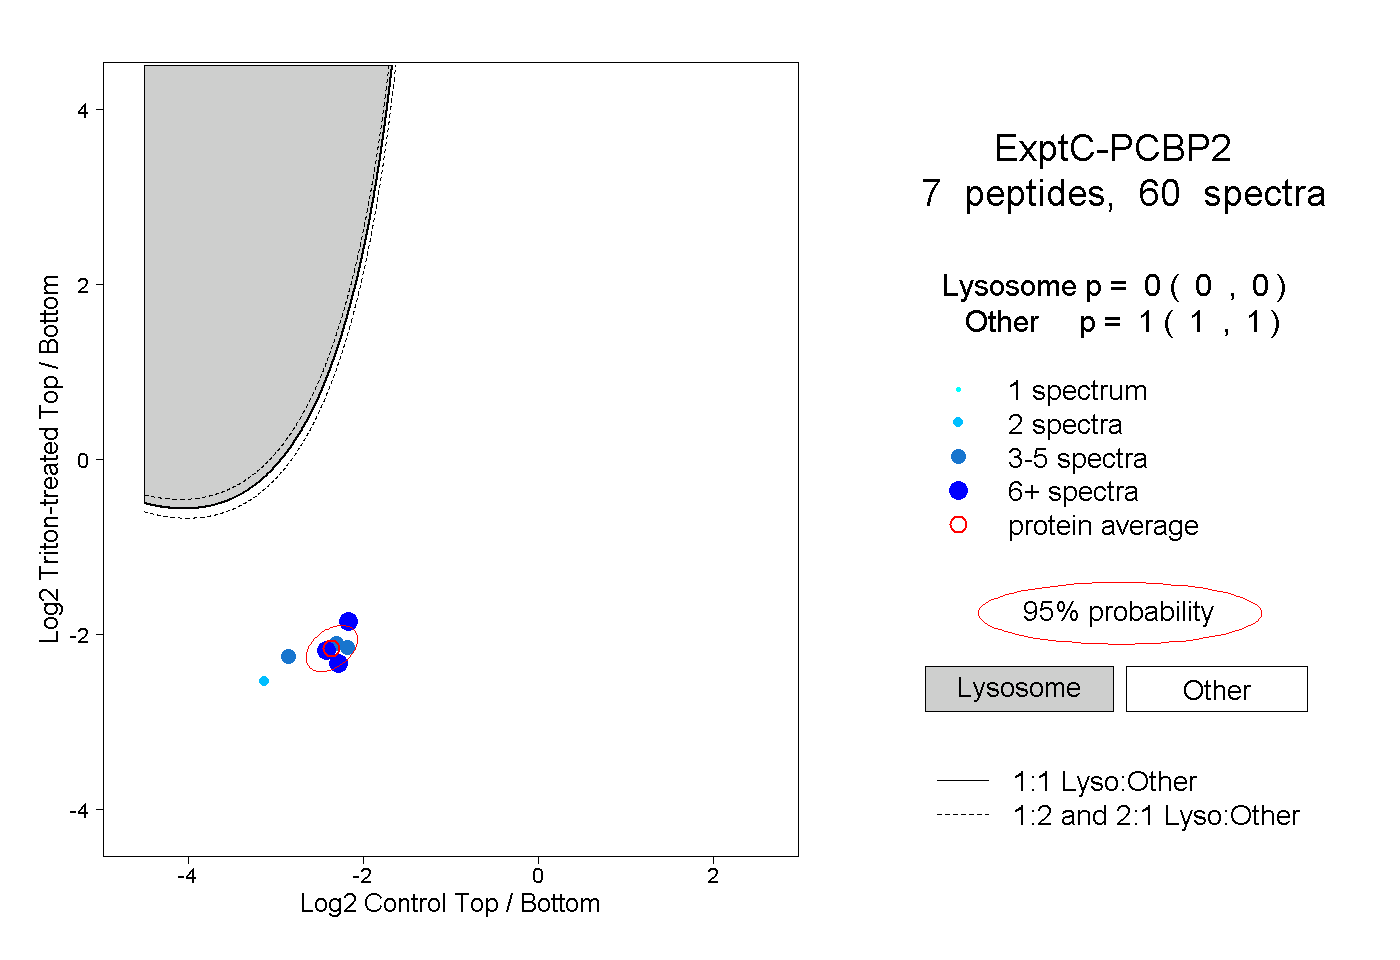
| Expt C |
7
peptides |
60
spectra |
 |
|
0.000
0.000 | 0.000 |
|
|
|
|
|
|
|
1.000
1.000 | 1.000 |
| 14 spectra, QMSGAQIK |
|
0.000 |
|
|
|
|
|
|
|
1.000 |
| 2 spectra, IITLAGPTNAIFK |
|
0.000 |
|
|
|
|
|
|
|
1.000 |
| 18 spectra, INISEGNCPER |
|
0.000 |
|
|
|
|
|
|
|
1.000 |
| 13 spectra, LLMHGK |
|
0.000 |
|
|
|
|
|
|
|
1.000 |
| 4 spectra, IANPVEGSTDR |
|
0.000 |
|
|
|
|
|
|
|
1.000 |
| 5 spectra, LSSETGGMGSS |
|
0.000 |
|
|
|
|
|
|
|
1.000 |
| 4 spectra, EVGSIIGK |
|
0.000 |
|
|
|
|
|
|
|
1.000 |
| | | Plot |
|
Lyso |
|
|
|
|
|
|
|
Other |
| Expt D |
4
peptides |
6
spectra |
 |
|
0.000
0.000 | 0.000 |
|
|
|
|
|
|
|
1.000
1.000 | 1.000 |