 20
20peptides
spectra
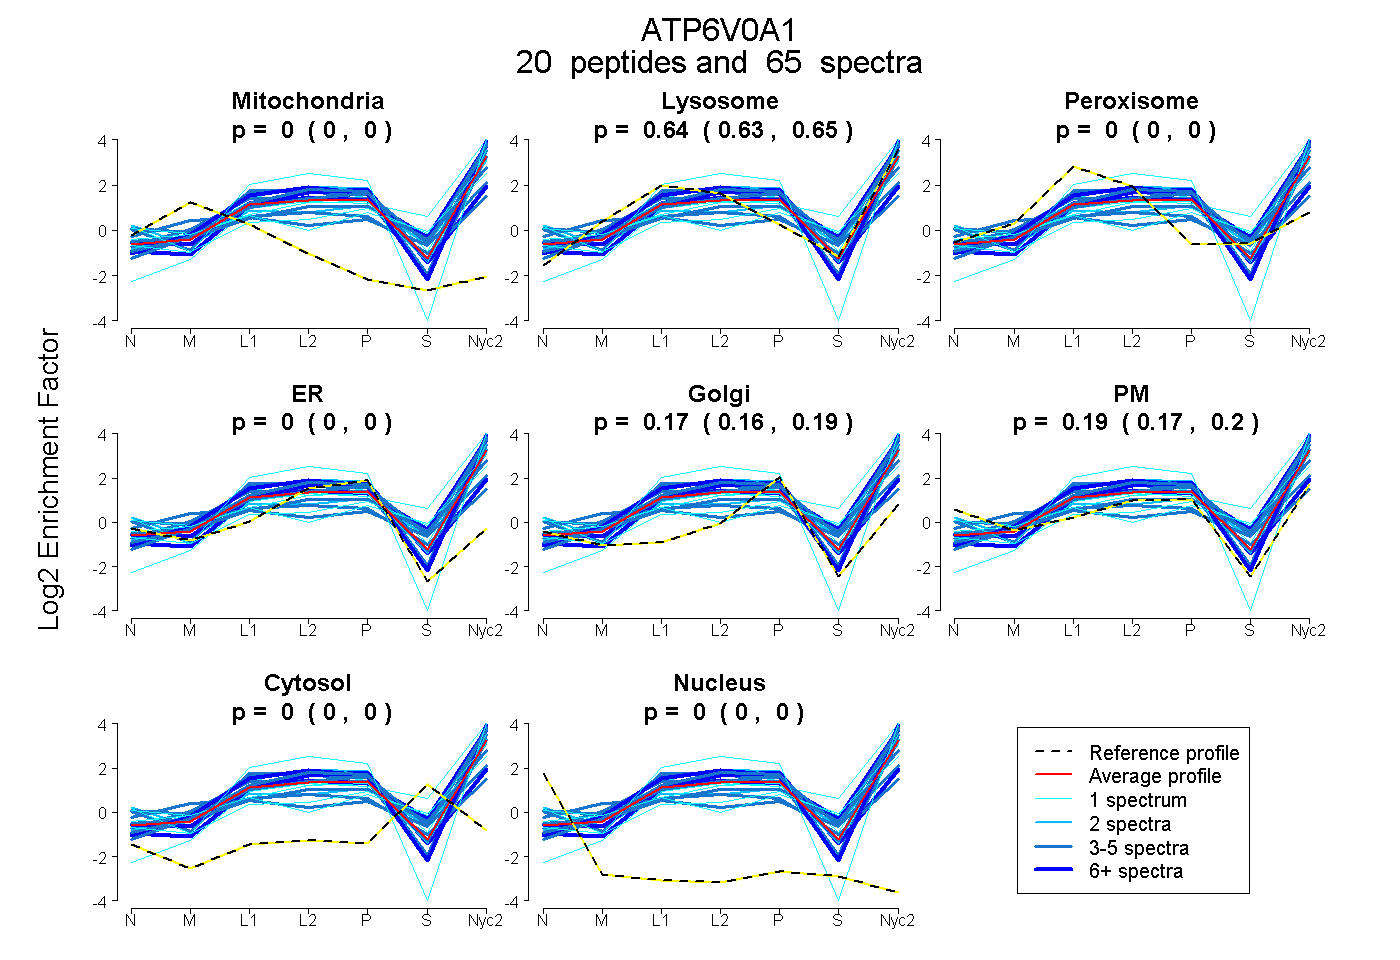
0.000 | 0.000
0.629 | 0.646
0.000 | 0.000
0.000 | 0.000
0.160 | 0.186
0.168 | 0.203
0.000 | 0.000
0.000 | 0.000
10peptides
spectra
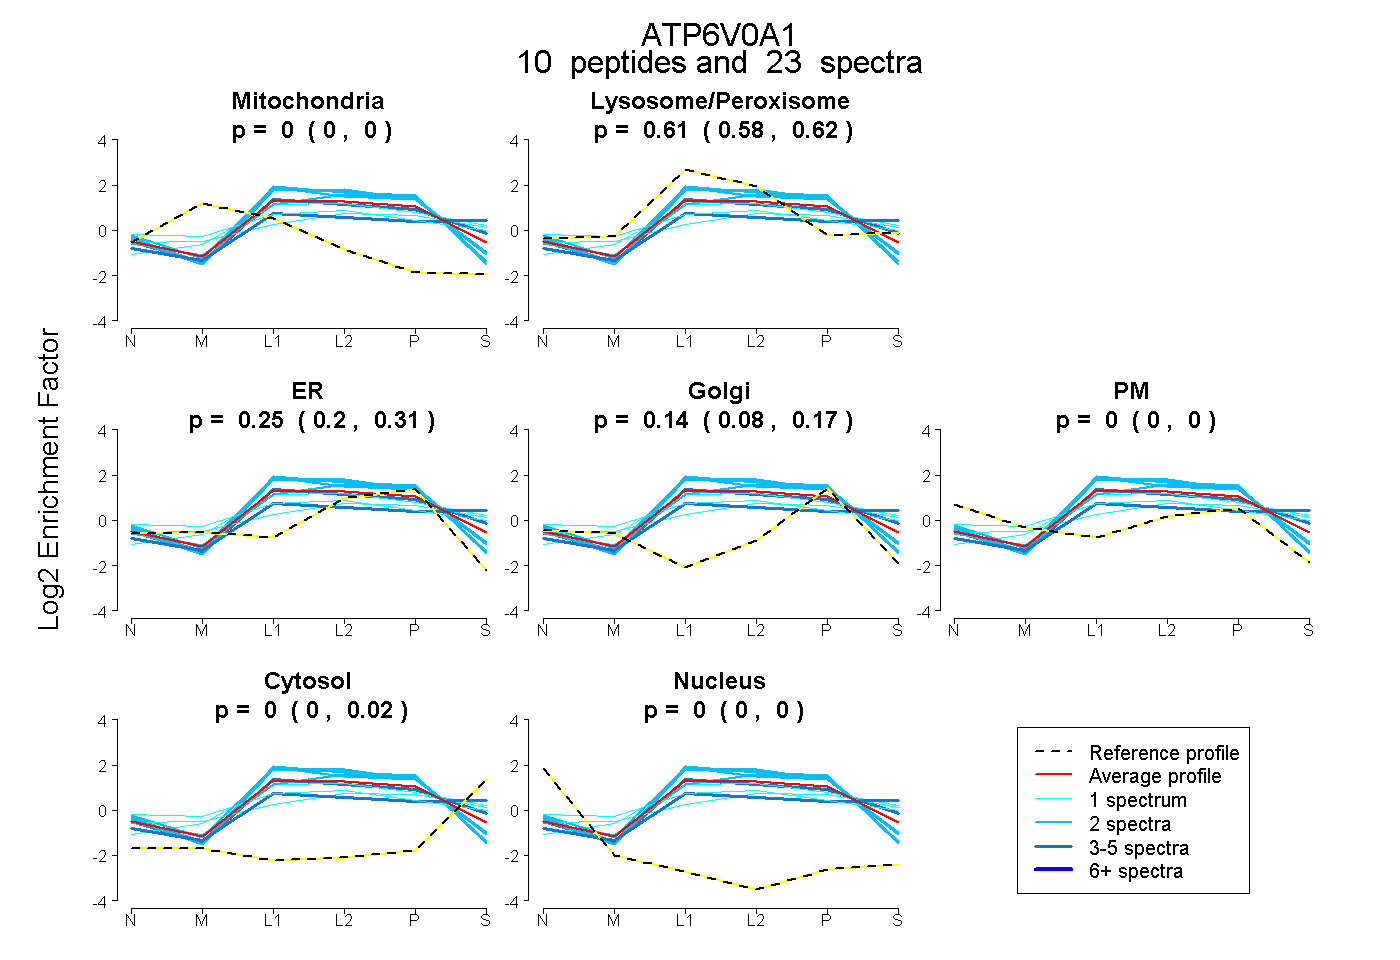
0.000 | 0.000
0.579 | 0.622
0.202 | 0.310
0.082 | 0.169
0.000 | 0.000
0.000 | 0.019
0.000 | 0.000
26peptides
spectra
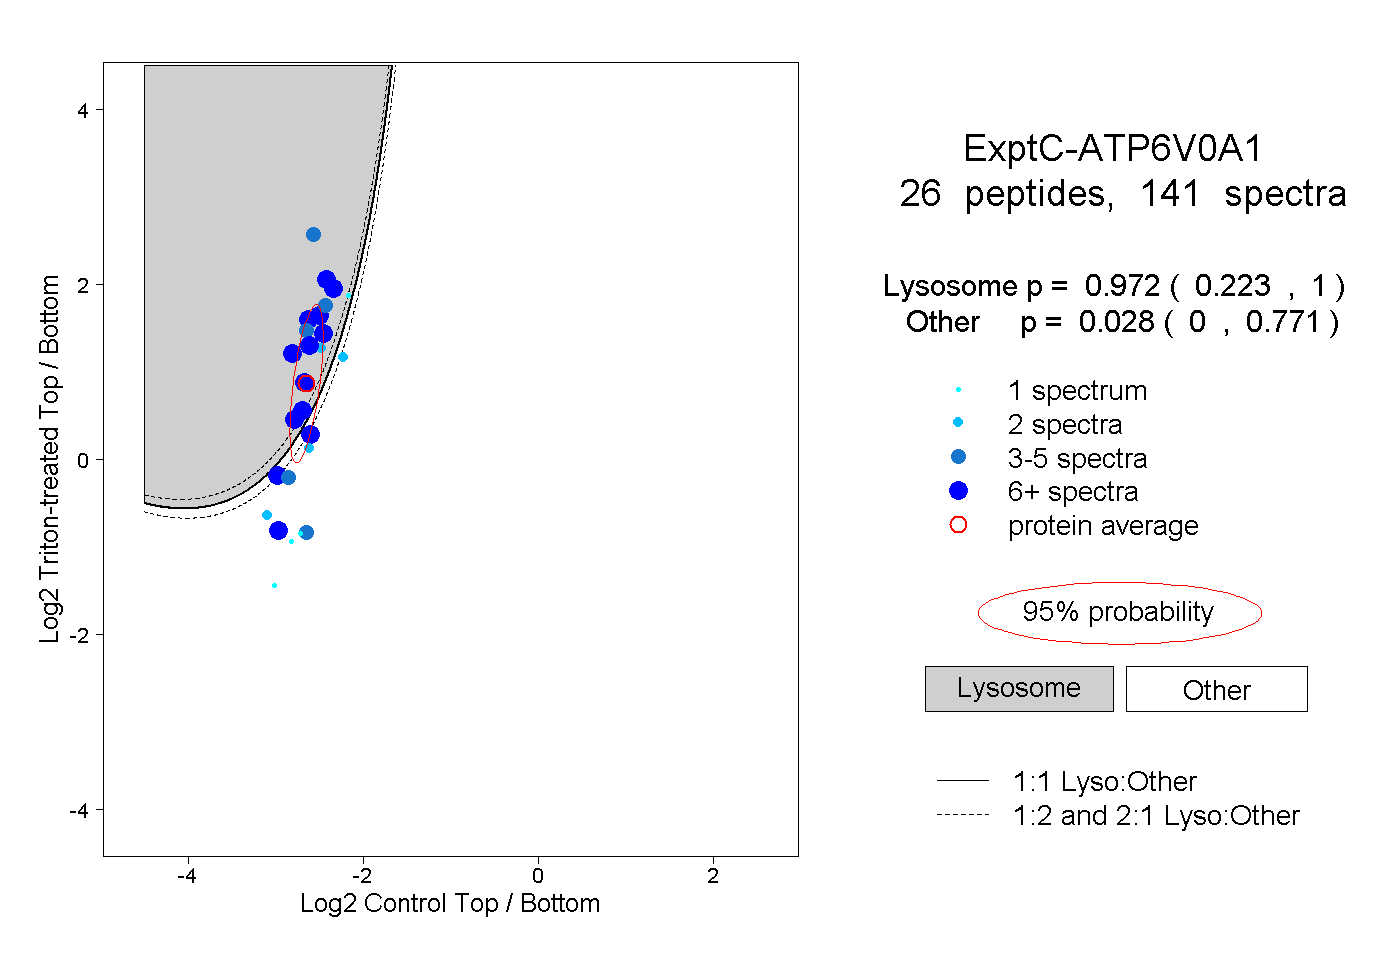
0.223 | 1.000
0.000 | 0.771
8peptides
spectra
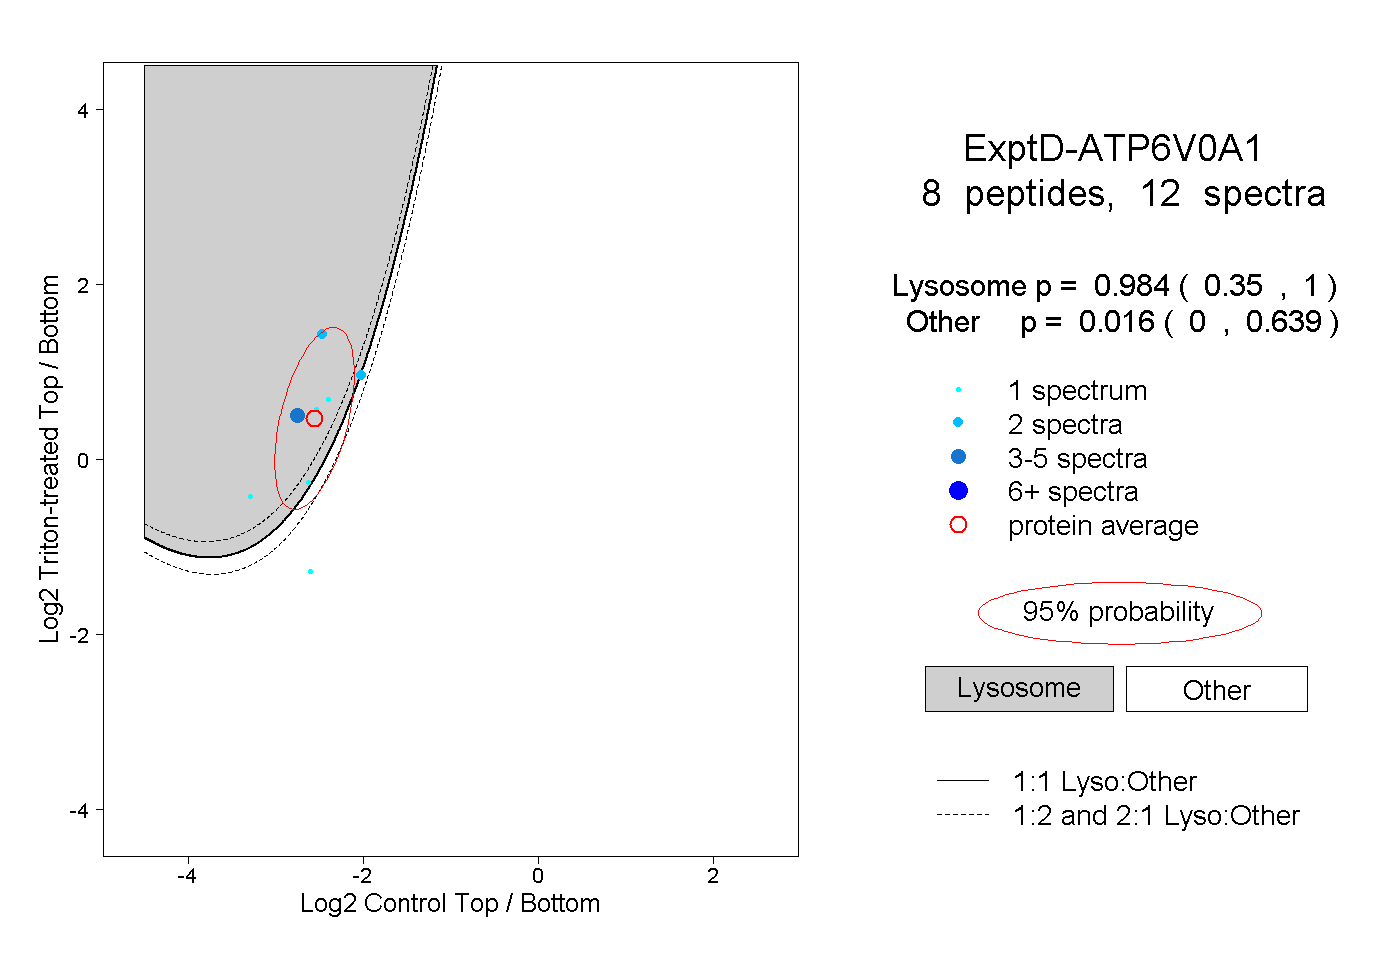
0.350 | 1.000
0.000 | 0.639