 20
20peptides
spectra
0.000 | 0.000
0.629 | 0.646
0.000 | 0.000
0.000 | 0.000
0.160 | 0.186
0.168 | 0.203
0.000 | 0.000
0.000 | 0.000
| Plot | Mito | Lyso | Perox | ER | Golgi | PM | Cytosol | Nucleus | |||||
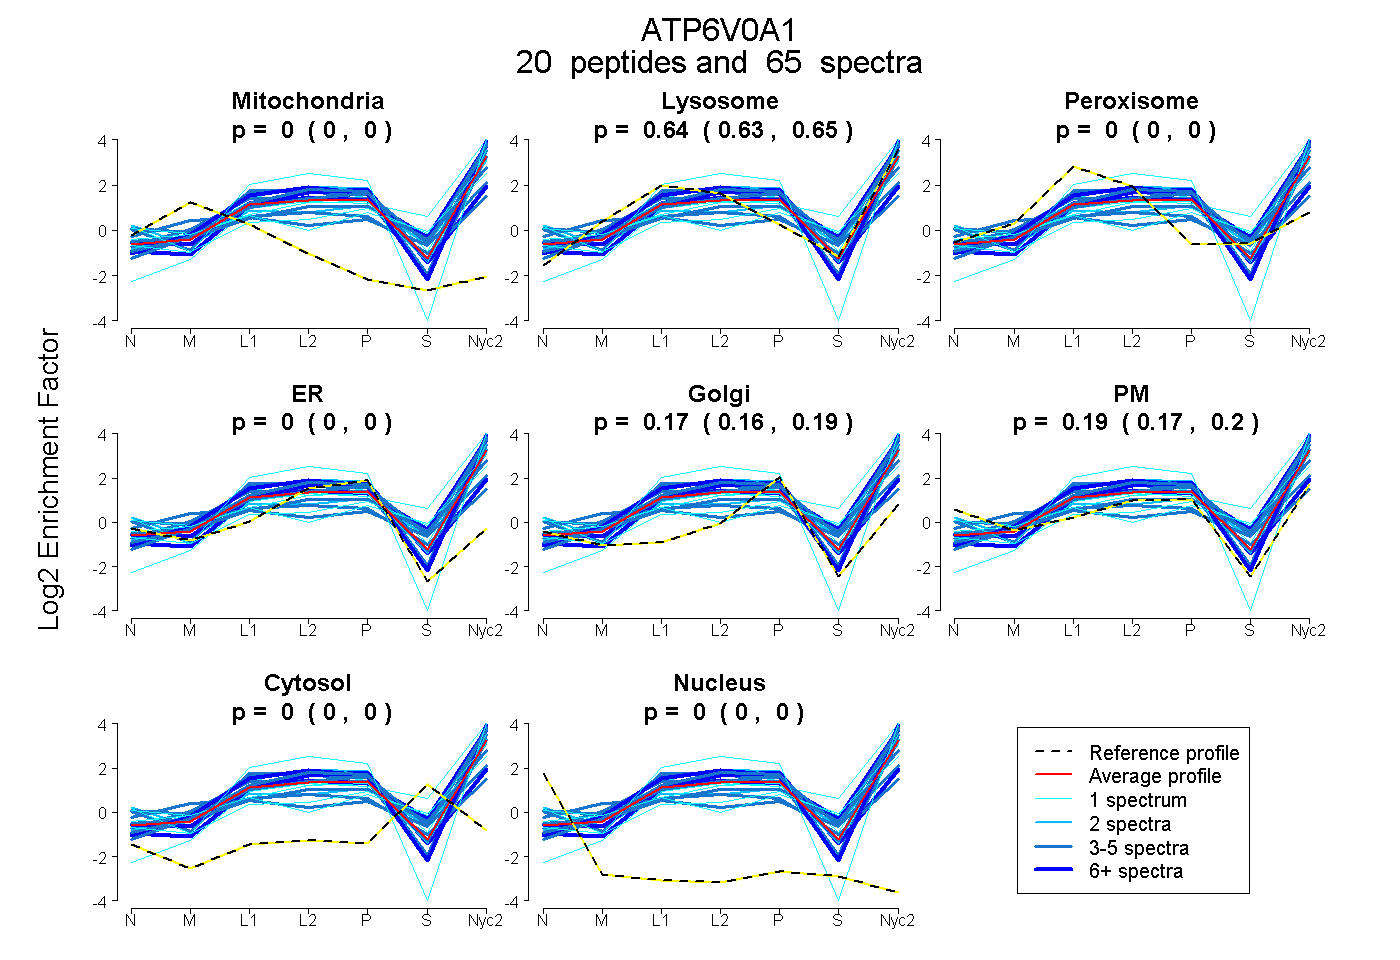
| Expt A |
20 peptides |
65 spectra |
|
0.000 0.000 | 0.000 |
0.638 0.629 | 0.646 |
0.000 0.000 | 0.000 |
0.000 0.000 | 0.000 |
0.175 0.160 | 0.186 |
0.187 0.168 | 0.203 |
0.000 0.000 | 0.000 |
0.000 0.000 | 0.000 |
| 4 spectra, GTEHSGSTVPSILNR | 0.046 | 0.431 | 0.000 | 0.000 | 0.000 | 0.356 | 0.167 | 0.000 | ||
| 6 spectra, HLGTLNFGGIR | 0.000 | 0.490 | 0.000 | 0.427 | 0.054 | 0.029 | 0.000 | 0.000 | ||
| 3 spectra, NENEMFSMVFSGR | 0.000 | 0.792 | 0.000 | 0.000 | 0.208 | 0.000 | 0.000 | 0.000 | ||
| 4 spectra, LTFLNSFK | 0.000 | 0.765 | 0.000 | 0.000 | 0.161 | 0.074 | 0.000 | 0.000 | ||
| 3 spectra, ICEGFR | 0.000 | 0.140 | 0.171 | 0.000 | 0.000 | 0.555 | 0.135 | 0.000 | ||
| 13 spectra, EMASGVNTR | 0.000 | 0.778 | 0.000 | 0.000 | 0.165 | 0.000 | 0.057 | 0.000 | ||
| 1 spectrum, ANIPIMDTGENPEVPFPR | 0.000 | 0.746 | 0.000 | 0.000 | 0.152 | 0.102 | 0.000 | 0.000 | ||
| 1 spectrum, NFLELTELK | 0.000 | 0.546 | 0.000 | 0.057 | 0.000 | 0.397 | 0.000 | 0.000 | ||
| 4 spectra, DLNPDVNVFQR | 0.000 | 0.614 | 0.000 | 0.000 | 0.055 | 0.331 | 0.000 | 0.000 | ||
| 1 spectrum, SVFIIFFQGDQLK | 0.000 | 0.416 | 0.000 | 0.000 | 0.000 | 0.393 | 0.191 | 0.000 | ||
| 7 spectra, LGFVAGVINR | 0.000 | 0.738 | 0.000 | 0.000 | 0.038 | 0.223 | 0.000 | 0.000 | ||
| 3 spectra, DMIDLEANFEK | 0.000 | 0.704 | 0.000 | 0.000 | 0.000 | 0.296 | 0.000 | 0.000 | ||
| 1 spectrum, FTHGFQNIVDAYGIGTYR | 0.000 | 0.820 | 0.000 | 0.000 | 0.000 | 0.000 | 0.180 | 0.000 | ||
| 2 spectra, FYTGTGFK | 0.000 | 0.705 | 0.000 | 0.000 | 0.000 | 0.295 | 0.000 | 0.000 | ||
| 1 spectrum, FVNEVR | 0.000 | 0.716 | 0.000 | 0.000 | 0.183 | 0.101 | 0.000 | 0.000 | ||
| 4 spectra, FLPFSFEHIR | 0.000 | 0.521 | 0.000 | 0.000 | 0.000 | 0.479 | 0.000 | 0.000 | ||
| 2 spectra, ASLYPCPETPQER | 0.000 | 0.453 | 0.000 | 0.000 | 0.000 | 0.461 | 0.086 | 0.000 | ||
| 1 spectrum, IPTFER | 0.000 | 0.443 | 0.000 | 0.000 | 0.000 | 0.557 | 0.000 | 0.000 | ||
| 1 spectrum, QAEIENPLEDPVTGDYVHK | 0.000 | 0.524 | 0.000 | 0.000 | 0.091 | 0.159 | 0.226 | 0.000 | ||
| 3 spectra, IDDLQMVLNQTEDHR | 0.000 | 0.557 | 0.000 | 0.000 | 0.130 | 0.193 | 0.120 | 0.000 |
| Plot | Mito | Lyso or Perox | ER | Golgi | PM | Cytosol | Nucleus | ||||||
| Expt B |
10 peptides |
23 spectra |
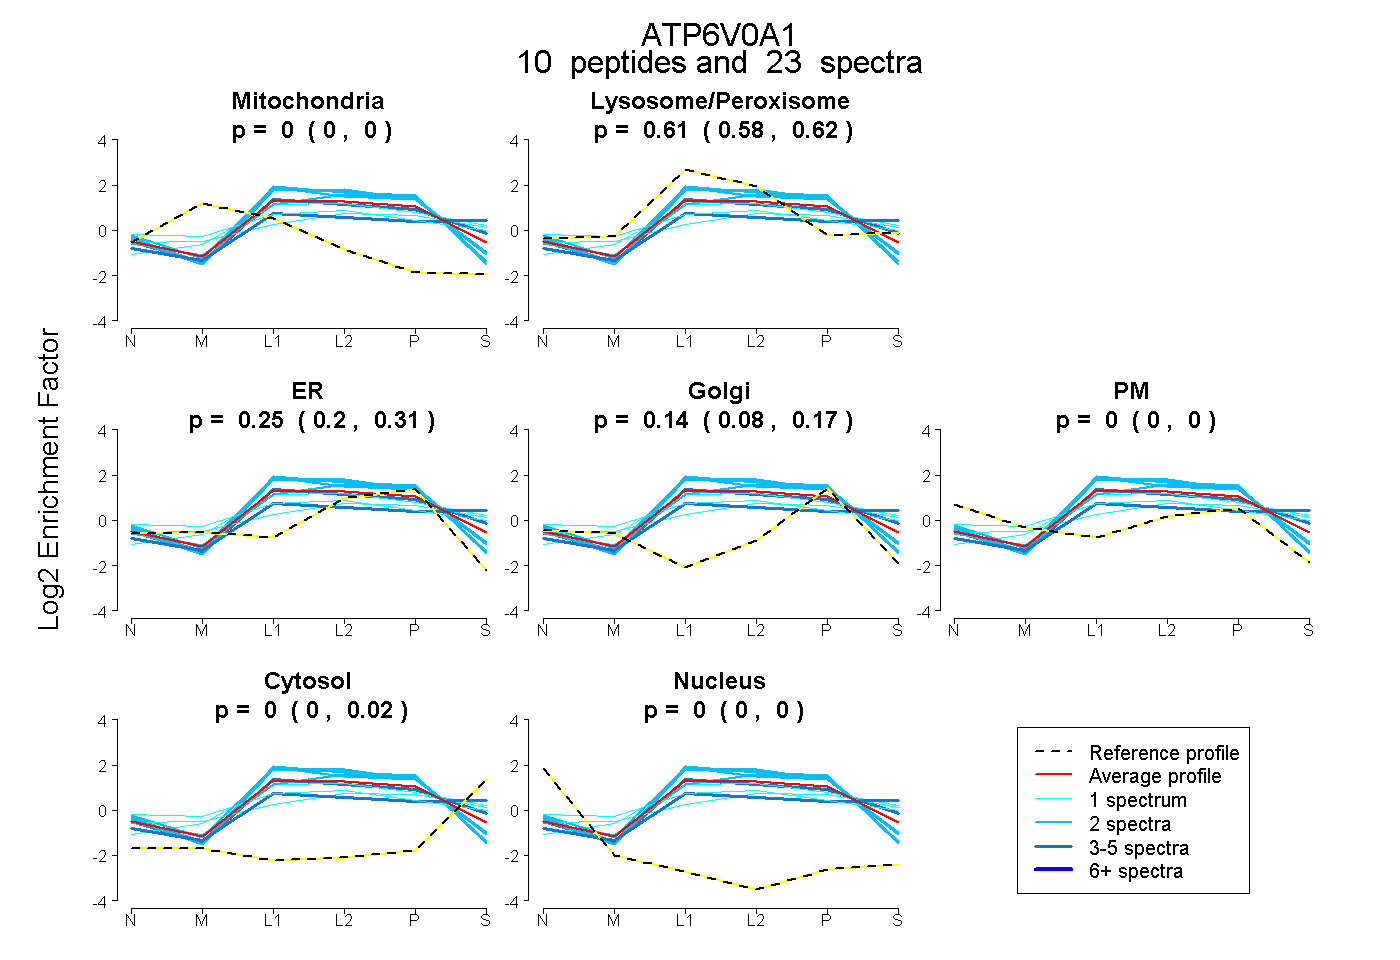 |
0.000 0.000 | 0.000 |
0.605 0.579 | 0.622 |
0.253 0.202 | 0.310 |
0.138 0.082 | 0.169 |
0.000 0.000 | 0.000 |
0.003 0.000 | 0.019 |
0.000 0.000 | 0.000 |
|||
| Plot | Lyso | Other | |||||||||||
| Expt C |
26 peptides |
141 spectra |
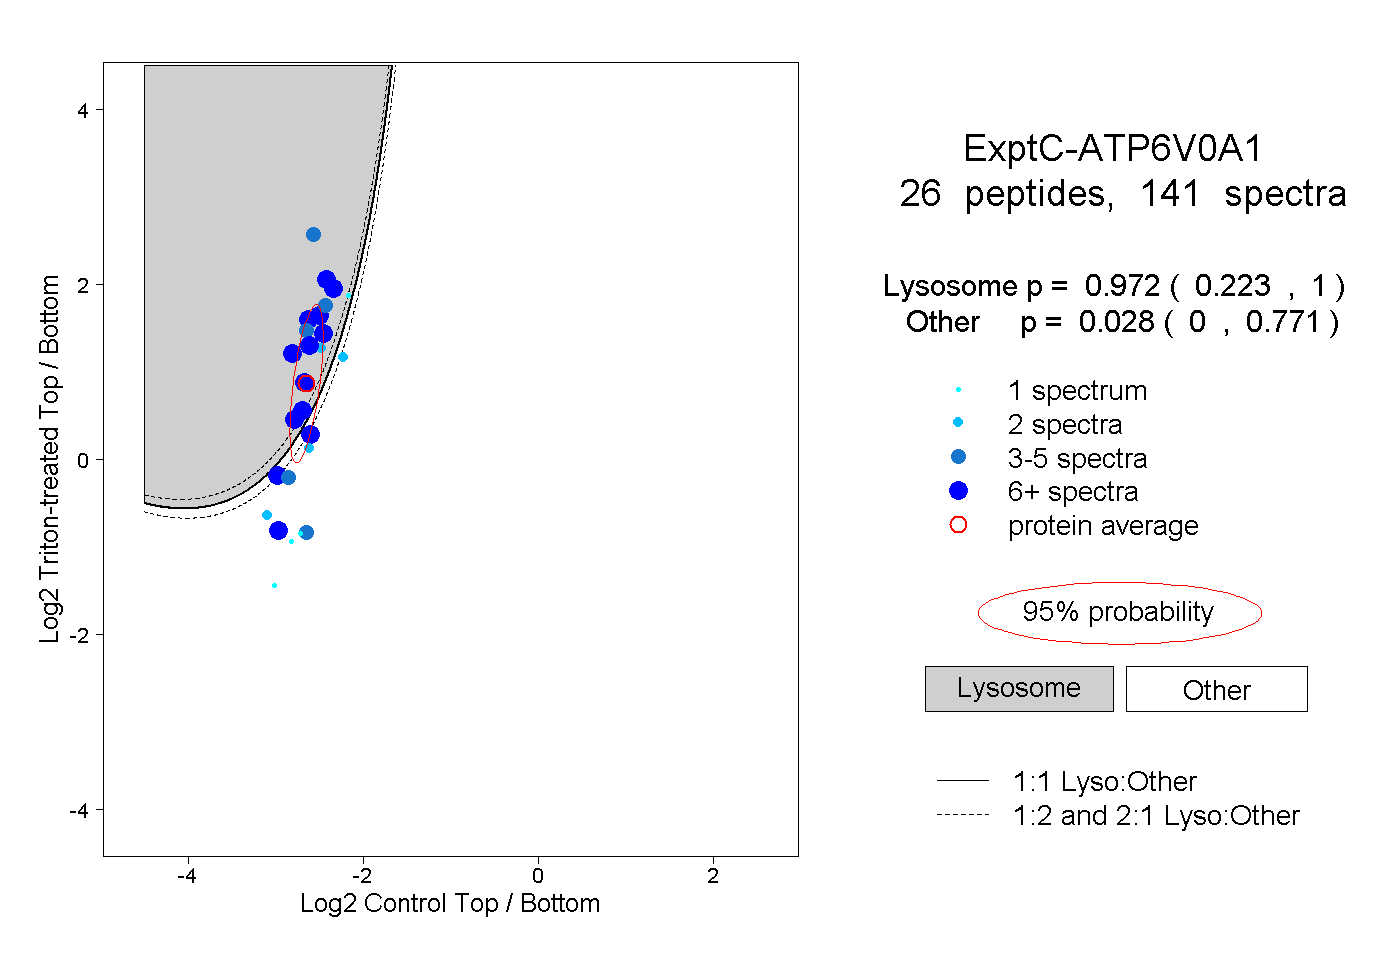 |
0.972 0.223 | 1.000 |
0.028 0.000 | 0.771 |
||||||||
| Plot | Lyso | Other | |||||||||||
| Expt D |
8 peptides |
12 spectra |
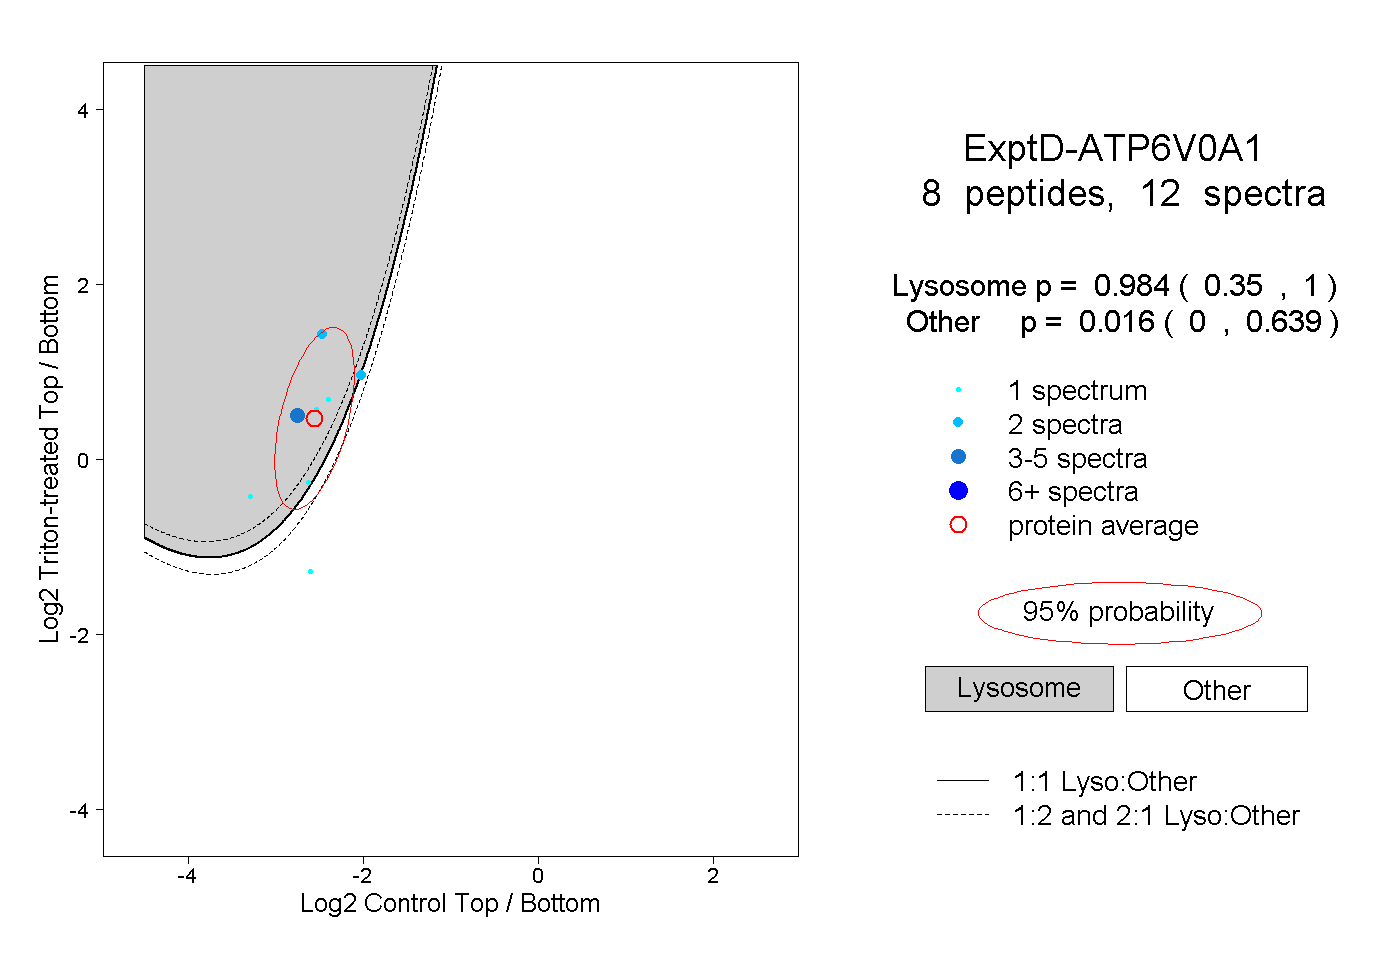 |
0.984 0.350 | 1.000 |
0.016 0.000 | 0.639 |