 10
10peptides
spectra
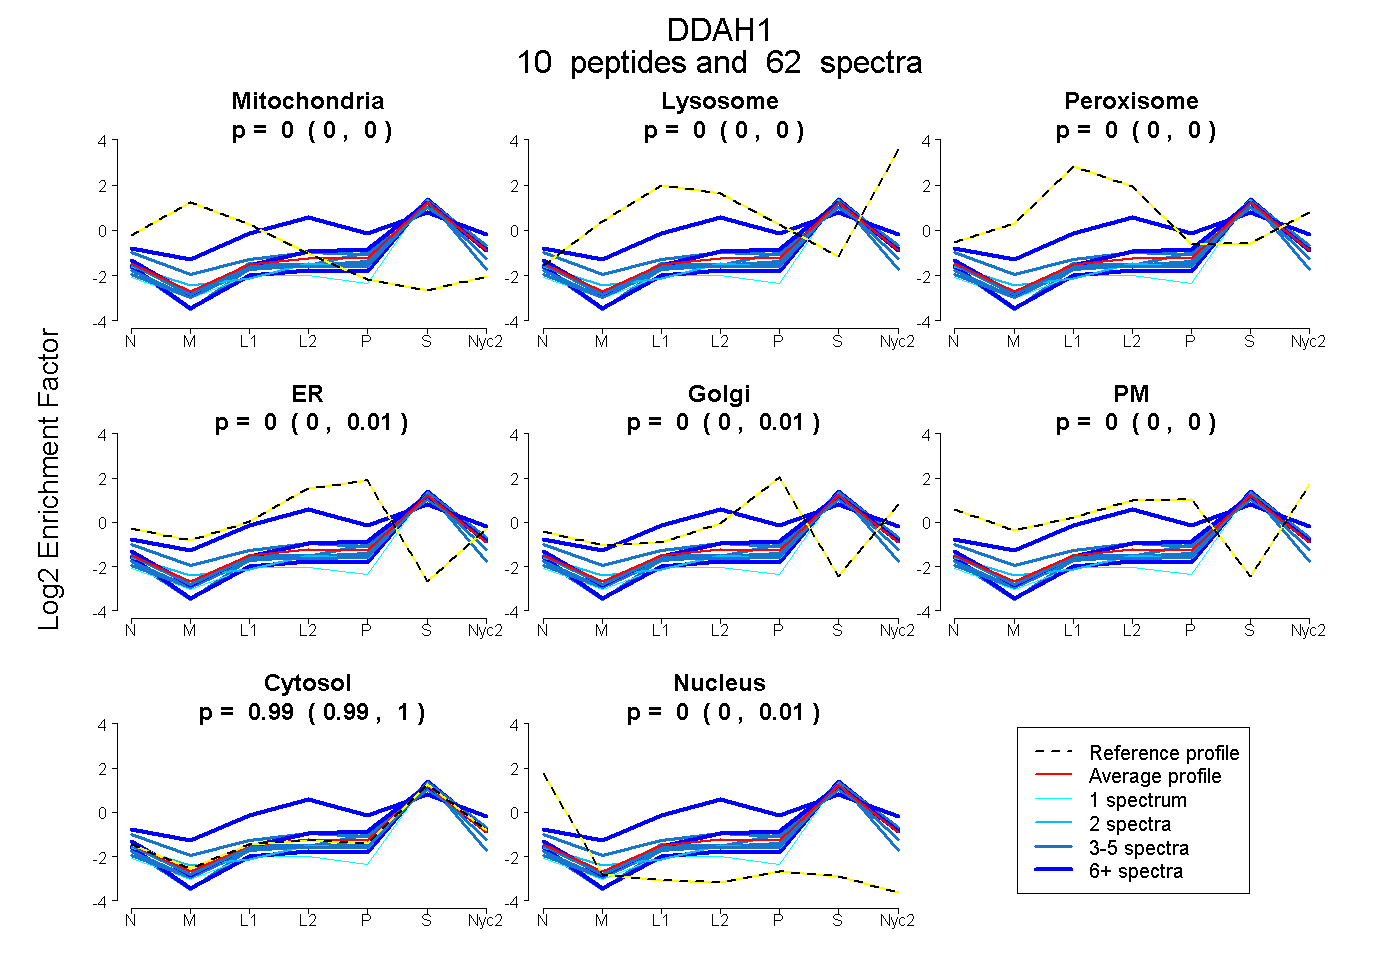
0.000 | 0.000
0.000 | 0.000
0.000 | 0.000
0.000 | 0.010
0.000 | 0.009
0.000 | 0.000
0.987 | 0.997
0.000 | 0.006
6peptides
spectra
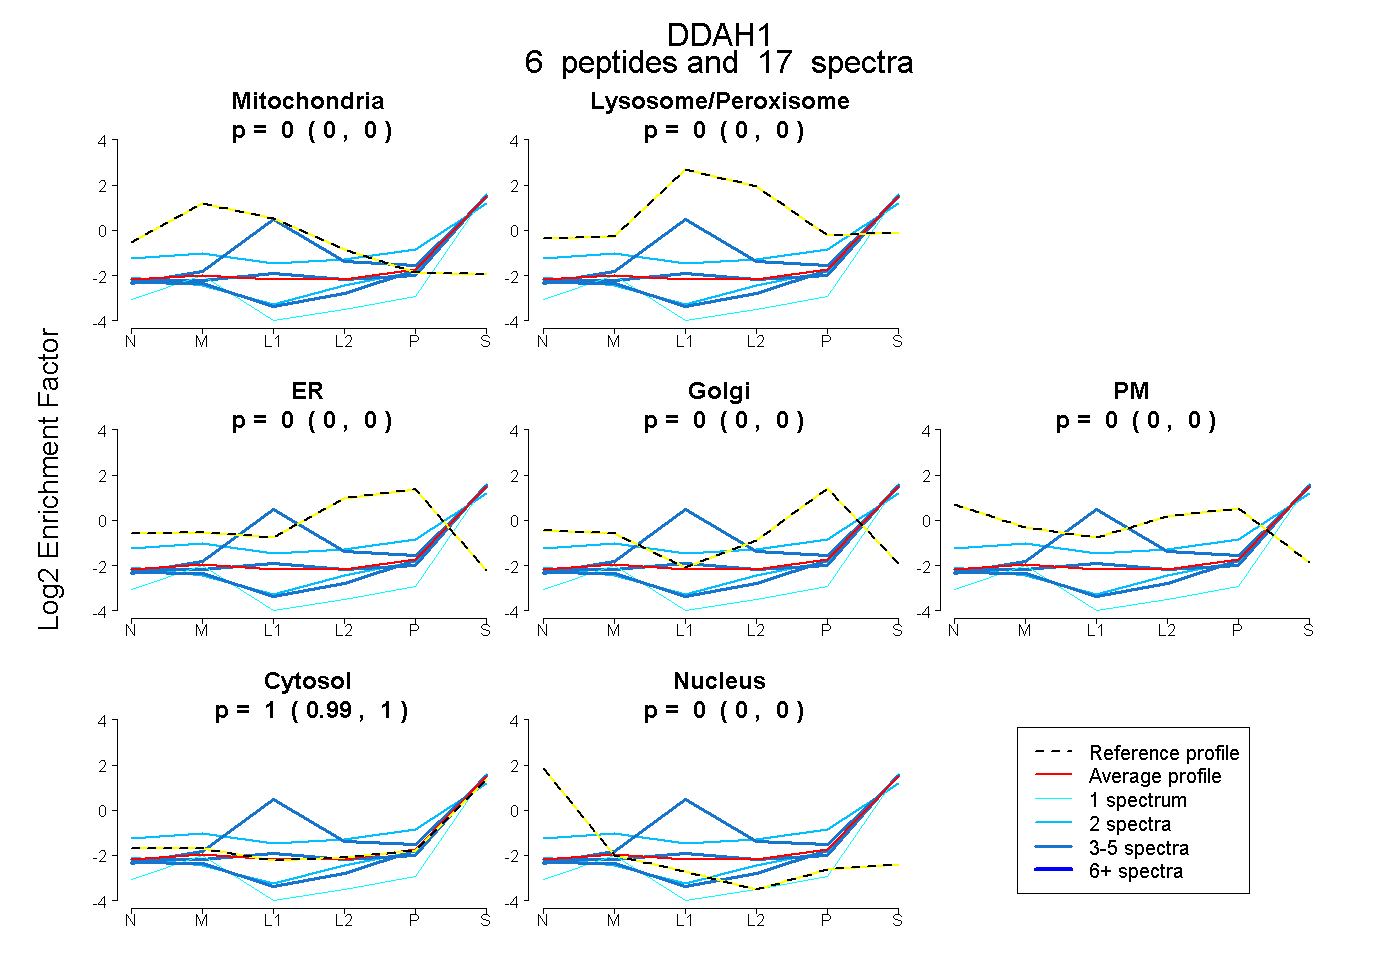
0.000 | 0.000
0.000 | 0.004
0.000 | 0.000
0.000 | 0.000
0.000 | 0.000
0.991 | 1.000
0.000 | 0.000
9peptides
spectra
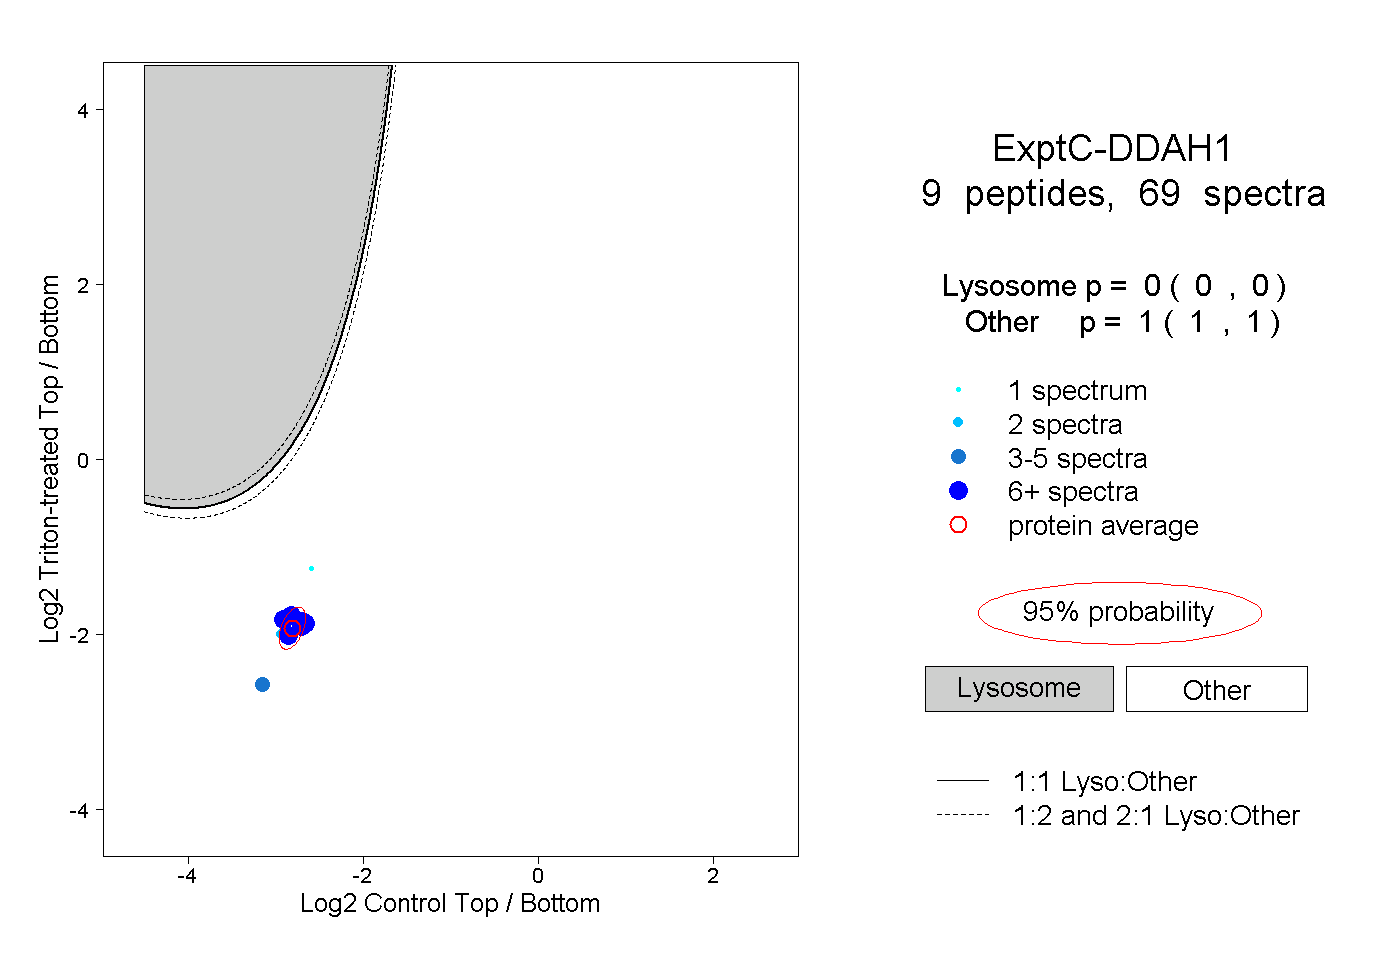
0.000 | 0.000
1.000 | 1.000
4peptides
spectra
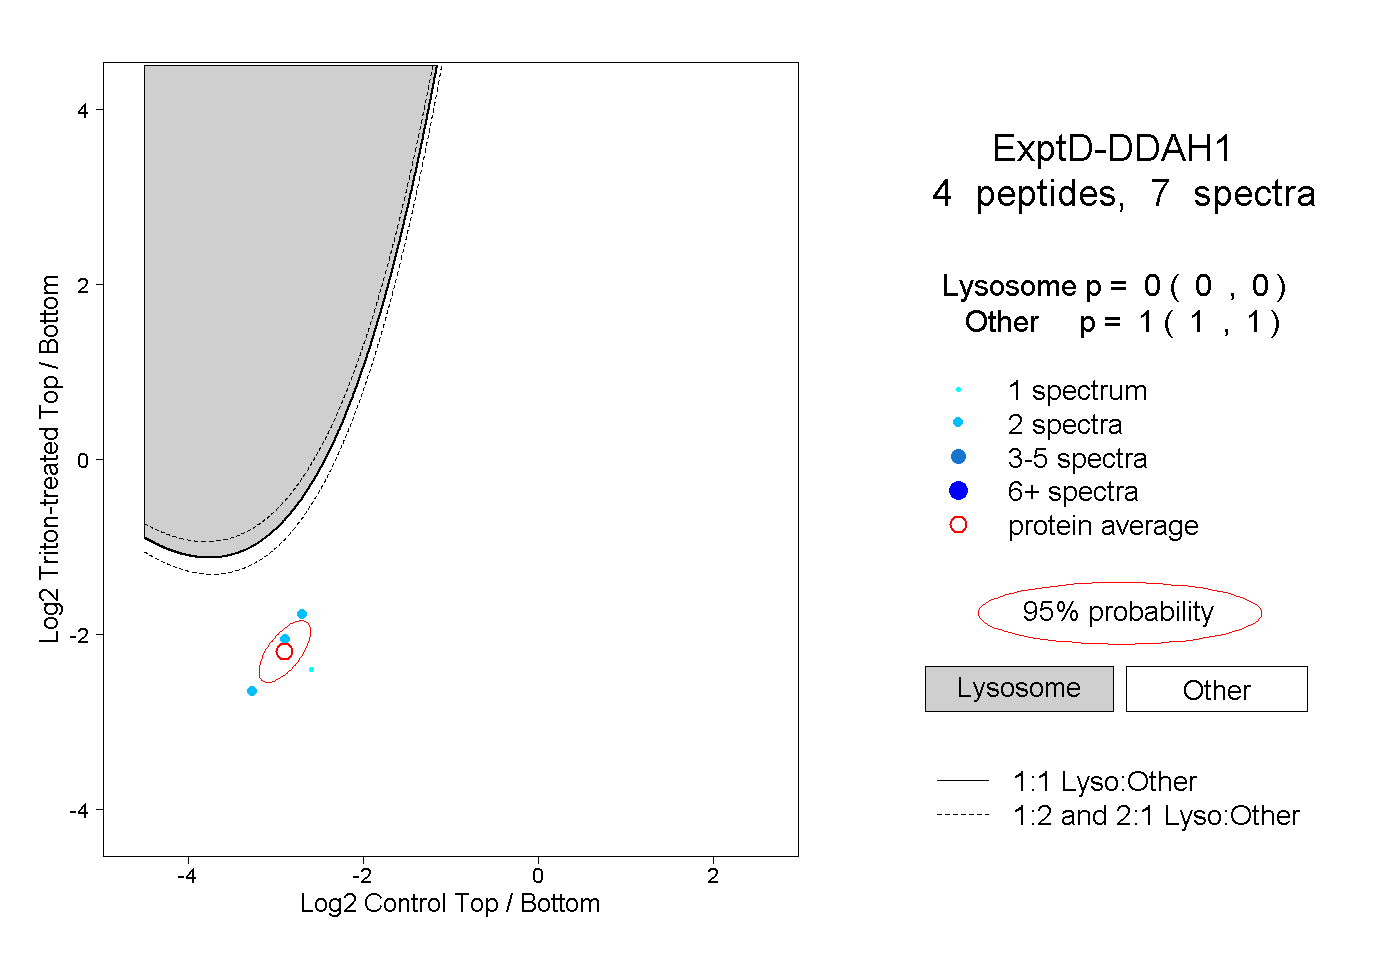
0.000 | 0.000
1.000 | 1.000