 10
10peptides
spectra
0.000 | 0.000
0.000 | 0.000
0.000 | 0.000
0.000 | 0.010
0.000 | 0.009
0.000 | 0.000
0.987 | 0.997
0.000 | 0.006
| Plot | Mito | Lyso | Perox | ER | Golgi | PM | Cytosol | Nucleus | |||||
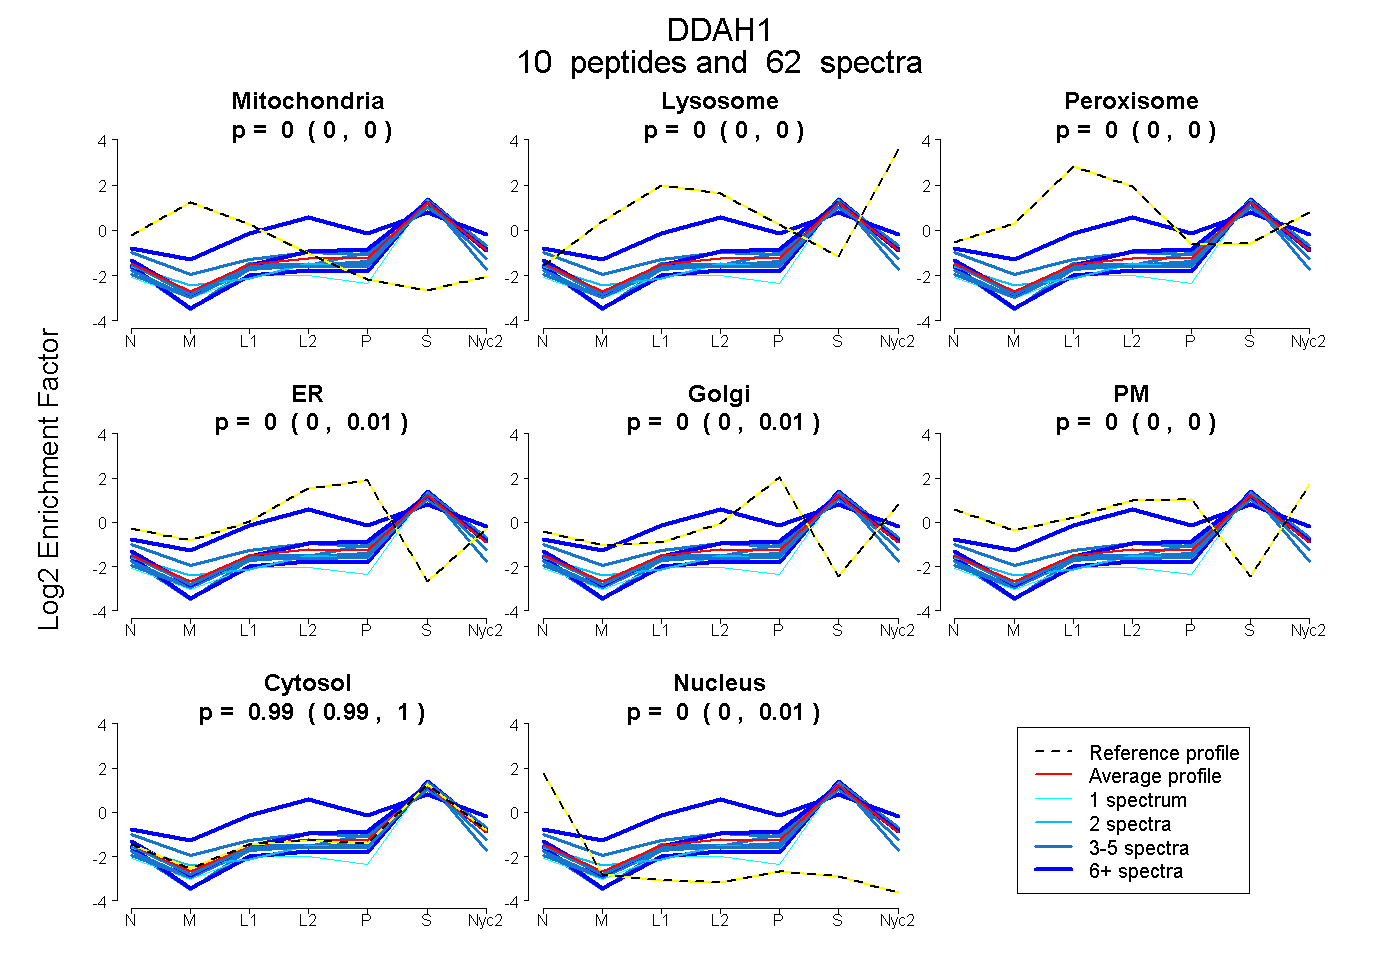
| Expt A |
10 peptides |
62 spectra |
|
0.000 0.000 | 0.000 |
0.000 0.000 | 0.000 |
0.000 0.000 | 0.000 |
0.003 0.000 | 0.010 |
0.002 0.000 | 0.009 |
0.000 0.000 | 0.000 |
0.994 0.987 | 0.997 |
0.000 0.000 | 0.006 |
| 2 spectra, LQLNIVEMK | 0.000 | 0.000 | 0.000 | 0.000 | 0.000 | 0.000 | 0.949 | 0.051 | ||
| 16 spectra, SQGEEVDFAR | 0.000 | 0.000 | 0.000 | 0.055 | 0.000 | 0.000 | 0.945 | 0.000 | ||
| 1 spectrum, DENATLDGGDVLFTGR | 0.000 | 0.000 | 0.000 | 0.000 | 0.000 | 0.000 | 0.976 | 0.024 | ||
| 5 spectra, EVDMMK | 0.000 | 0.000 | 0.000 | 0.000 | 0.000 | 0.000 | 1.000 | 0.000 | ||
| 4 spectra, TPEEYPESAK | 0.000 | 0.000 | 0.000 | 0.000 | 0.000 | 0.000 | 0.950 | 0.050 | ||
| 13 spectra, GHVLLHR | 0.000 | 0.007 | 0.293 | 0.164 | 0.000 | 0.000 | 0.536 | 0.000 | ||
| 4 spectra, QHQLYVGVLGSK | 0.030 | 0.000 | 0.025 | 0.000 | 0.000 | 0.083 | 0.863 | 0.000 | ||
| 5 spectra, ATHAVVR | 0.000 | 0.000 | 0.000 | 0.000 | 0.000 | 0.000 | 0.946 | 0.054 | ||
| 7 spectra, EFFVGLSK | 0.000 | 0.000 | 0.000 | 0.000 | 0.000 | 0.000 | 0.967 | 0.033 | ||
| 5 spectra, GAEILADTFK | 0.000 | 0.000 | 0.000 | 0.000 | 0.000 | 0.000 | 1.000 | 0.000 |
| Plot | Mito | Lyso or Perox | ER | Golgi | PM | Cytosol | Nucleus | ||||||
| Expt B |
6 peptides |
17 spectra |
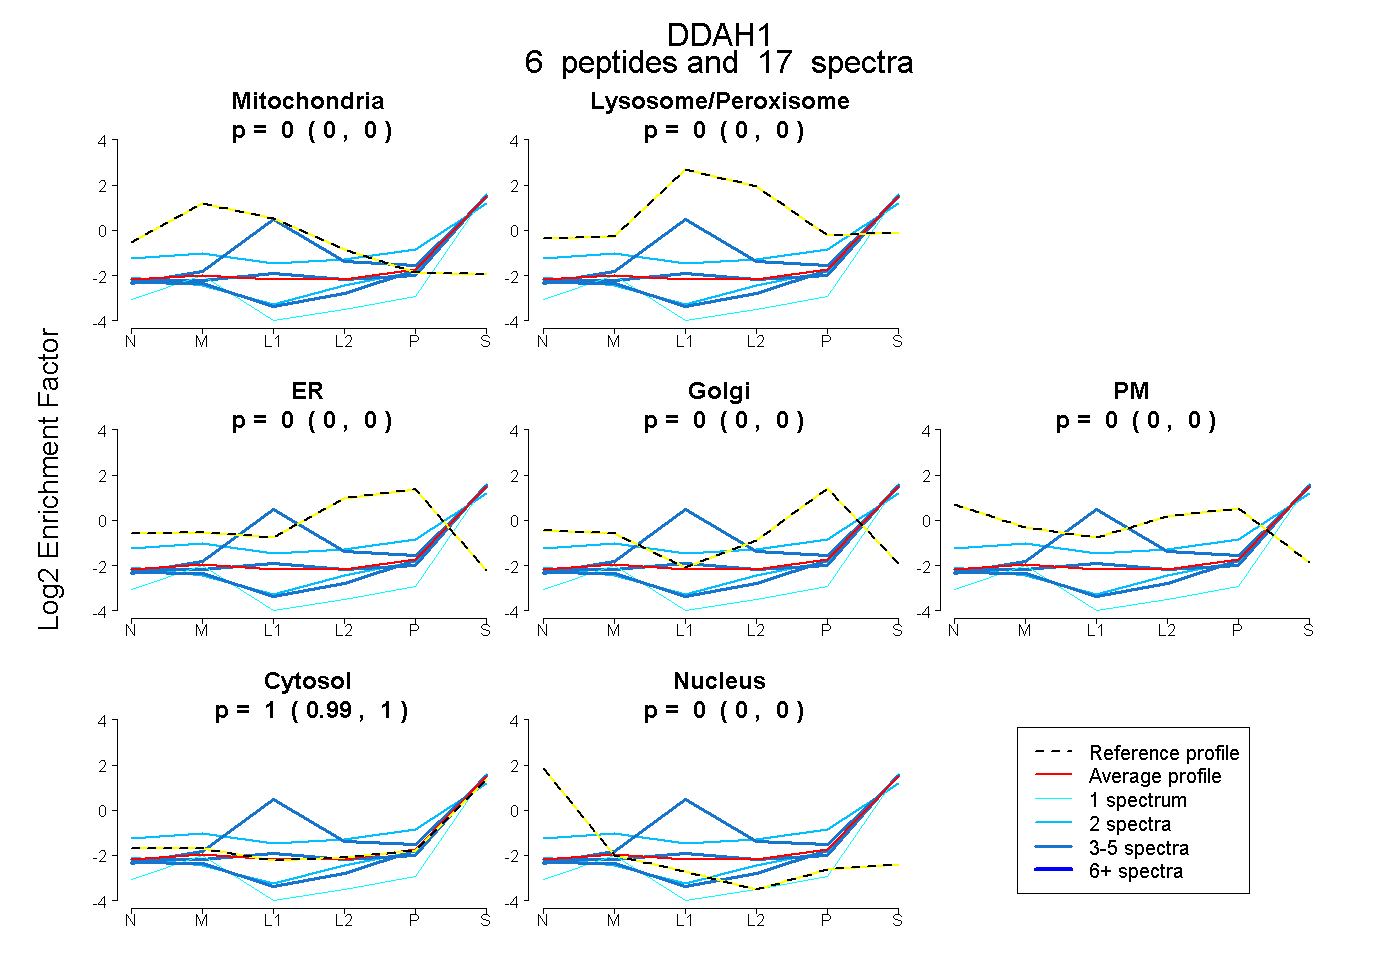 |
0.000 0.000 | 0.000 |
0.000 0.000 | 0.004 |
0.000 0.000 | 0.000 |
0.000 0.000 | 0.000 |
0.000 0.000 | 0.000 |
1.000 0.991 | 1.000 |
0.000 0.000 | 0.000 |
|||
| Plot | Lyso | Other | |||||||||||
| Expt C |
9 peptides |
69 spectra |
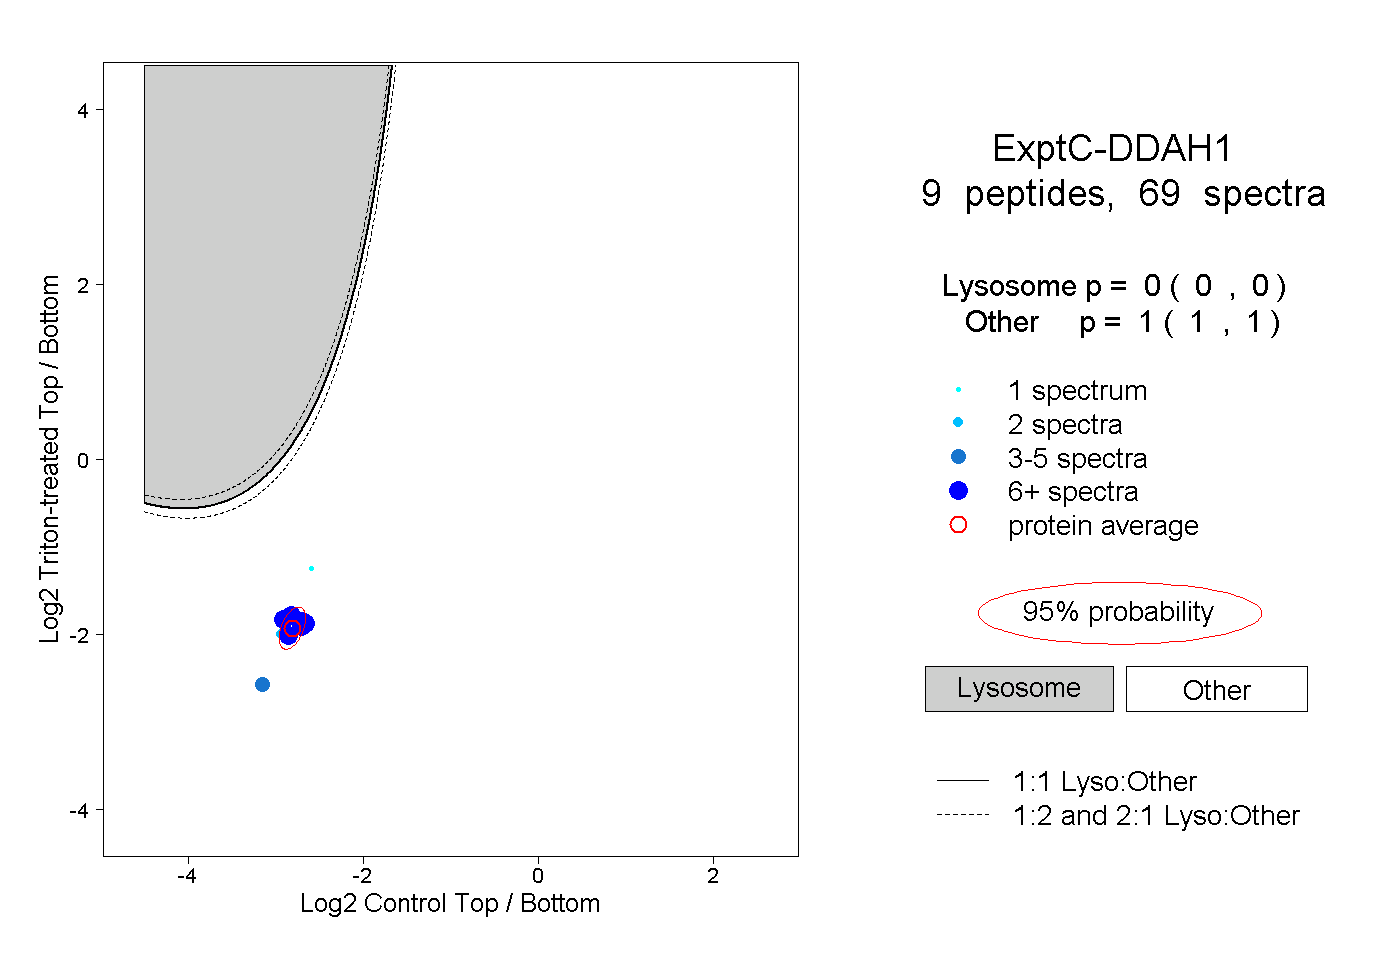 |
0.000 0.000 | 0.000 |
1.000 1.000 | 1.000 |
||||||||
| Plot | Lyso | Other | |||||||||||
| Expt D |
4 peptides |
7 spectra |
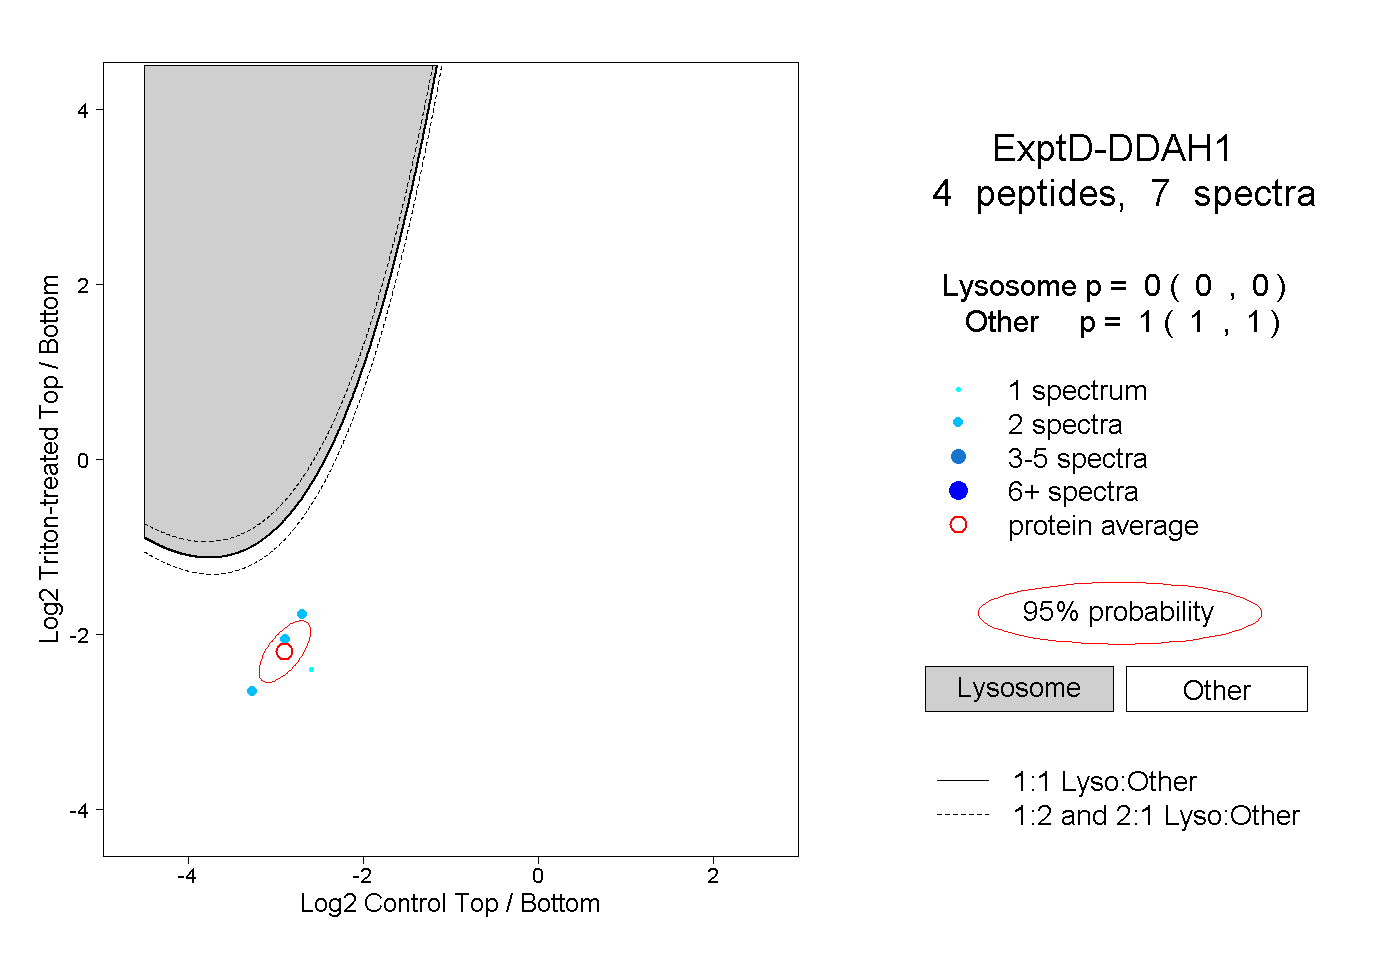 |
0.000 0.000 | 0.000 |
1.000 1.000 | 1.000 |