DDAH1
[ENSRNOP00000044971]
Main page
| | | Plot |
Mito |
Lyso |
|
Perox |
ER |
Golgi |
PM |
Cytosol |
Nucleus |
|
| Expt A |
 10
10
peptides |
62
spectra |
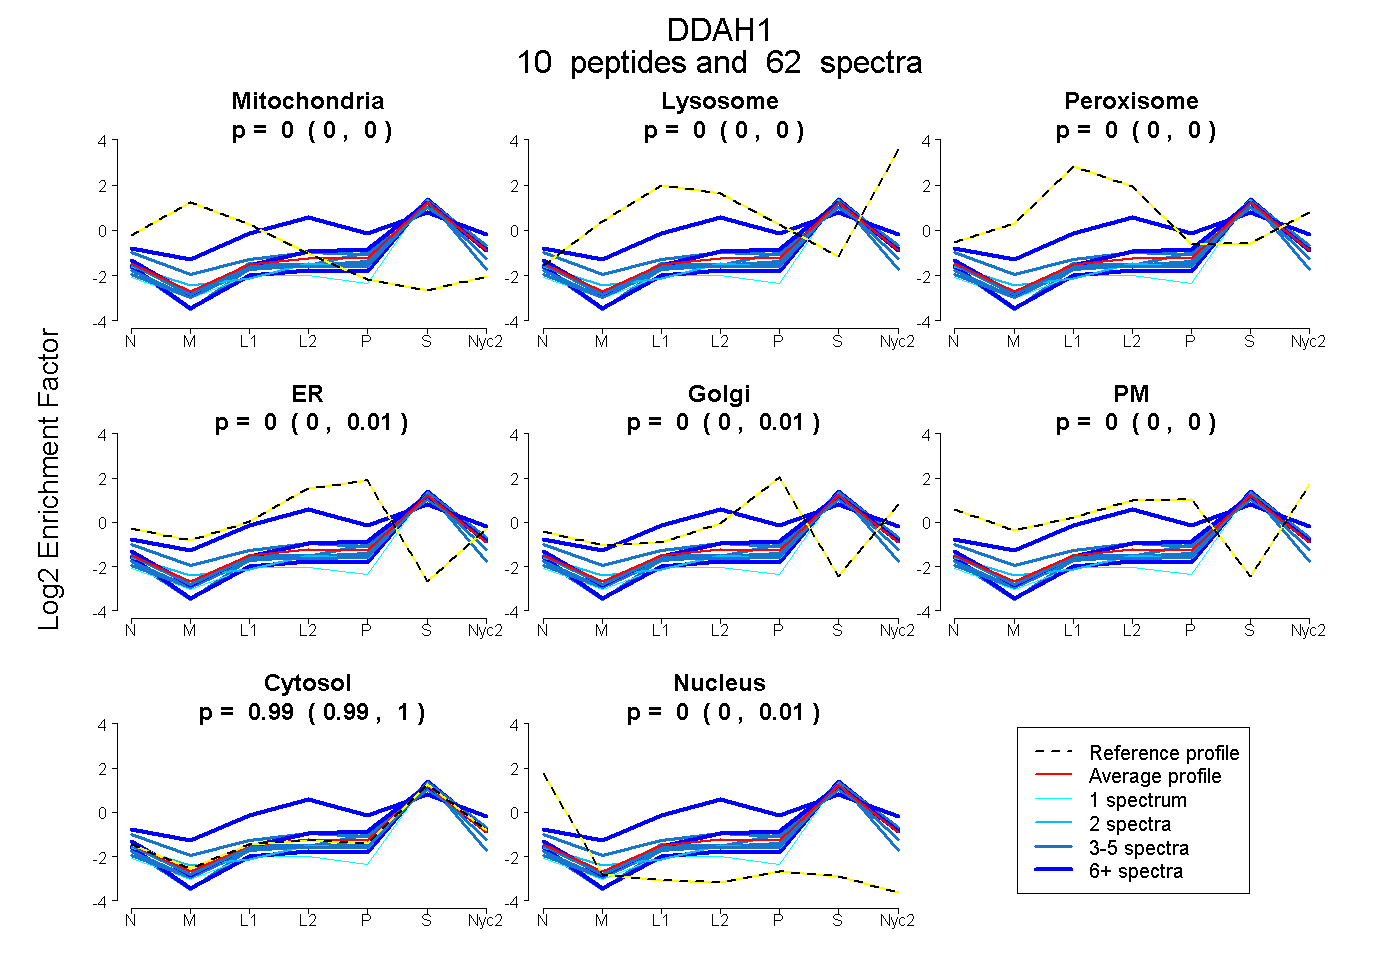 |
0.000
0.000 | 0.000 |
0.000
0.000 | 0.000 |
|
0.000
0.000 | 0.000 |
0.003
0.000 | 0.010 |
0.002
0.000 | 0.009 |
0.000
0.000 | 0.000 |
0.994
0.987 | 0.997 |
0.000
0.000 | 0.006 |
|
| | | Plot |
Mito |
|
Lyso or Perox |
|
ER |
Golgi |
PM |
Cytosol |
Nucleus |
|
| Expt B |
6
peptides |
17
spectra |
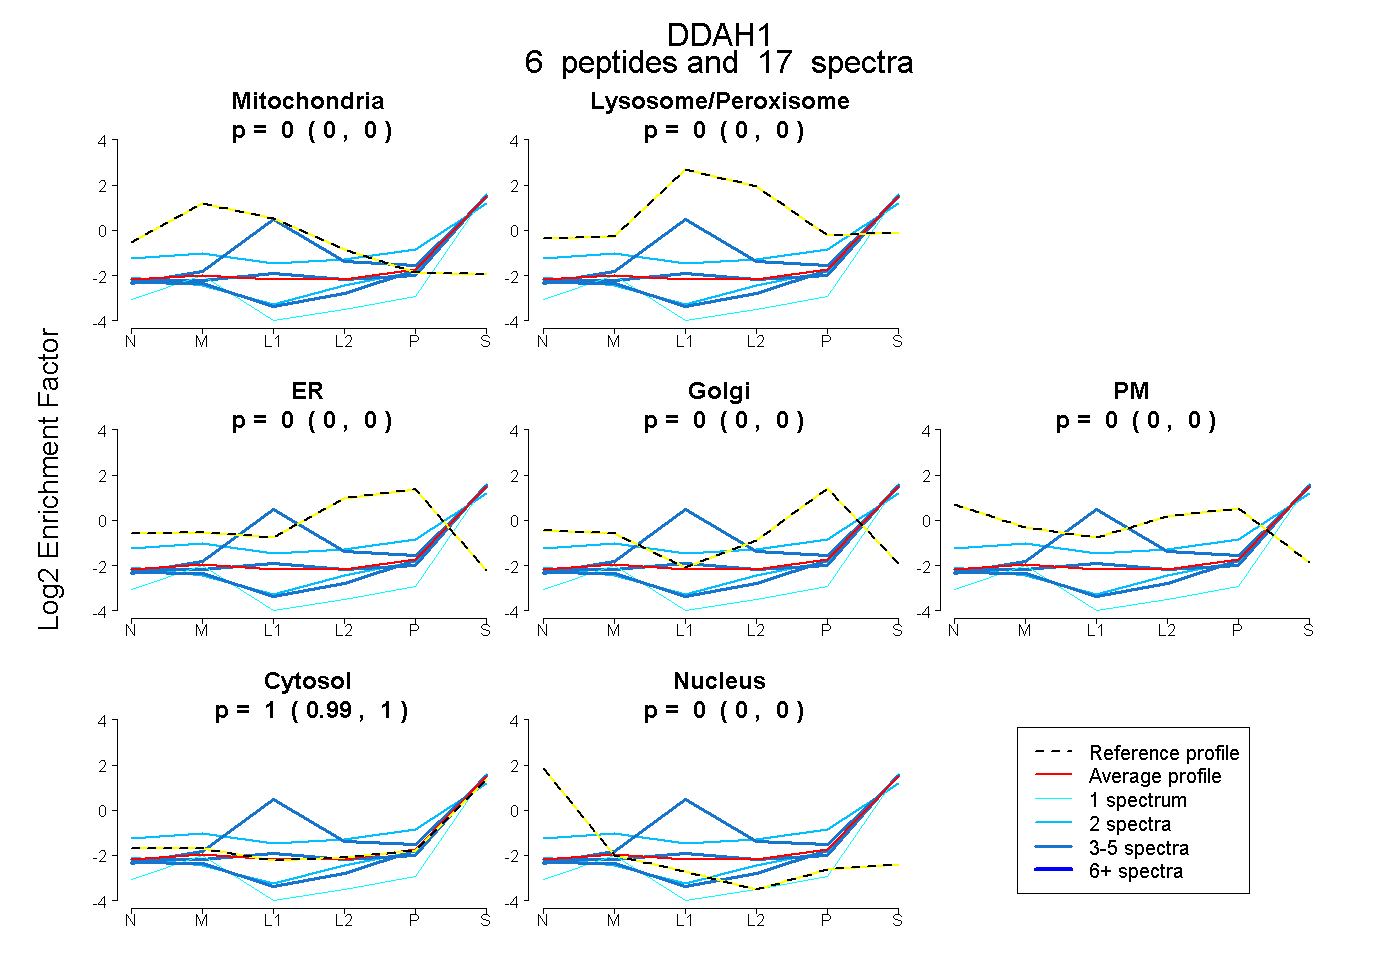 |
0.000
0.000 | 0.000 |
|
0.000
0.000 | 0.004 |
|
0.000
0.000 | 0.000 |
0.000
0.000 | 0.000 |
0.000
0.000 | 0.000 |
1.000
0.991 | 1.000 |
0.000
0.000 | 0.000 |
|
| | | Plot |
|
Lyso |
|
|
|
|
|
|
|
Other |
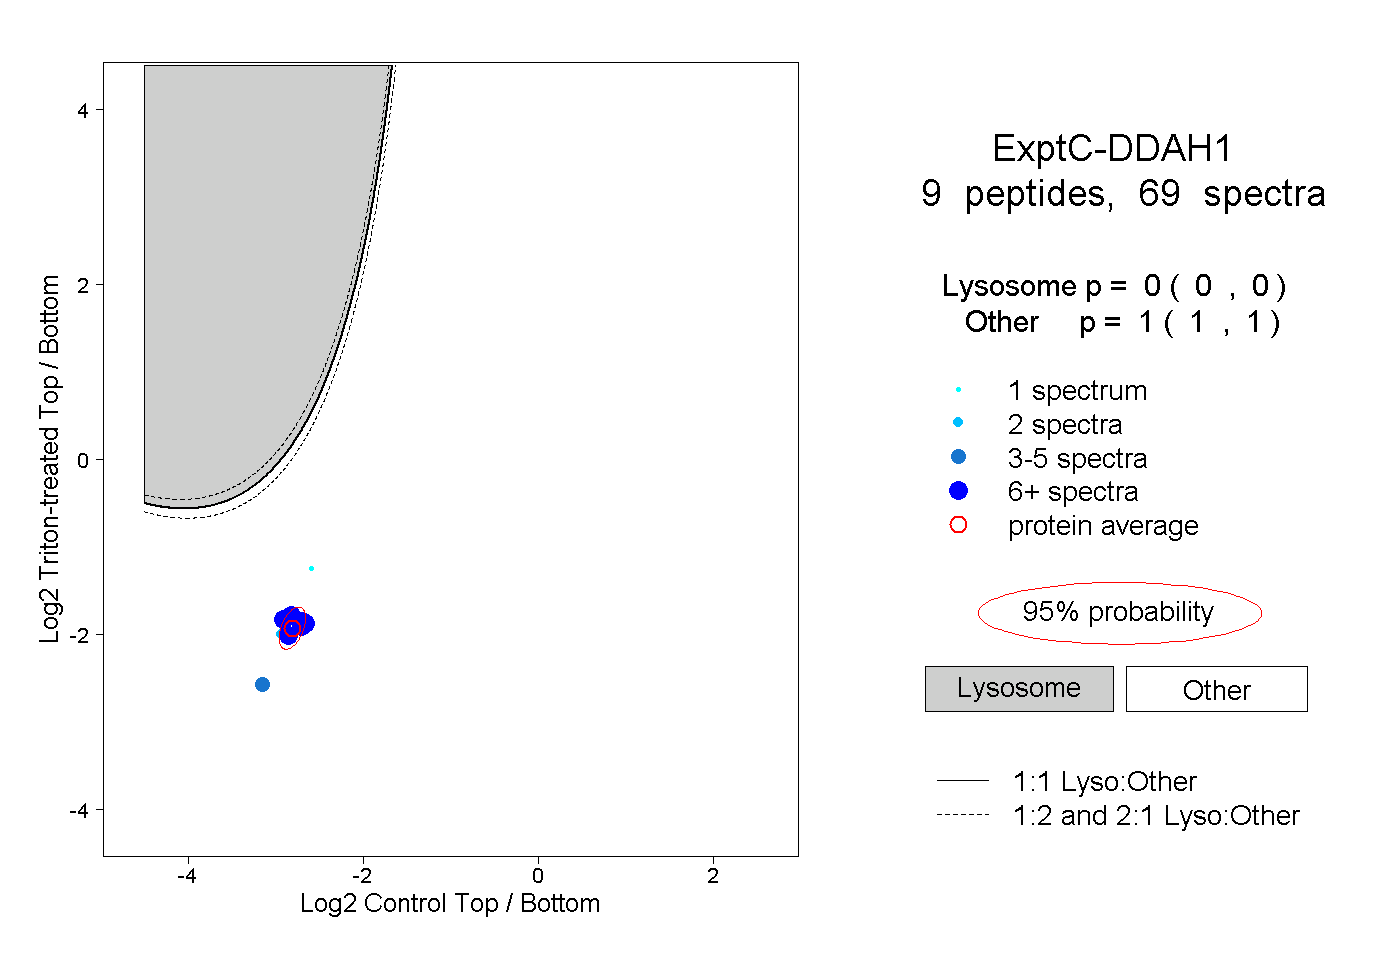
| Expt C |
9
peptides |
69
spectra |
 |
|
0.000
0.000 | 0.000 |
|
|
|
|
|
|
|
1.000
1.000 | 1.000 |
| 1 spectrum, LQLNIVEMK |
|
0.000 |
|
|
|
|
|
|
|
1.000 |
| 21 spectra, SQGEEVDFAR |
|
0.000 |
|
|
|
|
|
|
|
1.000 |
| 2 spectra, EVDMMK |
|
0.000 |
|
|
|
|
|
|
|
1.000 |
| 13 spectra, TPEEYPESAK |
|
0.000 |
|
|
|
|
|
|
|
1.000 |
| 3 spectra, GHVLLHR |
|
0.000 |
|
|
|
|
|
|
|
1.000 |
| 6 spectra, ATHAVVR |
|
0.000 |
|
|
|
|
|
|
|
1.000 |
| 10 spectra, EFFVGLSK |
|
0.000 |
|
|
|
|
|
|
|
1.000 |
| 6 spectra, GAEILADTFK |
|
0.000 |
|
|
|
|
|
|
|
1.000 |
| 7 spectra, APPESLCR |
|
0.000 |
|
|
|
|
|
|
|
1.000 |
| | | Plot |
|
Lyso |
|
|
|
|
|
|
|
Other |
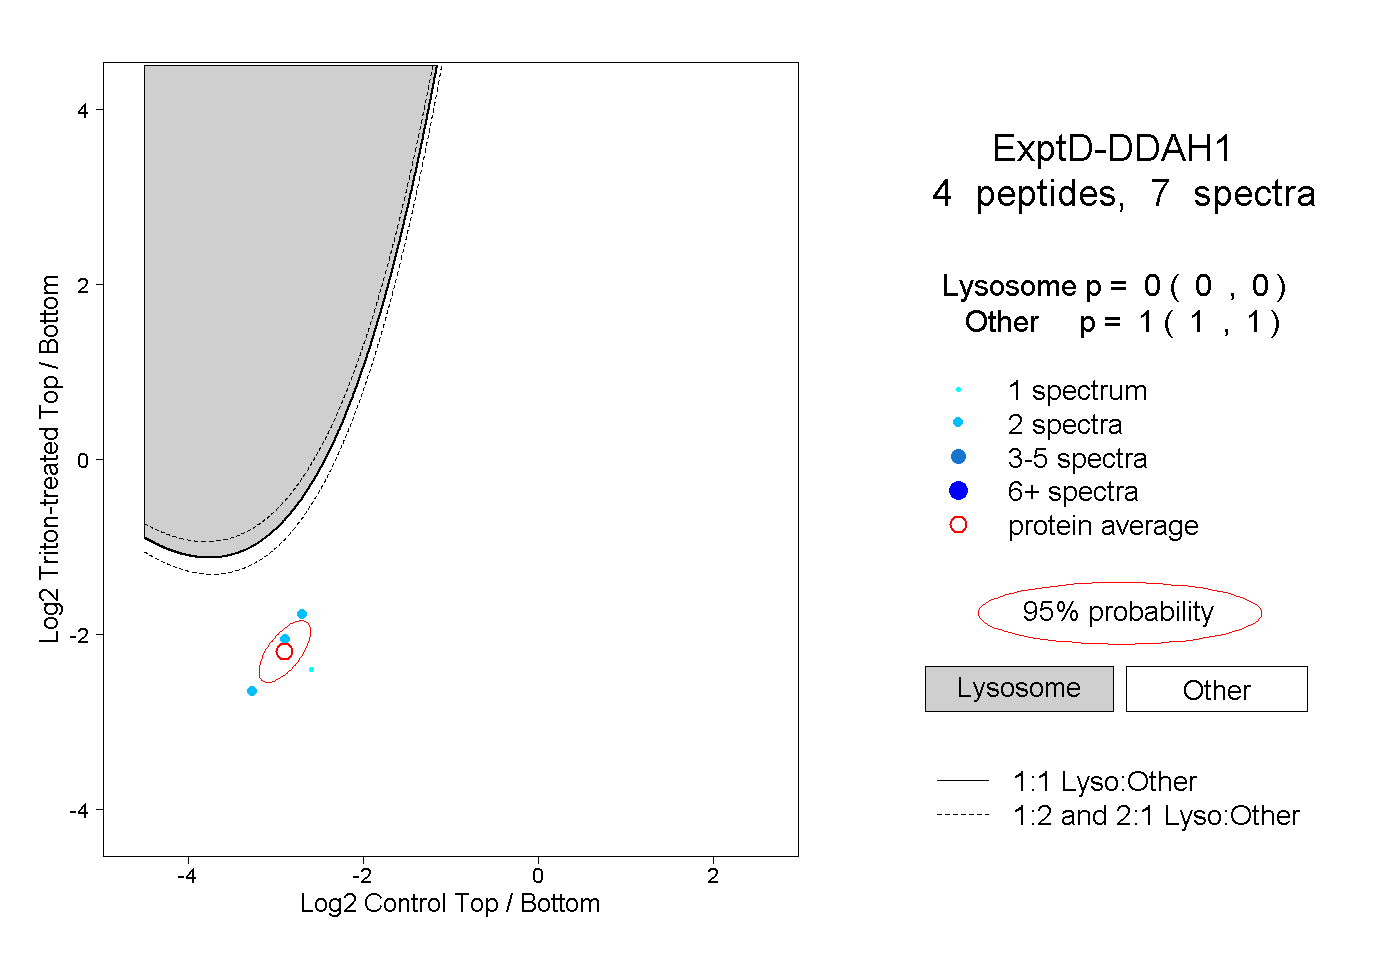
| Expt D |
4
peptides |
7
spectra |
 |
|
0.000
0.000 | 0.000 |
|
|
|
|
|
|
|
1.000
1.000 | 1.000 |